Introduction

This document is a translation into English of the Annual Financial Report/Universal Registration Document of the Company issued in French and is available on the website of the Issuer.

This Universal Registration Document was filed on 28 April 2023 with the AMF (the French Financial Markets Authority, Autorité des Marchés Financiers) in its position as the competent authority in respect of Regulation (EU) 2017/1129, without prior approval, in accordance with Article 9 of said Regulation. The Universal Registration Document may be used for the purpose of a public offer of financial securities or the admission of financial securities to trading on a regulated market if it is supplemented by a securities note (note d’opération) and, where relevant, a summary and all the amendments made to the Universal Registration Document. This set of documents is then approved by the AMF in accordance with Regulation (EU) 2017/1129. This document was prepared by the issuer and is binding upon its signatories. It may be consulted and downloaded from the website www.rubis.fr/en.

This document is a reproduction of the official version of the Universal Registration Document incorporating the 2022 Annual Financial Report, which was drawn up in ESEF format (European Single Electronic Format) and filed with the AMF, available on the websites of the Company and of the AMF.

Glossary

THE GROUP OR RUBIS

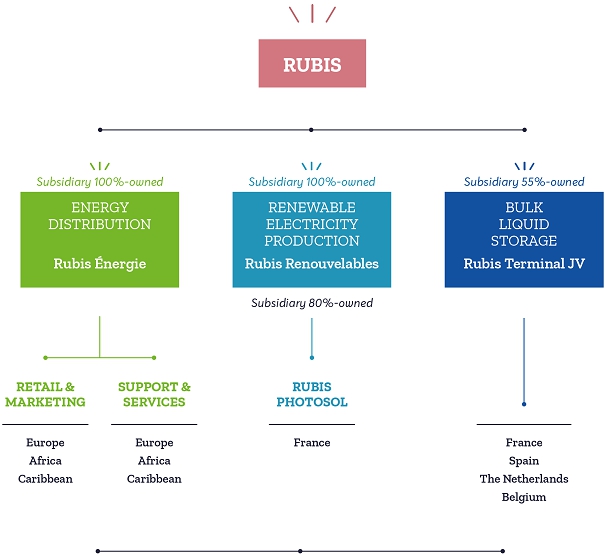
These terms refer to Rubis SCA, Rubis Énergie, Rubis Renouvelables, the Rubis Terminal JV, as well as their respective subsidiaries as presented in note 12 to the consolidated financial statements.


THE COMPANY OR RUBIS SCA

These terms refer to the holding company set up in the form of a Partnership Limited by Shares (Société en Commandite par Actions), and whose shares are listed on Euronext Paris.


RUBIS ÉNERGIE

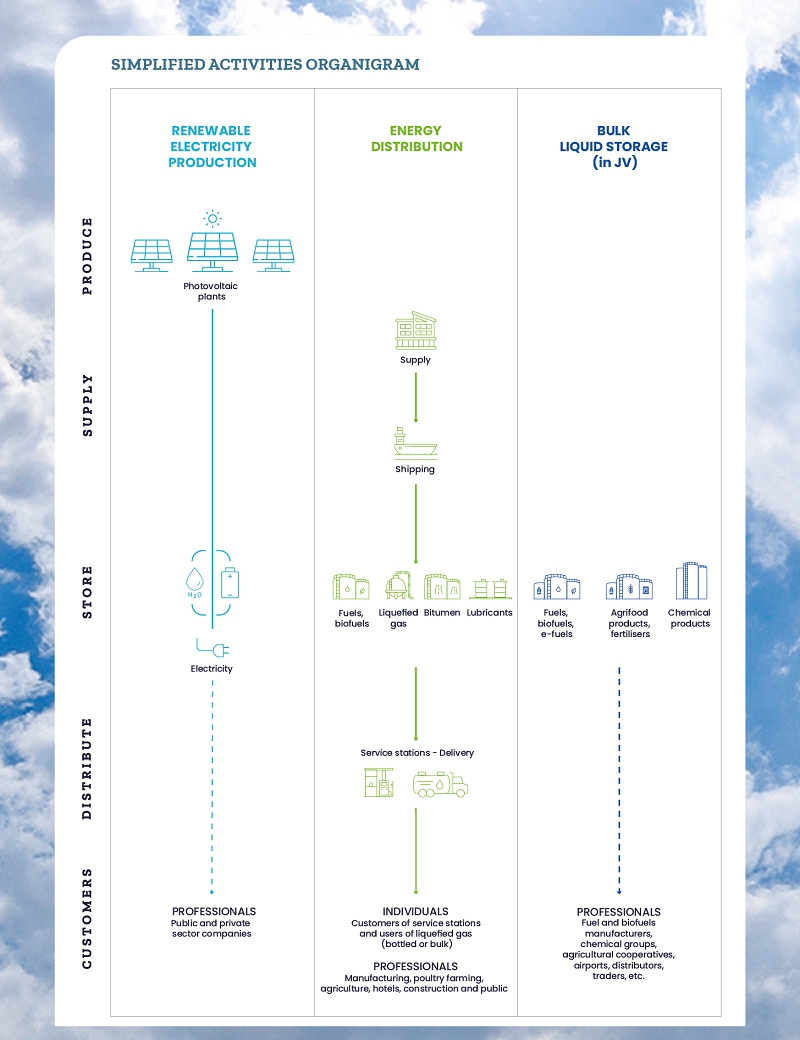
This term refers to Rubis Énergie SAS, a wholly-owned subsidiary of Rubis SCA, and its subsidiaries, whose two activities are, on the one hand, trading-supply, shipping and the Antilles refinery (Support & Services) and, on the other hand, distribution of energy and bitumen (Retail & Marketing).


RUBIS RENOUVELABLES

This term refers to Rubis Renouvelables SAS, a wholly-owned subsidiary of Rubis SCA, which holds a majority stake in Rubis Photosol SAS and a minority stake in HDF Energy and whose main business is the Production of Renewable Electricity.


RUBIS PHOTOSOL OR PHOTOSOL

These terms refer to Rubis Photosol SAS, a majority-owned subsidiary of Rubis Renouvelables, and its subsidiaries, whose activity is the Production of Photovoltaic Electricity.


RUBIS TERMINAL JV

This term refers to Rubis Terminal Infra, the operating subsidiary of RT Invest, and its subsidiaries, whose activity is Bulk Liquid Storage.


RT INVEST

This term refers to the parent company of Rubis Terminal Infra, owned 55% by Rubis SCA and 45% by Cube Storage Europe HoldCo Ltd (an investment vehicle set up by I Squared Capital).


Message from the Managing Partners

Since the acquisition of Photosol, Rubis has become a group with predominantly renewable assets in Europe.

SINCE ITS CREATION, RUBIS HAS BEEN COMMITTED TO SUPPLYING ENERGY SAFELY AND UNDER THE BEST POSSIBLE ECONOMIC CONDITIONS, THROUGH ITS VARIOUS BUSINESS LINES: DISTRIBUTING, STORING AND NOW PRODUCING RELIABLE AND AFFORDABLE ENERGY ON WHICH THE VARIOUS COUNTRIES WE OPERATE IN DEPEND.

We have always weathered external crises with no major impact on our operating results, thanks to the solidity of our business model based on:

•   a multi-product multi-country strategy ensuring better risk management;

•   the control of our logistics chain, from supply to the end consumer;

•   a long-term vision to ensure operational excellence and the sustainability of our activities;

•   a healthy financial position to finance our growth and development.

We have always adopted a long-term vision for the development of our projects and in the same mindset, the Rubis Renouvelables division was created last June.

In 2022, EBIT and net income, Group share (excluding non-recurring items) increased by 30% and 11% respectively compared to 2021. These excellent results were driven by the recovery in overall activity, particularly in the Caribbean, with a return to the pre-Covid situation, and increased unit margins across all our activities.

SERVING THE ENERGIES OF TODAY AND TOMORROW

The energy transition and the objectives of combating climate change encourage each region to diversify its energy sources and promote a less carbon-intensive energy mix, while taking local challenges into account. We are therefore continuing our development, adapting our responses locally in order to satisfy our customers’ needs, both individuals and professionals, whether in Europe, Africa or the Caribbean.

BECOMING A LEADING PLAYER IN RENEWABLE ELECTRICITY PRODUCTION IN EUROPE

In a European context that is turning to “all-electric” and renewable energies, the Photovoltaic Electricity Production activity has become a self-evident avenue to ensure the Group’s diversification. In France, for example, the government’s target for photovoltaic fleet capacity is 35 GWp by 2028, i.e., doubled in six years.

Since the acquisition of Photosol, Rubis has become a group with predominantly renewable assets in Europe. With a secure portfolio of 503 MWp, including 384 MWp in operation as of 31 December 2022, we aim to reach more than 1 GWp by 2026. There are many growth drivers for this business line: development of rooftops and shades for professionals, penetration of new European markets and innovation (storage, hydrogen, etc.).

FACILITATING ACCESS TO ENERGY AND INFRASTRUCTURE DEVELOPMENT IN AFRICA

Demographic growth and economic development in Africa are creating a real need for energy and infrastructure, particularly in roads. Whether through bitumen for road construction, liquefied gas as a cleaner and safer energy, substitute for current fuels, or through our network of modern service stations that comply with international standards, Rubis contributes to the economic and social growth of this region.

We have many development prospects and we are seizing opportunities to strengthen our market positions and expand our offerings of complementary services. We also plan to develop photovoltaic power plants for our professional customers.

CAPITALISING ON INTEGRATED LOGISTICS TO ADD TO OUR OFFER IN THE CARIBBEAN

The main challenge in the Caribbean is energy security to ensure its economic and social development. The island configuration creates challenges in terms of supply and cost of access to energy. The Group, through its control of the logistics chain, supported the recovery of activity in 2022 and is positioned as a key player. Several projects are being studied to install electric charging stations or solar panels for professional customers.

At the same time, we are developing two hydrogen-electricity power plant projects in collaboration with HDF Energy, with the aim of decarbonising electricity production and improving energy security in this region.

ADAPTING STORAGE TERMINALS TO SUPPORT THE ENERGY TRANSITION

The Rubis Terminal JV is also adapting to demand and gradually increasing the proportion of low-carbon products in our terminals, while securing sites for the storage of new generation products. 2022 revenue increased by 6% compared to 2021, supported by growth in chemical products and biofuels.

PURSUING OUR ACTIVE CSR APPROACH

We supplemented our commitments to reduce our carbon footprint with the setting of a target to reduce Scope 3A emissions and the definition of an internal carbon price to take carbon intensity into account in our strategic choices.

We can also mention several major projects launched this year: the mapping of human rights risks, the preliminary analysis of the impact of our activities on biodiversity and the overhaul of our Code of Ethics.

SPREADING OUR CORPORATE CULTURE

The Group’s development is driven by the will to undertake and the corporate commitment. This method of organisation has demonstrated its effectiveness: it is reflected in motivated and responsible teams and flexibility, allowing responsiveness and efficiency.

Our excellent operating results are thus the result of the total involvement of our employees, whom we thank for their professionalism, their daily commitment and their adaptability in a rapidly changing energy sector.

We are embarking upon 2023 with confidence, convinced that we will be able to improve our results once again this year.

Lastly, in line with its compensation policy for its loyal shareholders, the Group will once again propose the payment of an increased dividend this year.

We are committed to the trust you continue to place in us!

Gilles Gobin and Jacques Riou
Managing Partners

1. PRESENTATION of the GROUP

General Prensentaion

History

RUBIS IS AN INDEPENDENT FRENCH GROUP, WORKING AT THE HEART OF ENERGY FOR MORE THAN 30 YEARS TO PROVIDE SUSTAINABLE AND RELIABLE ACCESS TO ENERGY TO AS MANY PEOPLE AS POSSIBLE. WE MEET THE ESSENTIAL MOBILITY, COOKING AND HEATING NEEDS OF OUR INDIVIDUAL CUSTOMERS AND PROVIDE THE ENERGY NECESSARY FOR THE OPERATION OF INDUSTRIES AND PROFESSIONALS.

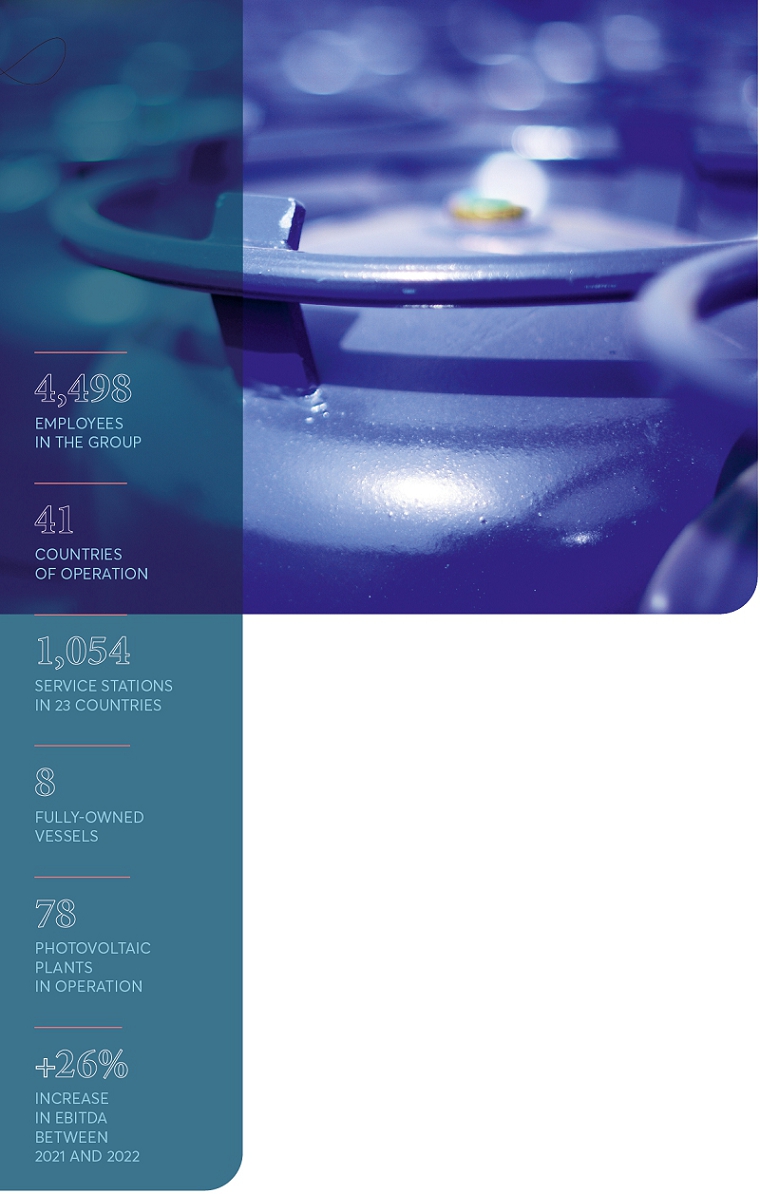
WITH NEARLY 4,500 EMPLOYEES SPREAD OVER THREE GEOGRAPHICAL AREAS (AFRICA, THE CARIBBEAN AND EUROPE), OUR GROUP IS ORGANISED IN A DECENTRALISED MANNER, ENABLING US TO OPERATE OUR ACTIVITIES AS CLOSELY AS POSSIBLE TO LOCAL CHALLENGES.

1990

Creation of Rubis.

1993

Acquisition of Compagnie Parisienne des Asphaltes, which will become Rubis Terminal. Launch of the Bulk Liquid Storage activity.

1994

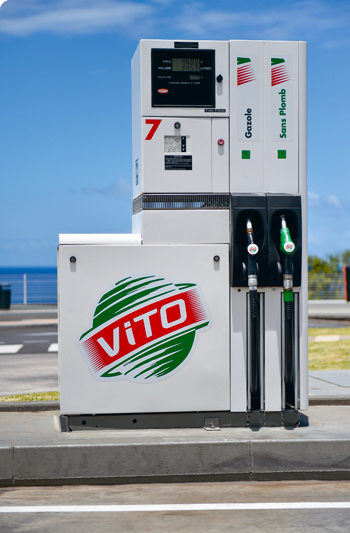
Acquisition of Vitogaz.
Launch of the Retail & Marketing activity in France, which will become Rubis Énergie.

1995

IPO on the Stock Exchange.

2000

Launch of international Retail & Marketing activities: Europe and Morocco, then the Antilles in 2005, Africa in 2010 and the Caribbean in 2011.

2008

International development of the Storage activity: Antwerp and Rotterdam, then Spain in 2020.

2015

New bitumen distribution activity and creation of the Support & Services activity, including trading-supply and shipping.

2020

Rubis Terminal becomes a joint venture.

2021

Acquisition of a stake in HDF Energy.

2022

Acquisition of 80% of Photosol France and creation of the Rubis Renouvelables division.

Aware of the energy sector’s key contribution to combating climate change, Rubis is diversifying its activities and its offering towards low-carbon solutions.

Key figures


THE FINANCIALYEAR WAS MARKED BY THE CREATION OF THE RUBIS RENOUVELABLES DIVISION, MAINLY COMPRISING RUBIS PHOTOSOL, CONSOLIDATED SINCE APRIL, BRINGING RUBIS DIRECTLY INTO THE ENERGY TRANSITION.


Following two years of health crisis, 2022 was marked by new extremes: a doubling in the price of oil, war in Ukraine, inflationary pressures, currency shocks and the end of the era of negative interest rates.


In this environment, the Group once again demonstrated the strength of its business model, generating growth in adjusted net profit(1) of 11%.


The multi-country, multi-segment positioning of Rubis Énergie, as well as its dual midstream/downstream structure, have enabled it to absorb the various external shocks while continuing to improve its EBIT. Rubis Photosol contributed over nine months to an EBITDA of €18 million, with an increase of +23% in plants commissioned compared to 2021. As for the Rubis Terminal JV, it increased its storage revenue by 6%.

(1) Net profit (loss) adjusted for non-recurring items (Haiti impairment, acquisition of Photosol, disposal of the terminal in Turkey and refinancing of Rubis Terminal) and IFRS 2.

STOCK MARKET INDICATORS

* Amount proposed to the Shareholders’ Meeting of 8 June 2023.

Strategy

A GROUP AT THE HEART OF ENERGY

RUBIS AIMS TO GIVE AS MANY PEOPLE AS POSSIBLE ACCESS TO RELIABLE AND SUSTAINABLE ENERGY WHILE DEVELOPING LESS CARBON-INTENSIVE SOLUTIONS, THEREBY PROMOTING SUSTAINABILITY.

We strive to meet the essential energy needs of populations in Africa, the Caribbean and Europe, both for travel (through a network of more than 1,000 service stations, bitumen activities which contribute to the construction of roads and infrastructure, as well as through the production of solar electricity) and for cooking and heating (thanks to liquefied gas sold in bulk or in bottles and to solar electricity). This role as a vital player in the daily life of populations puts the Group in an essential position and makes it largely immune to economic cycles.

A LEADER IN NICHE MARKETS OR MARKETS WITH HIGH GROWTH POTENTIAL

RUBIS IS POSITIONED IN MARKETS IN WHICH IT CAN OCCUPY LEADING POSITIONS. OUR SUCCESS IS ENSURED BY SEVERAL FACTORS, INCLUDING THE CONTROL OF THE IMPORT LOGISTICS TOOL, WHICH PROVIDES ADVANTAGES IN TERMS OF COSTS AND QUALITY OF SUPPLY. THIS STRATEGIC CHOICE GUARANTEES OUR CUSTOMERS LONG-TERM ACCESS TO THE ENERGY THEY NEED ON A DAILY BASIS.

The markets in which the Group operates are deep and energy needs are essential and growing, particularly in geographical areas where our presence has strengthened in recent years (Africa and the Caribbean).

In Europe, Rubis is positioned in sensitive markets, such as liquefied gas (butane and propane), with high barriers to entry, and where growth stems from efficiency, reactivity and market share gains.

In a context of rising collective awareness, at the European Union level and with the entry into force of several texts intended to promote renewable energies in Europe, the arrival of Rubis on the renewable energy market is a real growth driver in France and, in the short term, in Europe.

The organisation is decentralised, with each profit centre corresponding to a Group subsidiary. This system ensures that local managers have a deep understanding of their market and region and provides for an appropriate investment policy. This method of organisation has demonstrated its effectiveness. It results in motivated and responsible teams, flexibility allowing reactivity and efficiency, and market share gains.

In the majority of our geographical operations and for all types of products distributed, we are positioned among the top 3(1) players in the market.

(1) Rubis estimates.

BEING EFFICIENT OVER THE LONG TERM

FOR THE PAST 30 YEARS, RUBIS HAS PURSUED AN EXTERNAL GROWTH STRATEGY BASED ON STRICT FINANCIAL DISCIPLINE, INCLUDING MODEST ACQUISITION MULTIPLES AND FINANCIAL LEVERAGE, AND A CLEAR STRATEGIC APPROACH (NICHE POSITIONING, STRONG MARKET POSITIONS BACKED BY CONTROL OF RESOURCE ACCESS INFRASTRUCTURE AND OUTLOOK FOR EARNINGS GROWTH) TO ENSURE VALUE CREATION FOR ALL STAKEHOLDERS.

With each acquisition, the implementation of a strategy, our talented teams, the deployment of capital and setting up a new organisation, not forgetting the Company’s flexibility, have made it possible to form a multi-local, decentralised and independent group with sound market positions protected by concrete assets, guaranteeing its long-term profitability. Rubis thus posted solid performances.

    1 year   3 years   5 years   10 years   15 years  
    2021-2022   2019-2022   2017-2022   2012-2022   2007-2022  
EBITDA   +26%   +9%   +6%   +12%   +15%  
EBIT   +30%   +7%   +7%   +13%   +16%  
Net income, Group share   -10%   -5%   0%   +11%   +14%  
Earnings per share   -1O%   -6%   -2%   +6%   +7%  
Dividend per share   +3%   +3%   +5%   +8%   +8%  


CONTRIBUTING TO A MORE SUSTAINABLE WORLD

FOR MORE THAN 10 YEARS, WE HAVE PLACED OUR CSR COMMITMENTS AT THE HEART OF OUR STRATEGY. A NEW MILESTONE WAS REACHED IN 2021 WITH THE PUBLICATION OF OUR FIRST CSR ROADMAP, THINK TOMORROW 2022-2025, TO DESCRIBE OUR COMMITMENT, MEASURE OUR ACTIONS AND OFFER GREATER TRANSPARENCY TO OUR STAKEHOLDERS.

Think Tomorrow is a tool for managing our daily actions, a commitment to a sustainable future and an opportunity to develop our activities.

The Rubis Terminal JV is continuing to roll out its CSR principles in line with Rubis’ general principles. This year, it published its first 2022-2030 Roadmap and its first Sustainability Report.

For 2023, the Group’s CSR Roadmap will be rolled out at Rubis Photosol, which will conduct its first full carbon footprint assessment.

Our Think Tomorrow 2022-2025 Roadmap is based on three pillars:

  REDUCING OUR ENVIRONMENTAL FOOTPRINT

Description

As an energy player, we have a key role to play in the fight against climate change. Since 2019, we have been accelerating our projects on decarbonisation and the energy transition, in particular with the creation of a Climate Committee and the definition of a decarbonisation strategy. Likewise, since its creation, the Group has endeavoured to carry out its activities while minimising their environmental impact.


Main achievements 2022

•  Definition of an internal carbon pricing methodology.

•  Definition of an additional objective for the major items of scope 3A emissions (indirect emissions excluding products sold), i.e., -20% reduction in outsourced emissions from shipping and road transport externalised by 2030 (representing 45% of scope 3A, baseline 2019).

•  Preliminary analysis of the impact of our activities on biodiversity.

KEY OBJECTIVE

2030

Reduce the CO2 emissions
of our industrial sites, vessels
and trucks by 30% (scopes 1 and 2),
and by 20% for CO2 emissions
of our shipping and road transport
(scope 3A) (baseline 2019,
Rubis Énergie, at constant scope).

   PROVIDING A SAFE AND STIMULATING WORKING ENVIRONMENT

Description

Rubis has always put people at the heart of its concerns and ensures that it provides its employees with a safe working environment and supports their development.


Main achievements 2022

•  Establishment of a talent pool at Rubis Énergie.

•  Awareness-raising workshop on disability for General Managers of subsidiaries and CSR Advisors.

•  Number of women on the Management Committees (Rubis Énergie): 28.6% in 2022 vs 27.4% in 2021.

•  Frequency rate of occupational accidents down by 40% since 2015.

KEY OBJECTIVE

2025

Achieve 30% women on average
on the Management Committees of Rubis Énergie
and its subsidiaries.

  CONTRIBUTING TO A MORE VIRTUOUS SOCIETY

Description

The role of Rubis is to provide access to energy to as many people as possible, particularly in regions where a large part of the population is energy-deprived. Rubis ensures that this mission is carried out in compliance with international standards, by adopting responsible and solidarity-based behaviour wherever the Group is present.


Main achievements 2022

•  Human rights risk mapping

•  First Group CSR seminar, bringing together subsidiaries, General Managers, CSR Advisors and the functional departments.

•  Deployment of our e-learning anti-corruption module

KEY OBJECTIVE

2023

100% of employees made aware
of ethics and anti-corruption rules.

Business model

(1) These data include the Rubis Terminal JV.
(2) These data include the Rubis Terminal JV and exclude Rubis Photosol.
(3) Amount proposed to the Shareholders’ Meeting of 8 June 2023. Data as of 31 December 2022.

Overview of activities

Simplified organisation chart

Business lines

ENERGY DISTRIBUTION

WITH THE CREATION OF A DIVISION DEDICATED TO THE PRODUCTION OF RENEWABLE ELECTRICITY (RUBIS RENOUVELABLES), THE GROUP WISHED TO CONSOLIDATE ITS RETAIL & MARKETING AND SUPPORT & SERVICES ACTIVITIES (CARRIED OUT BY RUBIS ÉNERGIE) INTO A SINGLE DIVISION CALLED ENERGY DISTRIBUTION FROM JANUARY 2023.

Thus, Energy Distribution now includes the distribution of fuels, fuel oils, lubricants, liquefied gas and bitumen (Retail & Marketing) and logistics (provided through Support & Services), which includes trading-supply, the refinery activity (SARA) and shipping.

Rubis Énergie has effective control of the entire supply chain (purchasing, transport, storage, distribution) thanks to fully-owned and time-charter vessels, import terminals, gas cylinder filling plants and a network of 1,054 service stations.

THE GROUP ALSO PROVIDES ITS CUSTOMERS WITH LESS CARBON-INTENSIVE SOLUTIONS, SUCH AS BIOFUELS OR HYBRID SOLUTIONS INCORPORATING SOLAR ENERGY.

Retail & Marketing

Retail & Marketing represents 73% of the Energy Distribution division’s EBIT. The Group distributes its products to both private individuals (network of service stations and distribution of bulk and bottled liquefied gas) and professionals (manufacturing, poultry farming, agriculture, hotels, construction and public works, the transport sector, etc.).

This business benefits from diversification both geographically and by product segment, ensuring stable and resilient performance, little affected by geopolitics and economic cycles.

AFRICA

In Africa, the Group has a network of 556 service stations, spread over eight countries.The Group’s African subsidiaries have excellent market shares and are in the top 3(1) in most countries, across all market segments. Our main competitors in this area are NOC, Oilibya, Puma, TotalEnergies, Vivo Energy (Shell and Engen brands), as well as independent local players.

The growth levers identified on this continent seeing rapid expansion, both demographic and economic, are as follows:

•   fuels in service stations

Since 2021, in East Africa, a vast programme of renovation and rebranding of “RUBiS” service stations has been underway.The customer offering has also been enriched by additional services (convenience stores, catering services, car washing, minor maintenance, etc.) which increase footfall and therefore volumes;

•   bitumen

The need for road infrastructure continues to grow in the area, as illustrated by the significant development of the bitumen distribution business. From three countries when it entered this sector (in 2015, with the acquisition of Eres), the Group is now present in eight countries, the most recent being Angola (in early 2023);

•   liquefied gas as an alternative energy

Liquefied gas is considered the best energy alternative to charcoal and wood for cooking and heating. The governments of South Africa, Madagascar and Kenya are therefore targeting a significant increase in the market penetration of liquefied gas and investing in infrastructure designed to develop this energy (storage terminals, in particular).

BREAKDOWN OF VOLUMES BY PRODUCT SEGMENT

(1) Rubis estimates.

CARIBBEAN

Like Africa, Rubis manages the entire supply chain and has a network of 406 service stations, spread over 18 territories. The Group has very good market shares and is in the top 3 (1) in most countries, across all market segments. The main competitors in this region are GB Group, Guyoil, Parkland (Sol), and TotalEnergies, as well as independent local players.

BREAKDOWN OF VOLUMES BY PRODUCT SEGMENT

The growth levers identified for these niche markets are as follows:

•   geographic expansion

To meet the needs of companies and manufacturers, and in particular to support existing customers, Rubis has chosen to develop its commercial activity in new markets, such as Guyana and Suriname;

•   the development of non-fuel revenues in service stations

In its network of service stations, Rubis is developing new customer services that generate additional revenue to the historical distribution activity. These modern, lively and high quality service stations contribute significantly to the Group’s excellent brand image in the region;

•   the development of marine biofuels

The Group has expanded its offering to its professional customers by offering low-sulphur fuel oils, as well as HVO (Hydrotreated Vegetable Oil) to supply vessels in the area. HVO is a 100%-renewable fuel that drastically reduces CO2 emissions.

(1) Rubis estimates.

EUROPE

In Europe, Rubis is mainly present in the liquefied gas segment, the Group’s long-standing activity under the Vitogaz brand, with residential and professional customers. This segment represents more than 90% of earnings in the region. In Corsica and the Channel Islands, Rubis distributes fuels through a network of 92 service stations, and also offers aviation and marine fuels. In most of the European countries in which it operates, the Group is in the top 3(1) market players, facing competitors such as Cepsa, DCC, Galp, Repsol, SHV and UGI.

BREAKDOWN OF VOLUMES BY PRODUCT SEGMENT

The growth levers identified for these mature markets are as follows:

•   LPG-fuel

The Group distributes LPG-fuel in France, Spain, Switzerland and Portugal.This alternative to conventional fuels produces less CO2 and almost no particles. The private vehicule market has seen the emergence of many new models incorporating this technology;

•   biofuels

Rubis is positioned in the distribution of biofuels, such as HVO (biofuel made from used oils, which reduces CO2 emissions by 90% compared to the use of conventional diesel) or EcoHeat100, a 100%-renewable domestic fuel currently marketed in the Channel Islands;

•   hybrid solutions

The Group is developing new hybrid solutions to support its professional customers in their energy transition. In partnership with Rubis Photosol, projects combining liquefied gas and solar panels have been developed for manufacturing and agricultural professionals.

(1) Rubis estimates.

Support & Services

SUPPLY AND SHIPPING

For its own needs, but also with a view to optimising its resources, Rubis now has 16 vessels to handle all its shipping operations; some of these vessels are owned by the Group (five bitumen tankers, three fuel tankers, as well as two new liquefied gas transport vessels since February 2023), the others being chartered on a time charter basis.

Rubis is a member of the Sea Cargo Charter, an initiative in favour of responsible shipping, greater transparency in climate reporting and better decision-making for the chartering of vessels, in accordance with the United Nations decarbonisation targets and the CO2 emission reduction targets set in the Group’s CSR Roadmap, Think Tomorrow 2022-2025.

REFINING AND STORAGE

The Antilles refinery (SARA), 71%-owned by Rubis Énergie, is located in Martinique and is the sole supplier of fuels to the three French departments in the Americas: French Guiana, Guadeloupe (and its dependencies) and Martinique. The retail prices for products and the profitability of SARA are regulated by the public authorities through a decree. It has a production capacity of 800,000 tonnes per year and produces a full range of products complying with European environmental standards: fuels for road, sea and air mobility, liquefied gas, etc., adapted to local needs. SARA wants to go even further and is positioning itself as both a producer and supplier of low-carbon fuels for land, air and maritime mobility, such as hydrogen and biofuels.

RENEWABLE ELECTRICITY PRODUCTION

RUBIS RENOUVELABLES INCLUDES THE ACTIVITIES OF RUBIS PHOTOSOL, ACQUIRED IN APRIL 2022, AS WELL AS THE 18.5% STAKE IN HDF ENERGY. IN THE MEDIUM TERM, THE OBJECTIVE FOR THIS DIVISION IS TO CONTRIBUTE 25% OF THE GROUP’S EBITDA.

Photovoltaic electricity: Rubis Photosol

Photosol is one of the independent leaders in photovoltaic production in France with 384 MWp of operational capacity (78 plants) and 119 MWp under construction. From the development of facilities to dismantling, including design, financing, operation and maintenance, Photosol is present throughout the whole value chain.The electricity produced is mainly resold through long-term contracts obtained through the call for tenders mechanism of the French Energy Regulatory Commission (CRE). Photosol is also positioned in the emerging market of Corporate Power Purchase Agreements (CPPA), with an initial contract signed in early 2023 to supply renewable electricity, over the long term, to some of the French sites of the Leroy Merlin brand. Several other projects are in discussions to diversify commercial outlets.

In France, the only country where it operates, Rubis Photosol competes with multinational subsidiaries such as Engie, TotalEnergies and the Mulliez Group (Voltalia), as well as independent producers such as Neoen, Tenergie and Akuo Energy. Rubis Photosol is very well positioned on the French solar energy market, with an identified project portfolio of more than 3.5 GWp, and ranks among the leading players in the sector in terms of megawatts owned and operated, as well as in terms of winning volumes of photovoltaic tenders in France(1).

Photosol mainly focuses on large ground-based or shade-type power plants, with recognised know-how in the field of agrivoltaics. The Company has deliberately focused on less-competitive strategic locations and on the development of complex projects to stand out from the major groups present in this market, a strategy very similar to that developed by Rubis internationally. Numerous synergies exist to develop this activity in areas where the Rubis Group is present.

(1) Source Finergreen.

Since the end of 2022, with the purchase of the assets of Mobexi, Photosol has added to its offer by entering the shade segment for large roofs and car parks (capacity of between 100 kWp and 3 MWp), in order to best meet the energy needs of companies in the public and private sectors, local authorities and the agricultural world.

Finally, Rubis Photosol aims to expand its development in several European Union countries where the Company could capitalise on the know-how it has acquired in France.

Hydrogen-electricity: HDF Energy

HDF Energy is the global pioneer in hydrogen-electricity. As part of its acquisition, Rubis entered into an industrial and financial agreement that notably provides for a majority investment priority in the projects that HDF Energy is developing in Africa, the Caribbean and Europe.

The Group has already invested in two future Renewstable® plants developed by HDF Energy in French Guiana and Barbados. Each of these plants will have an installed capacity of 50 MWp. The context of an island economy, characterised by the high cost of carbon-based energy, makes it possible to consider several similar projects in the Caribbean, as well as the Indian Ocean and the Mediterranean region.

HDF is also working in collaboration with Rubis Terminal on the construction of a first hydrogen barge for the electrification of quayside vessels in the port of Rouen.This barge will supply electricity and hydrogen to large vessels, reducing their polluting emissions during stopovers by more than 80%. In the long term, this concept could be extended to the ARA zone.

BULK LIQUID STORAGE (JOINT VENTURE)

THE RUBIS TERMINAL JV SPECIALISES IN THE STORAGE AND HANDLING OF BULK LIQUID AND LIQUEFIED PRODUCTS, SUCH AS CHEMICAL PRODUCTS, FUELS, BIOFUELS AND AGRIFOOD PRODUCTS. ITS ROLE IS TO ACT AS AN ESSENTIAL LINK IN THE LOGISTICS CHAIN OF ITS CUSTOMERS (SUPERMARKETS, OIL GROUPS, CHEMICAL AND PETROCHEMICAL COMPANIES, TRADERS, ETC.) BY STORING THEIR LOCAL OR IMPORTED PRODUCTS, FOR SHORT OR LONG PERIODS ACCORDING TO THEIR NEEDS.

Following the signing of a partnership with the infrastructure fund I Squared Capital, Rubis Terminal is now 55%-owned by Rubis SCA and accounted for under the equity method since 30 April 2020. The Company is the fourth-largest terminal operator in Europe and the largest in France(1).

The joint venture has a storage capacity of 4 million m3. Its 15 terminals are located in strategic hubs in France, the Netherlands, Belgium and Spain, where they benefit from maritime, river, pipeline, rail and road connections.

Rubis Terminal is diversifying its product range by developing biofuels, the storage of French strategic reserves, chemical products and the agrifood sector, which accounted for nearly 70% of storage revenues in 2022.

Today, the increasing storage volumes dedicated to UCO (used cooking oils) in Spain, biofuels (such as B100 and E85) in France and Spain, and the launch of our ethanol hub in the Netherlands illustrate this shift towards less carbon-intensive products. Rubis Terminal has become one of the largest chemical stockists in Europe.The integration of new products, in particular biosourced, as well as new long-term energies such as green hydrogen, following the signature of a Memorandum of Understanding in October 2022, are among the next major steps.

In 2022, Rubis Terminal inaugurated new capacities in Rotterdam and Antwerp. The year 2023 will be marked by the start-up of operations of new tanks for chemical products in Tarragona (Spain) during the first quarter and capacity extensions in the ARA zone over the short/medium term.

(1) Based on capacities excluding crude oil, excluding competitors who have their own pipeline network.

2. ACTIVITY REPORT

2.1 Activity report for the financial year 2022


Rubis Group


Following the 2020-2021 health crisis, 2022 was marked by new extremes: a doubling in the price of oil, war in Ukraine, inflationary pressures, currency shocks and the end of the era of negative interest rates. In this environment, the Group once again demonstrated the strength of its business model, generating growth in adjusted net profit of 11%.

Rubis Énergie’s multi-country and multi-segment positioning, as well as its dual midstream/downstream structure, have enabled it to absorb the various external shocks, while the Rubis Terminal JV once again demonstrated its resilience with a 6% increase in its storage revenue and succeeded in refinancing its debt under better conditions, while increasing its duration and leverage.

Lastly, the financial year was marked by the creation of the Rubis Renouvelables division, mainly comprising Photosol, the French ground photovoltaics specialist, consolidated since 1 April, bringing Rubis directly into the energy transition.

CONSOLIDATED RESULTS

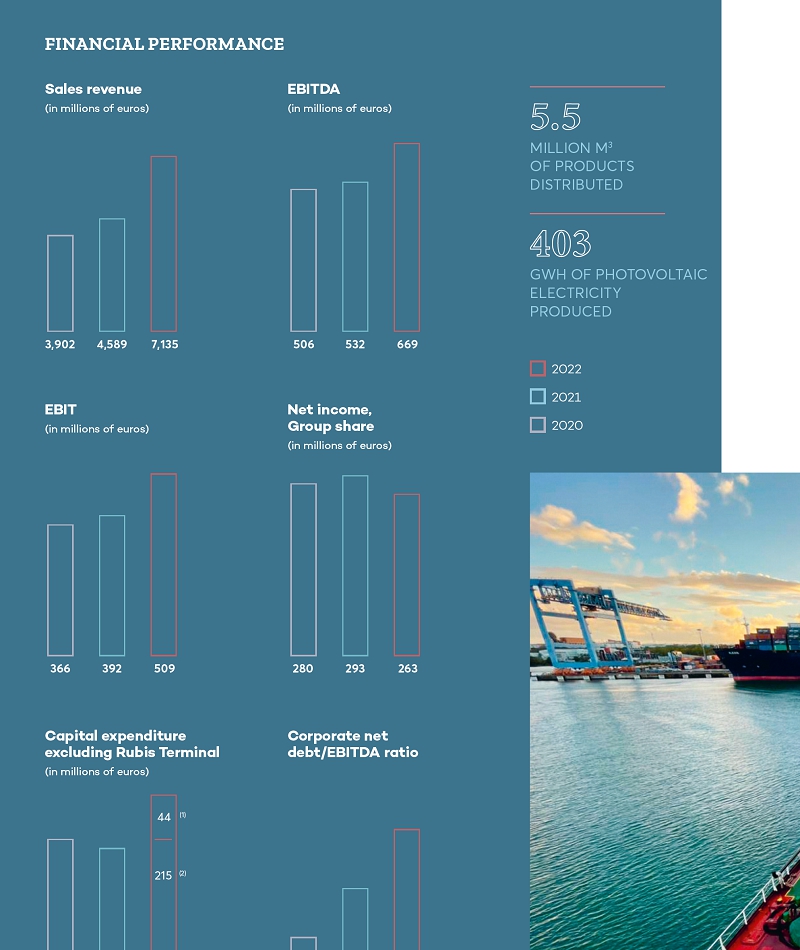
(in millions of euros) 2022 2021 Change
Revenue 7,135 4,589 +55%
EBITDA, of which 669 532 +26%
•  Rubis Énergie 680 551 +23%
•  Rubis Renouvelables 18 NA  
EBIT, of which 509 392 +30%
•  Rubis Énergie 540 412 +31%
•  Rubis Renouvelables (1) NA  
Net income, Group share 263 293 -10%
Adjusted net income(1), Group share 326 293 +11%
Diluted adjusted earnings per share(1) (in euros) 3.16 2.86 +10%
Dividend per share (in euros) 1.92(2) 1.86 +3%
Cash flow 432 465 -7%
Net financial debt (NFD) 1,286 438  
NFD/EBITDA 2.0x 0.9x  
Corporate net financial debt (corporate NFD)(3) 930 438  
Corporate NFD/EBITDA 1.5x 0.9x  
Capital expenditure, of which 259 206  
•  Rubis Énergie 215 206  
•  Rubis Renouvelables 44    
(1) Net profit (loss) adjusted for non-recurring items (Haiti impairment, acquisition of Photosol, disposal of the terminal in Turkey and refinancing of Rubis Terminal) and IFRS 2.
(2) Amount proposed to the Shareholders’ Meeting of 8 June 2023.
(3) Excluding non-recourse debt at the Photosol SPV level.

The sharp increase in EBITDA and EBIT in 2022 (26% and 30% respectively) includes the transfer to the sale price of the foreign exchange risk on certain emerging countries: the shortage of dollars was particularly felt in Nigeria, Kenya, Haiti and Suriname, exposing the currency balances in these countries to a risk of depreciation while they were converted into dollars to settle supplies. “Other finance income and expenses” reflects the corresponding losses or provisions for an amount of €80 million compared to €11 million for 2021. EBITDA and EBIT, adjusted for the foreign exchange impact in Nigeria, showed increases of 20% and 21% respectively. The situation experienced in 2022 is considered exceptional: the sale price, whether regulated or unrestricted, must include the translation risk. Where prices are unrestricted (Nigeria), customer invoicing has gradually integrated this risk. As for countries where margins are administered but where a temporary cap on prices at the pump has been put in place (with a corresponding subsidy), the profession and the authorities are in discussion to compensate the losses incurred.

The Group retains a strong ability to bounce back, with the Caribbean region driven by the economic dynamism of the North American continent, favouring tourism, good growth potential in East Africa thanks to a completely repositioned distribution franchise and a booming bitumen sector in Africa, as well as niche positions in LPG distribution in Europe, ensuring strong cash flow generation.

While the Group’s investments will increase in the photovoltaic sector from 2023 with the materialisation of a project portfolio exceeding 3.5 GWp for nearly €700 million between 2022 and 2026, the Group is not ruling out acquisitions in its historical sector, with a financing capacity of around €400 million, while maintaining its ability to pay dividends and ensuring a solid financial position.

FINANCIAL STRUCTURE

(in millions of euros) 31/12/2022 31/12/2021
Total equity 2,860 2,736
•  of which Group share 2,733 2,617
Cash 805 875
Financial debt excluding lease liabilities 2,091 1,313
Net financial debt(1) 1,286 438
Corporate net financial debt(2) 930 438
Net debt/equity ratio(1) 45% 16%
Net debt/EBITDA ratio(1) 2.0x 0.9x
Corporate net debt/EBITDA ratio(2) 1.5x 0.9x
(1) Excluding IFRS 16.
(2) Excluding non-recourse debt at the Photosol SPV level.

In total, Rubis generated cash flow of €432 million (-7%) and cash flows from operating activities of €421 million, compared to €295 million in 2021. Investments of €259 million include Rubis Énergie’s share, i.e., €215 million, of which 80% in maintenance and 20% in growth and energy transition investments, and €44 million for Photosol’s photovoltaic facilities. The price paid for 80% of the Photosol shares, plus the Mobexi shares (photovoltaic rooftops) reached €349 million. Cash flow effects, in particular the takeover of debt, recorded under change in scope, amounted to €398 million.

ANALYSIS OF CHANGES IN THE NET FINANCIAL POSITION SINCE THE BEGINNING OF THE FINANCIAL YEAR

(in millions of euros)  
Financial position (excluding lease liabilities) as of 1 January 2022 (438)
Cash flow 432
Change in working capital requirement (including taxes paid) (52)
Group investments (259)
Net acquisitions of financial assets (349)
Other flows of which lease liabilities (20)
Photosol current account taken over by Rubis Photosol (42)
Dividends paid to shareholders and non-controlling interests (202)
Dividends received and other investment flows (Rubis Terminal) 39
Increase in equity 3
Impact of change in scope of consolidation and exchange rates (398)
Financial position (excluding lease liabilities) as of 31 December 2022 (1,286)

Activities

Rubis Énergie

Rubis Énergie includes, on the one hand, the Retail & Marketing activity distributing fuels, including the service station networks, liquefied gas, bitumen, commercial heating oil, aviation and marine fuel and lubricants, carried out in the three regions (Europe, Caribbean, Africa), and on the other hand, the Support & Services activity, bringing together activities upstream of Retail & Marketing: refining, supply, trading, shipping and logistics.

RUBIS ÉNERGIE RESULTS

(in millions of euros) 2022 2021 Change
Volumes distributed (in thousands of m3) 5,487 5,401 +2%
Revenue 7,102 4,589 +55%
EBITDA 680 551 +23%
EBIT 540 412 +31%
Cash flow 440 475 -7%
Investments 215 206  

Retail & Marketing

PETROLEUM PRODUCTS PRICES

The financial year 2022 took place in a context of the doubling of petroleum product prices compared to 2021, with high volatility during the period. This configuration did not prevent adjusted unit distribution margins* from increasing by 19%.

Generally speaking, and with the exception of financial year 2022 as explained earlier, Rubis operates in markets that allow it to transfer price volatility to the end customer (price formula systems or no constraints at all on prices) and, as such, to keep its margins relatively stable over the long term.


* Margin adjusted for foreign exchange losses in Nigeria.

SUMMARY OF SALES VOLUMES IN THE FINANCIAL YEAR 2022

Through its 31 profit centres, the division sold 5.5 million m3 during the period in retail distribution (+2%), returning to its pre-pandemic level.

CHANGE IN VOLUMES BY REGION 2019-2022

(in thousands of m3) 2022 2021 2020 2019 2022 vs 2021
Europe 856 872 816 900 -2%
Caribbean 2,172 2,070 1,963 2,298 +5%
Africa 2,458 2,459 2,269 2,296 0%
TOTAL 5,487 5,401 5,049 5,494 +2%

In 2022, these volumes were spread across the three regions – Europe (16%), the Caribbean (40%) and Africa (44%) –offering the Group valuable diversity in terms of climate, economy (emerging countries and developed economies) and by type of end use (residential, transport, industry, utilities, aviation, marine, lubricants).

Volumes by product category break down as follows: 38% for service station networks, 32% for all other fuels (aviation, commercial heating oil, non-road diesel, lubricants, naphtha), 22% for LPG and 8% for bitumen.

SALES PROFIT

The gross sales profit reached €801 million, up 25%, reduced to 21% adjusted for the pass-through of the exchange rate depreciation on the sale price to customers in Nigeria (with exchange losses in “Other finance income and expenses”).

RETAIL & MARKETING GROSS PROFIT

  Gross profit
(in millions of euros)
Breakdown 2022 vs 2021 Gross profit
(in euros/m3)
2022 vs 2021
Europe 197 26% +1% 230 +3%
Caribbean 280 37% +35% 129 +29%
Africa* 290 38% +26% 118 +26%
TOTAL 767 100% +21% 140 +19%
* Adjusted for the impact of foreign exchange in Nigeria.

RESULTS OF THE RETAIL & MARKETING ACTIVITY

The EBITDA and EBIT operating aggregates recorded an increase of 30% and 37% respectively in 2022.

RESULTS OF THE RETAIL & MARKETING ACTIVITY

(in millions of euros) 2022 2021 Change
Volumes distributed (in thousands of m3) 5,487 5,401 +2%
Revenue 6,061 3,993 +52%
EBITDA 503 387 +30%
EBIT 396 289 +37%
Cash flow 268 320 -16%
Investments 141 159  

Europe, positioned mainly in LPG distribution, was affected by unfavourable weather conditions (volumes: -2%) and an increase in operating and transport costs, contributing to the 18% decline in EBIT.

The Caribbean region (excluding Haiti) recorded a significant improvement in volumes in 2022 (+13%), driven by the strong rebound in the tourism/aviation sector and margins. Haiti experienced another difficult financial year, generating foreign exchange losses and leading to a €40 million goodwill impairment in the Group’s financial statements. Overall, the region posted a 62% increase in EBIT.

Finally, Africa recorded a good performance in terms of volumes (+3% excluding aviation), with EBIT of €205 million (+51% vs 2021). Adjusting for the pass-through in Nigeria of the exchange rate depreciation on the selling price to the customer, EBIT increased by 26% vs 2021. East Africa continues its efforts to optimise and invest in the service station network, resulting in a 28% increase in service station volumes.

Capital expenditure totalled €141 million over the financial year, spread across the 27 operating subsidiaries. It covered recurring investments in service stations, terminals, tanks, cylinders and customer facilities, aimed principally at bolstering market share growth, as well as investments in facility maintenance.

Retail & Marketing Europe

Spain – France – Channel Islands – Portugal – Switzerland

RESULTS OF THE EUROPE SUB-GROUP

(in millions of euros) 2022 2021 2020 2019 2022 vs 2021
Volumes distributed (in thousands of m3) 856 872 816 900 -2%
Revenue 833 682 551 659 +22%
EBITDA 96 105 96 97 -9%
EBIT 58 71 61 62 -18%
Investments 34 30 39 28  

The Europe region has the Group’s strongest liquefied gas positioning (74% of volumes), with two-thirds of its customer base estimated to be residential.

Volumes were down by 2% over the financial year as a whole, affected by a historically warm winter (climate index down 22% in France compared to 2021), as well as by a high basis for comparison with the previous year. Unit margins remained firm, with the exception of Corsica.

Retail & Marketing Caribbean

French Antilles and French Guiana – Bermuda – Eastern Caribbean – Jamaica – Haiti – Western Caribbean - Guyana – Suriname

RESULTS OF THE CARIBBEAN SUB-GROUP

(in millions of euros) 2022 2021 2020 2019 2022 vs 2021
Volumes distributed (in thousands of m3) 2,173 2,070 1,963 2,298 +5%
Revenue 2,577 1,649 1,333 1,851 +56%
EBITDA 168 114 115 167 +47%
EBIT 134 82 80 139 +62%
Investments 51 49 34 46  

A total of 19 facilities distribute fuel locally (406 service stations, aviation, marine, commercial, LPG and lubricants).

Activity in the region benefitted from the end of health restrictions and the strong recovery in tourism thanks to the dynamism of the US economy. As a result, volumes (excluding Haiti) increased by 13%. The sharp increase in the EBITDA and EBIT aggregates enabled it to return to the level of 2019, despite the sharp deterioration in the economic, political and security situation in Haiti.

Haiti had another difficult year, with a deterioration in public order and the political and economic situations. This context, together with an increase in the discount rate applied, led to a €40 million goodwill impairment during financial year 2022.

Retail & Marketing Africa

Bitumen: Senegal – Togo and sub-region - Nigeria – Cameroon – Gabon – Liberia – South Africa

White products/LPG: South Africa – Botswana – Zimbabwe - Djibouti – Ethiopia – Kenya – Réunion Island – Madagascar – Uganda – Rwanda – Zambia – Morocco

RESULTS OF THE AFRICA SUB-GROUP

(in millions of euros) 2022 2021 2020 2019 2022 vs 2021
Volumes distributed (in thousands of m3) 2,458 2,459 2,269 2,296 0%
Revenue 2,651 1,662 1,450 1,874 +60%
EBITDA 240 167 159 148 +44%
EBIT 205 136 128 123 +51%
Investments 56 80 62 36  

The stability of volumes conceals good growth in service station networks (+17%), a net decline (-33%) in aviation volumes in Kenya, the result of a management decision to optimise margins, and a decline in bitumen (-9%) due in particular to an extended rainy season in Nigeria compared to a high base in 2021.

Gross profit after adjustment for foreign exchange loss in Nigeria in 2022 remained firm at +26%.

In the bitumen sector, general actions to expand the offering to different countries are continuing successfully. Rubis Énergie has significantly increased its container delivery capacity for bitumen, thus enabling it to establish itself competitively in new countries: South Africa, Gabon, Liberia, and Angola in early 2023. The subsidiary is strengthening its logistics resources to support this development, including a new vessel and an import terminal in South Africa that will deliver bulk cargoes.

In East Africa, results continued to grow, with EBIT at +89%; the service station renovation programme including rebranding and associated store openings is accelerating (75% completed out of a total of 400 stations), with concrete results in terms of footfall at points of sale and average unit flows. In Kenya, network sales were up by 39% in 2022 and by 28% in East Africa as a whole, with a doubling of gross profit.

Support & Services

Madagascar – Martinique (SARA) – Barbados and Dubai (trading) – Shipping

RESULTS OF THE SUPPORT & SERVICES DIVISION

(in millions of euros) 2022 2021 2020 2019 2022 vs 2021
Revenue 1,041 596 568 845 +75%
EBITDA 177 165 158 131 +8%
EBIT, of which 144 123 120 108 +17%
•  SARA 25 26 44 39 -2%
•  other 119 97 76 68 +22%
Cash flow 172 155 140 119 +12%
Investments 74 46 84 57  

This sub-group includes supply tools for petroleum products and bitumen in the Retail & Marketing activity:

•   the 71% interest in the refinery in the French Antilles (SARA);

•   the trading-supply activity, active in white products in the Caribbean (Barbados) and mostly in bitumen in the Africa/Middle East region with an operational head office in Dubai;

•   in support-logistics, shipping (16 vessels) and the “storage and pipe” activity in Madagascar.

The results of the SARA refinery experienced high volatility between 2019 and 2022, more for accounting reasons (recognition of end-of-career indemnities and provisions and subsequent reversals related to the Major Shutdown) than economic; results remain regulated by a formula guaranteeing a return of 9% on equity. As a result, cash flow from operations of €44 million in 2022 is in line with the last-four financial years average.

The contribution of the Support & Services activity (excluding SARA) was €119 million (+22%) and breaks down as follows:

•   the volumes handled in trading-supply show an increase in unit margins, while shipping benefitted from the combined effect of better freight rates, investments in new vessels and the development of bitumen sales in Africa;

•   port services and pipe activities in Madagascar maintained their historical pace.


Renewable Electricity Production

The Group made a strategic shift in 2021-2022, aimed at supplementing its historical business lines with a renewable energy division, named Rubis Renouvelables. Two significant transactions were carried out:

•   the acquisition in 2021 of an 18.5% stake in the share capital of HDF Energy, together with a strategic agreement for priority and majority investment in hydrogen-electricity power plant projects;

•   the acquisition of 80% of Photosol, one of the leading independent producers of photovoltaic energy in France. This investment will enable the Group to reach a target of 25% of its EBITDA in renewable energies in the medium term, with a minimum of 2.5 GWp of photovoltaic capacity installed in France by 2030.

The final acquisition of Photosol in April 2022 triggered the creation of the Rubis Renouvelables division, which holds 80% of the Photosol shares and the stake in HDF Energy.

The acquisition of Photosol resulted in the payment of the portion (80%) of the shares for €341 million as well as the assumption of net debt for €417 million (of which €357 million in non-recourse debt as of 31 December 2022). Goodwill amounted to €541 million.

The financial statements of Photosol have been included in the Group’s consolidation scope since 1 April 2022.

RESULTS OF THE RENEWABLE ELECTRICITY PRODUCTION DIVISION AS OF 31 DECEMBER 2022 (OVER NINE MONTHS)

(in millions of euros) 2022
Installed capacity (in MWp) 384
Electricity production (in GWh)* 403
Revenue 33
EBITDA 18
Investments 44
Net financial debt 417
 of which SPV financial debt 357
* Electricity production over 12 months 2022.

As of 31 December 2022, Photosol’s portfolio includes:

•   503 MWp of secured capacity (compared to 462 MWp in 2021), including capacities in operation (384 MWp), under construction or awarded (119 MWp);

•   a project portfolio exceeding 3.5 GWp, including 1.4 GWp (compared to 0.8 GWp) in advanced development and 2.1 GWp (compared to 2.4 GWp) in early stage.

The financial year 2022 was marked by sharp inflation in the cost of new equipment and by administrative congestion in the granting of building permits and network connections. An agreement was reached between the profession and the CRE(1) to release resources to offset the additional costs on the equipment in the form of an authorisation to sell the electricity production of ongoing projects as soon as they are finalised and for a period of 18 months at market price (higher than the contractual repurchase price). As for the congestion in the processing of building permits, this will result in a delay of 12 to 18 months in the completion of the project portfolio, with a target of 1 GWp of installed capacity in 2026 (2025 previously) for a cumulative investment of €700 million over the period 2022-2026 (compared to 2022-2025 previously) and a target EBITDA of €65 to 70 million in 2027.

Among the main achievements of the financial year:

•   entry into the roofing segment, at a time when the latter is encouraged by the renewable energy acceleration law passed in February 2023 (definition of agrivoltaics, acceleration zones and administrative simplifications);

•   the signing of a first corporate PPA with Leroy Merlin and actions in the development of this segment of the market expected to grow strongly;

•   development outside France (Spain, Italy, Poland, Germany), with a first agreement in the form of a commercial partnership in Spain.

In this context, financial year 2022 accelerated the strengthening of the development teams.

(1) The French Energy Regulatory Commission (CRE) is an independent body that regulates the French electricity and gas markets.
Contribution of the Rubis Terminal JV

Financial year 2022 was rich in achievements for Rubis Terminal:

•   final exit from Turkey;

•   refinancing of the debt structure (€812 million) in the form of a bank-type infra loan at an average rate of 4.2% compared to 5.625%, an extension of the term to seven years compared to five years and an increase in leverage to 6x, with a dividend pay-out;

•   commercial actions towards the energy transition with the conversion of heavy fuel oil tanks to biofuel in Rotterdam and the start-up of ethanol capacities in Rouen

•   in total, storage revenues were up 6%, for a capacity utilisation rate of 91.6% (93.9% in 2021), all countries and segments having contributed to this performance, in particular chemicals (+9%), biofuels (+26%) and fertilisers/vegetable oils (+30%);

•   record EBITDA of €124 million, up 2%;

•   finalisation of work and marketing of new chemical capacities in the ARA zone, fully leased;

•   new extension projects, particularly in Spain (Huelva and Tarragona).

COMMERCIAL AND FINANCIAL RESULTS OF THE RUBIS TERMINAL JV

(in millions of euros) 2022 2021 Change
Storage services (incl. 50% of the Antwerp JV), of which 235 222 +6%
Petroleum products 122 122 0%
•  of which biofuels 28 22 +26%
Chemical products 96 88 +9%
Agrifood products 17 13 +30%
Breakdown by country      
France 120 115 +5%
Spain 65 59 +11%
ARA 50 50 0%
EBITDA (incl. 50% of the Antwerp JV) 124 122 +2%

Storage revenues increased by 6% while operating costs increased by 10%, due to the effects of inflation in the cost of utilities and the increase in personnel costs (indexation plus the use of temporary staff), so that adjusted EBITDA (including 50% of Antwerp) ultimately recorded an increase of 2%.

Investments during the financial year represented €77 million (including 50% of Antwerp) compared to €58 million, and can be broken down as follows:

•   maintenance €27 million (stable);

•   development €50 million (compared to €31 million).

CONTRIBUTION OF THE RUBIS TERMINAL JV (55%)

(in millions of euros) 2022 2021
Share of income of the Rubis Terminal JV attributable to Rubis 4.7 4.7
Dividend paid to Rubis 33.0 18.9
Value of the equity interest in Rubis SCA 287.7 304.6

On a base of 100%, the joint venture’s total net debt reached €690 million at the end of 2022. Free cash flow after tax, financial expenses and maintenance investments amounted to €47 million on an annual basis, which, compared to total equity of €547 million, gives a cash return of 9%.

2.2 Events after the reporting period

None.

3. RISK FACTORS, INTERNAL CONTROL and INSURANCE


The Group’s activities are organised around two divisions (see chapter 1):

•   Energy Distribution (Rubis Énergie – Retail & Marketing and Support & Services activities);

•   Renewable Electricity Production (Rubis Renouvelables).

Rubis SCA also owns 55% of the equity interest in the Rubis Terminal joint venture, which it controls jointly with its partner and which it accounts for using the equity method.

The diversity in the Group’s activities and the nature of the products it handles exposes it to risks that are regularly identified, updated and monitored as part of a rigorous management process aimed at mitigating these risks to the fullest extent possible, in accordance with applicable regulations, international standards and professional best practices.

Rubis has identified 15 risk factors related to its activities, considered significant and specific, divided into four categories (section 3.1).

For many years the Group has also implemented internal control procedures (section 3.2) that contribute to controlling its activities and to the effectiveness of its risk management policy.

Finally, regarding residual risks that cannot be completely eliminated, the Group ensures that they are covered by appropriate insurance policies whenever possible (section 3.3).

3.1 Risk factors

3.1.1 Introduction

Using mapping techniques, Rubis annually reviews financial, legal, commercial, technological and maritime risks liable to have a material adverse effect on its business and financial position, including its results, reputation and outlook. In addition to this risk mapping, a comprehensive review of risks by all the relevant departments is organised in order to select the risks that should be included in this chapter. The selected risks are then presented to the Accounts and Risk Monitoring Committee, a specialised Committee of Rubis SCA’s Supervisory Board.

Only those risks deemed specific to the Group and important for investors to know of as of the date of this document are described in this chapter. Investors should take all the information contained in this document into consideration.

Risk factors are divided into four categories based on their nature:

•   industrial and environmental risks;

•   risks related to the external environment;

•   legal and regulatory risks;

•   financial risks.

These categories are not presented in order of importance. Within each category, the risk factor with the greatest impact as of the date of the risk assessment is presented first. Note that the NFIS (Non-Financial Information Statement) contains a description of non-financial risks. Depending on their importance, some of those risks are also included in the risk factors described in this chapter. To avoid unnecessary repetition for the reader and to present each risk factor concisely, this chapter contains references to chapter 4 “CSR and Non-Financial Performance”, which includes a detailed presentation of the Group’s management of its environmental, social and societal risks.

The description of Rubis’ main risk factors (see below) presents the possible consequences in the event the risk does materialise and provides examples of measures implemented to reduce such consequences. The level of risk assessment presented is relative, i.e., it makes it possible to measure the importance (impact/probability) of the risks presented in this document in relation to each other and not in relation to similar risks presented by other issuers. Thus, the highest level of risks presented in this document does not necessarily correspond to the highest level of risks of other operators.

Probability:   Low    Medium    High                           Impact:  Low    Medium     High 
Category Risk Probability Impact
Industrial and environmental risks Risk of a major accident in industrial facilities
Risk of a major accident in distribution facilities
Risks related to product transport    
 Shipping
 Road transport
Risks related to information systems
Risks related to the development of photovoltaic power plant projects
Risks related to the external environment Country and geopolitical environment risks
Climate risks
Risks related to changes in the competitive environment
Legal and regulatory risks Risks related to a significant change in regulations
Legal risks
Ethics and non-compliance risks
Financial risks Foreign exchange risk
Risk of fluctuations in product prices
Risks related to acquisitions
Risks related to management of the equity interest in the Rubis Terminal JV

3.1.2 Detailed presentation of risk factors

3.1.2.1     Industrial and environmental risks

Rubis Énergie’s activities (Retail & Marketing and Support & Services), which are described in greater detail in chapter 1, entail industrial and environmental risks that may have impacts of varying nature and scope depending on the activities and the type of products handled (fuels, heating fuels, bitumen, liquefied gas). In most countries, these activities are subject to multiple stringent environmental, health and safety regulations requiring the implementation of risk prevention systems (the European Seveso regulations for industrial facilities or the ADR for the carriage of hazardous materials by road, for instance).

RISK OF A MAJOR ACCIDENT IN INDUSTRIAL FACILITIES(1)

Probability:     Impact:

Description of risks

Rubis Énergie operates industrial sites where petroleum products (fuels, heating fuels, bitumen, liquefied gas) are the main items handled. Such products are inherently flammable and, in some cases, explosive.

The facilities in question are import or storage terminals for petroleum products, gas cylinder filling plants and a refinery. Sixteen sites (six of which not wholly-owned by a Group entity) are classified as Seveso sites (high and low threshold) in the European Union, while 49 similar sites are operated outside the European Union (four of which not wholly-owned by a Group entity).

Although the entities ensure that these facilities and their operation comply strictly with the standards predefined by the Group and the regulations applicable to them, a major accident (fire, pollution) is a risk inherent in these activities and is generally the reason behind the applicable regulations and strict internal procedures that must be followed. As no single site makes a significant contribution to Group earnings, only the simultaneous shutdown of several sites could result in an adverse impact on the Group’s financial position.

Examples of risk management measures

Due to the nature of Rubis Énergie’s activities, the safety of operations is a constant concern for the Company’s teams. In addition to strict compliance with the applicable Seveso-type regulations, significant resources are devoted to preventing the risk of accidents, and especially major industrial incidents, including:

•   an active risk prevention approach through the implementation of proven HSE (health, safety and environment) and quality management systems, guaranteeing the implementation of rigorous operational processes;

•   investments totalling €109 million in 2022 for security/ defence against fire/maintenance/adaptation of facilities;

•   membership of professional bodies such as GESIP (Groupe d’étude de sécurité des industries pétrolières –Group for Safety Research in the Petroleum Industries), Ufip Énergies et Mobilités and the Joint Inspection Group (JIG), which provide general operational, training and safety support;

•   the establishment of crisis management units that can be swiftly activated in response to a major event in order to limit its consequences.

(1) This risk is described in the NFIS, chapter 4, section 4.2.

RISK OF A MAJOR ACCIDENT IN DISTRIBUTION FACILITIES(1)

Probability:     Impact:

Description of risks

Rubis Énergie operates a network of 1,054 service stations in 23 countries, most often by entrusting station management to managers or independent resellers.

Although the quantities of products stored in service stations are limited (frequently less than 80 m3), the main risk stems from the fact that such facilities are often located in urban or suburban areas and that they are accessible to the public.

A fire or product leak, including those caused by malicious acts, could result in harm to personnel (who most often are not Group employees), customers, local residents, the environment and/or property, and to the Group’s reputation.

Examples of risk management measures

In addition to strict compliance with the applicable regulations, measures put in place to prevent risks, and especially major incidents, include:

•   the establishment of a service station operations document base that is focused on risk prevention/ protection, which notably sets out detailed safety instructions and guidelines for operations, the regular training of managers and staff, and rigorous monitoring of fuel stocks;

•   the implementation of technical compliance programmes for fuel distribution facilities, which notably includes the gradual replacement of underground tanks and pipelines by equipment using double wall technology fitted with leak detectors, ensuring continuous leakage monitoring to guard against any possible pollution;

•   the rollout of preventive maintenance programmes in service stations based on regularly updated descriptive specifications and regular inspections to ensure that maintenance work is carried out properly.

(1) This risk is described in the NFIS, chapter 4, section 4.2.

RISKS RELATED TO PRODUCT TRANSPORT(1)

Shipping   >  Probability:    Impact:

Road transport   >  Probability:     Impact:

Description of risks

The products distributed by Rubis Énergie are considered dangerous insofar as they are flammable or, in some cases, explosive, and may also be subject to accidental spillage liable to pollute the ground and water. The transport of these products therefore involves a risk attributable to both the nature of the product and the means of transport used, mainly maritime or road transport.

Shipping

In its supply and shipping activities, Rubis Énergie operates 16 vessels, of which 10 are fully owned (including two new vessels since early 2023), and the others leased under time-charters. Rubis Énergie also charters vessels for single voyages.

A major incident involving a vessel (fire, explosion, pollution, navigation accident), including those resulting from acts of piracy, whose probability of occurrence is low but whose impact could potentially be significant, could cause damage to people, the environment and/or property, as well as to the Group’s reputation. The Group, its Senior Managers or its employees could be held liable.

Road transport

The transport of products to distribution sites and customers requires numerous trucks to circulate, which is liable to generate risks to people and the environment. The risk of accidents is heightened in certain areas (Africa, certain Caribbean Islands) due to the poor quality of road infrastructures, distances travelled and/or population density on roads. The consequences of a road accident involving hazardous materials are generally limited in terms of space, due to the small quantities transported, but could generate harm to people, the environment, and/or to property and to the Group’s reputation in the event of a serious traffic accident.

Examples of risk management measures

Shipping

In addition to compliance with the regulations applicable to international navigation (mainly the International Maritime Organisation standards), the following measures have been put in place:

•   the systematic vetting of vessels chartered by Group subsidiaries or third-party shipowners, carried out by a specialised company, Rightship;

•   membership of Oil Spill Response Ltd, a company that can provide assistance in the event of maritime pollution occurring during the loading/unloading of products at Rubis Énergie terminals;

•   as charterer or shipowner, Rubis Énergie insures its shipping risk with major international P&I Clubs (see section 3.3.2.3).

Road transport

In addition to applying the regulations governing the transport of hazardous goods, additional measures are taken to prevent the risk of traffic accidents:

•   Defensive driving training programmes, especially in countries where the risk is greatest; special instructions are also applied (ban on driving at night, for instance);

•   truck fleet renewal programmes and the installation of surveillance equipment for vehicles on the move, such as video surveillance and/or tracking via geolocation.

•   truck fleet renewal programmes and the installation of surveillance equipment for vehicles on the move, such as video surveillance and/or tracking via geolocation.

(1) This risk is described in the NFIS, chapter 4, section 4.2.

RISKS RELATED TO INFORMATION SYSTEMS

Probability:     Impact:

Description of risks

As with most companies, the Group is exposed to risks relating to the use of information systems. The day-to-day management of the Group’s activities, and in particular the conduct of its industrial, logistical, commercial and accounting processes, relies on the smooth functioning of all of its technical infrastructures and IT applications. The risk of a malfunction or interruption of critical systems arising from a technical fault (power or network outages, service provider default, etc.) or a malicious act (viruses, computer system intrusion, etc.) cannot be ruled out. The occurrence of such an incident would be liable to impact the work of the Group’s teams, irrespective of the activity at issue (administrative, commercial or industrial) by slowing down their work, and could lead to the loss of personal or sensitive data. The rapid growth of working from home and the development of digital processes in all business lines, including recourse to cloud computing, could further increase this risk. However, the fact that the information systems of the Group’s various entities are compartmentalised makes it unlikely that a major attack could spread across the Group. In the event of a risk related to information systems, only the entity concerned, or even the department concerned, would be affected locally.

Examples of risk management measures

The Group continuously adapts its prevention and detection measures and the measures it applies to protect its information systems and critical data, notably by:

•   conducting audits of computing infrastructure and test campaigns;

•   action plans and investment programmes aimed at continuously enhancing the security and monitoring of information systems and data in order to adapt to constant change;

•   implementation of business continuity plans (BCP)/ disaster recovery plans (DRP);

•   information and training campaigns aimed at raising users’ awareness about cyber risks.

RISKS RELATED TO THE DEVELOPMENT OF PHOTOVOLTAIC POWER PLANT PROJECTS

Probability:     Impact:

Description of risks

The Rubis Renouvelables division (via its subsidiary Rubis Photosol) builds and operates photovoltaic power plants in France. As of 31 December 2022, Rubis Photosol operated 384 MWp of installed capacity and had a development portfolio of 3.5 GWp, including 1.4 GWp in the advanced development phase. The success of the development phase of these projects and the start-up of operations within the expected deadlines depends on the satisfaction of a certain number of conditions and involves uncertainties, the main ones being:

the results of environmental studies: these studies generate a significant cost per project and may lead to the abandonment of a project, particularly due to the discovery of excessive fauna/flora challenges. In such a case, the sums committed cannot be recovered;

administrative authorisations and building permits: Rubis Photosol cannot guarantee that these will be obtained for sites under development. They may also be subject to longer appraisal periods, making project completion schedules more uncertain;

the construction of the facility: the failure of a key service provider to fulfil a construction contract is likely to result in a more or less significant delay in the construction period as well as in the cost of the project if a change of service provider becomes necessary. A delay in start-up of operations for the photovoltaic installation would impact the electricity sale contract for the duration of said contract. In addition, the price of certain equipment essential to the installation may rise due to the increase in the price of raw materials and delivery time delays may result in higher costs.

Examples of risk management measures

•   In-depth internal prior analyses to assess the probability of project completion and avoid the launch of studies on projects whose completion conditions are subject to significant uncertainties.

•   Analysis of the development of case law relating to building permits and distribution of a weekly watch.

•   Selection of service providers on the basis of demanding criteria and inclusion of late delivery penalties and substantial financial guarantees in contracts.

3.1.2.2     Risks related to the external environment

Rubis Énergie, and consequently Rubis SCA, is sensitive to cyclical and structural risk factors resulting from its business segment and the countries in which it operates.

COUNTRY AND GEOPOLITICAL ENVIRONMENT RISKS

Probability:     Impact:

Description of risks

The Group (excluding the Rubis Terminal JV) operates in 39 countries as of 31 December 2022. In 2022, it generated 11% of its EBIT in Europe, 49% in the Caribbean and 41% in Africa (including the subsidiaries located in the French overseas departments and territories in the Europe region, the breakdown is as follows: 23% Europe, 40% Caribbean and 37% Africa). Some of Rubis Énergie’s activities are exposed to risks and contingencies in countries with fragile governance or that may be experiencing, or may have experienced, political, economic, social and/or health situations that can be described as unstable (notably Haiti, Nigeria, Madagascar or Suriname). A rise in market prices of fuels can increase this instability due to the growing weight of the cost of energy in the budgets of individuals and businesses.

In addition to the usual consequences, this instability can in particular have an impact on Rubis Énergie’s subsidiaries resulting from a unilateral review of fuel distribution margins or from price structures not being applied by states that regulate the prices of petroleum products in order to reduce pressure linked to the cost of energy. The point of equilibrium remains, however, the grant of sufficient margins to operators to ensure a long-term supply of essential products and to maintain adequate safety standards.

Another aspect of geopolitical risk concerns the safety of Group employees, for which strict protection measures are in place in high-risk countries. Personal safety is a priority management issue in these countries, as is the security of petroleum product storage facilities.

Except in extreme cases, continuity of the fuel distribution activities of subsidiaries is in principle secured, as these products meet the essential needs of populations. The simultaneous occurrence of such events in several countries could have an unfavourable impact on the Group’s earnings.

Lastly, the shipping activity may be exposed to acts of piracy in certain areas in which the Group operates (in the Gulf of Guinea and the Indian Ocean, in particular). Such acts could cause harm to individuals on board, damage the vessel itself and its cargo, and cause financial losses due to delays in scheduled deliveries, or even the inability to deliver cargoes.

Russian-Ukrainian conflict: Rubis does not have operations in Russia or Ukraine and does not source from suppliers in these countries. This conflict has notably contributed to the increase in the price of petroleum products on international markets. At the date of publication of this document, the evolution of the conflict continues to be uncertain. The Group remains attentive to the situation and its potential impact on its activities and results, as well as to the indirect impacts of the conflict on the global supply chain.

Examples of risk management measures

•   The geographic diversity of the Group’s operations mitigates its exposure to the risks of a given country by limiting concentration of activities, and as such, dependence on that particular country. Moreover, existing risks are assessed at the time acquisitions are made and are taken into account in the operational management of the subsidiaries, which perform regular monitoring in order to anticipate those risks.

•   In areas that are particularly exposed to security risks, employee and site protection measures are reinforced according to the assessment of the surrounding risks, so as to deal with malicious acts, intrusions, kidnappings, vandalism or theft.

•   To deal with health risks, business continuity plans are established and measures are taken (vaccination, information campaigns, etc.) to combat infectious or viral diseases (the plague, malaria, Ebola, Covid, etc.).

•   Regarding the risk of piracy, the Group’s vessels and port facilities comply with the International Ship and Port Facility Security (ISPS) Code. Recommendations relating to countries designated “high risk areas” by the International Maritime Organisation (OMI) are also taken into account.

CLIMATE RISKS(1)

Probability:     Impact:

Description of risks

Physical risk

In 2022, the Group generated 49% of its EBIT in the Caribbean zone, which is particularly exposed to natural and climate risks, the intensity of which is tending to increase (earthquakes, hurricanes, etc.). The occurrence of extreme events could affect the integrity of its sites, especially the import terminals necessary for the supply of petroleum products, generally located in coastal areas. This could disrupt the operations of the subsidiaries in question and in turn cause operating losses. Nevertheless, the most recent cyclones in the Caribbean had a moderate effect on the Group’s earnings.

To a lesser extent, Rubis Énergie’s Retail & Marketing distribution activity is exposed to changes in temperature, mainly during mild winters in Europe (11% of Group consolidated EBIT), which affects fuel sale volumes in the heating market.

Transition risk

Rubis is exposed to its sector’s energy transition challenges. Although it has initiated the diversification of its activities towards renewable energies, most of the energy sold by the Group today is of fossil origin. Changes – sometimes rapid – in the regulatory environment and in policies in support of a low-carbon economy (carbon tax, energy saving certificates, obligation to incorporate bio fuels) could impose a significant reduction in CO2 emissions and make other less carbon-intense energies more competitive in the long term. In addition, growing concern among stakeholders (customers, investors, insurers, employees, civil society, etc.) about climate change is liable to have an adverse effect on the Group’s petroleum product Retail & Marketing activity, its financial position, its image, appeal and its outlook, with varying levels of uncertainty that are sometimes hard to measure over the long term. The immediate impact is considered to be low to moderate, depending on the products and areas in question.

Examples of risk management measures

•   In 2022, the Group created a new division, Rubis Renouvelables, dedicated to the production of renewable electricity, a new pillar of Rubis’ strategy. This division mainly consists of Rubis Photosol, which builds and operates photovoltaic power plants in France (384 MWp of installed capacity and a development portfolio of 3.5 GWp, including 1.4 GWp in the advanced development phase).

•   The Group is committed to monitoring the vulnerability of its existing and future facilities and of its activities, by taking climate change projections into account and by taking all appropriate safety measures, including the factoring of natural hazards into the design and operation of exposed facilities. This includes in particular:

•   geographic diversification (presence on three continents) and the broadening of the Group’s scope, greatly limiting exposure to the climate hazards that may be experienced in any given area;

•   diversification of business lines and products sold by Rubis Énergie, both by product category and by user (automotive fuel, aviation fuel, diesel, heating fuel, liquefied gas, bitumen and lubricants) limiting the impact of a climate event.

•   The decarbonisation strategy (detailed in chapter 4, section 4.3 of this document) including, in particular, a CO2 emissions reduction target of 30% (scopes 1 et 2, baseline 2019, Rubis Énergie scope) by 2030, defined in 2021, and an additional target of a 20% reduction in scope 3A CO2 emissions by 2030 (Rubis Énergie scope, mainly outsourced shipping and road transport items, i.e., 45% of scope 3A), defined in 2022, as announced in the Group’s CSR Roadmap, Think Tomorrow 2022-2025. Rubis has notably implemented measures to increase the energy efficiency of its most energy-intense industrial facilities, such as the refinery in Martinique or the vessels, so as to reduce their carbon footprint.

•   The establishment of a governance structure and teams responsible for monitoring climate challenges (regulatory, technical, societal changes) and identifying development opportunities to support the governing bodies in their discussions. The Climate & New Energies team, created in 2020, assists the Climate Committee and coordinates the operational efforts made by all Rubis Énergie subsidiaries

(1) This risk is described in the NFIS, chapter 4, section 4.2.

RISKS RELATED TO CHANGES IN THE COMPETITIVE ENVIRONMENT

Probability:     Impact:

Description of risks

The Retail & Marketing distribution activity operates in an intense competitive environment. Competitors’ profiles are changing, with the entry into the distribution business of trading players who have a competitive advantage over a larger part of the value chain in markets that are highly dependent on the import of petroleum products, or of local players supported by governments. In addition, the use of fossil fuels is gradually facing competition from other energies, although this phenomenon is to date still confined to a few regions in which the Group operates, mainly in Western Europe.

Failure to take these various changes into account in the Group’s strategy could limit its development prospects.

Examples of risk management measures

•   Rubis Énergie favours markets in which the Group enjoys a leading position, controls its supplies and/or has strategically located logistics facilities (maritime import terminals, refinery, pipeline connection). External growth around its areas of activity helps increase intra-group synergies and boost competitiveness.

•   The regular extension of Rubis Énergie’s portfolio of suppliers (stockists, refiners, traders) contributes to the competitiveness of supplies.

•   In Europe, Rubis Énergie’s activity is mainly focused on the distribution of liquefied gas, which is considered to be a transitional energy

•   Compliance with high safety, product quality and ethics standards is a differentiating competitive advantage, especially in markets where local players are unable to meet the requirements of international customers.

3.1.2.3     Legal and regulatory risks

RISKS RELATED TO A SIGNIFICANT CHANGE IN REGULATIONS

Probability:     Impact:

Description of risks

Environmental regulations

The growing trend towards stricter environmental and industrial safety regulations for both the Retail & Marketing and Support & Services activities could generate significant additional costs to bring facilities into compliance, which could have an impact on the business of Group entities and earnings. Both in France and abroad, sites and products are subject to increasingly stringent rules governing environmental protection (water, air, soil, noise, nature protection, waste management, impact studies, etc.), health (workstation, chemical product hazards, etc.) and the safety of employees and local residents. Rubis Photosol’s activities are also subject to numerous regulations in terms of urban planning, the environment and agriculture, for the agrivoltaic activity.

In addition, for most of the Group’s activities, when sites are closed, applicable regulations will require sites to be secured, dismantled and then rehabilitated from an environmental point of view after decommissioning. The associated costs could significantly exceed the provisions set aside by the Group and have a negative impact on its operating results. Future expenses for site restitution are accounted for by the Group in accordance with the accounting policies described in note 4.11 to the consolidated financial statements.

Renewable energy regulations

Rubis Photosol operates in France, in a highly regulated environment that protects operators. The proposed law “on the acceleration of renewable energy production” is likely to cause a delay in the schedule for start-up of operations since it is likely to slow down the deployment of projects through the inclusion of new regulatory constraints, or even call into question the feasibility of certain projects. In addition, changes in government guidelines could expose Rubis Photosol to the questioning of regulated electricity purchase prices and tariffs by the French authorities or any other authorised public entity. As the purpose of photovoltaic installations is to sell electricity, a questioning of the mechanisms of purchase obligations (either direct or via additional compensation) could have unfavourable consequences on the profitability of Rubis Photosol projects, depending on their level of maturity. A decrease in revenue would reduce the ability of the project companies (SPV) to repay their bank debt as well as the current account facilities granted to them by Rubis Photosol. However, changes in regulations relating to renewable energies are increasingly favourable to these renewable energy production activities.

Tax regulations

The signature of a tax agreement by the international community in autumn 2021 will lead to major reforms in international taxation. The OECD has published rules to ensure that multinational companies are subject to a 15% minimum tax rate starting in 2023. The European Commission has proposed a directive on defining a calculation basis that seeks to realign taxation rights with value creation and by setting a minimum tax rate. EU Member States will have to transpose the Pillar 2 directive by 31 December 2023, with application of the Income Inclusion Rule (IIR) from 2024 (financial years beginning on or after 31 December 2023) and the Undertaxed Profits Rule (UTPR) from 2025 (financial years beginning on or after 31 December 2024). In addition, due to budgetary constraints, which have been exacerbated by public debt resulting from the Covid-19 health crisis, certain states are introducing new tax measures and are providing their Audit Departments with enhanced powers.

Examples of risk management measures

•   The teams carry out constant regulatory monitoring. In addition, the situation of each site is regularly reviewed with regard to existing or future regulatory obligations.

•   The Group contributes to developing standards adapted to the challenges facing the industry, notably through sector-based professional bodies or unions.

•   Rubis’ assessment of the associated risks has led the Group to recognise provisions totalling €36 million for clean-up and renewal of non-current assets (see note 4.11 to the consolidated financial statements).

•   Rubis Photosol takes an active part in public debate, in particular via the Renewable Energies Syndicate (SER), in order to defend the interests of the sector. It conducts rigorous and continuous regulatory monitoring in order to comply with regulations or protect itself against any legal changes that may affect the construction or operation of its power plants.

•   Group companies ensure that tax filings and payments are made in accordance with local regulations. They complete the tax returns required in the jurisdictions in which the Group operates its businesses.

•   In accordance with its legal obligations, Rubis carried out its country-by-country reporting by reporting the breakdown of its profits, taxes and activities by tax jurisdiction and established the transfer pricing documentation applicable among Group companies (Transfer Pricing Documentation – Master File).

LEGAL RISKS

Probability:     Impact:

Description of risks

Rubis conducts its business in France and abroad in complex legal and regulatory environments that are constantly evolving.

Rubis Énergie’s activities are generally subject to strict and complex regulations in the fields of environmental protection and industrial safety. The receipt or renewal of operating licenses, port concessions or leases concerning the land on which facilities are located is subject to compliance with these regulations. The loss of an authorisation to operate a major site, such as the Martinique refinery, a key import site for the supply of a country or any other essential infrastructure, that contributes significantly to Group earnings could result in adverse consequences on the Group’s earnings or outlook.

The other major legal risks relate to litigation between the Group and its customers, suppliers and service providers, or local residents in the event of major pollution. Litigation may also occur following acquisitions of companies or in the context of joint ventures. In tax matters, the Group’s subsidiaries may be subject to tax and customs controls or to procedures conducted by the national authorities in which there is no guarantee that the tax authorities will agree with the positions taken by the Group, even if the Group considers them to be correct and reasonable in the context of its activities. Such disputes could relate to significant amounts that could affect the Group’s earnings, particularly as concerns transfer pricing policy.

On the date hereof, there are no governmental, legal or arbitration proceedings (including any proceedings of which Rubis is aware), either pending or threatened, that are liable to have or have had in the last 12 months a significant impact on the Group’s financial position or profitability.

Examples of risk management measures

•   These risks are primarily managed and monitored by Rubis Énergie’s Finance and Legal Departments, in collaboration with the subsidiaries and with the assistance of external specialised consultants and firms. Rubis SCA’s Corporate Secretary works closely with the subsidiaries’ Legal Departments regarding any significant issues or disputes that are liable to have a material impact on the Group.

•   In tax matters, Group companies ensure that tax returns and payments are submitted in accordance with local regulations. Moreover, the Group does not have any subsidiaries that are not underpinned by economic activities (essentially, local commercial operations).

•   The Group assesses the risks associated with pending litigation and sets aside provisions in accordance with applicable accounting policies to cover risks that it is able to assess reliably (see note 4.11 to the consolidated financial statements)

ETHICS AND NON-COMPLIANCE RISKS(1)

Probability:     Impact:

Description of risks

Given the geographic location of a large part of its activities, the Group pays particular attention to the risk of breaches of ethics and compliance rules. Rubis ensures that all its employees act in accordance with the values of integrity and compliance with applicable internal and external standards, and that the same standards are complied with in the entities in which it holds a significant interest (primarily the Rubis Terminal JV). In a context of increased judicialisation, with supervisory authorities having extensive powers, non-compliance with laws and regulations (such as anti-corruption laws, international economic sanctions, the GDPR, competition) or claims against the Company and/or its Senior Managers could expose the Group to consequences that are harmful to its financial equilibrium (administrative, civil, criminal penalties), reputation, attractiveness, values, sources of financing and, ultimately, its growth and results.

Examples of risk management measures

The Group closely monitors ethics and non-compliance risks by establishing measures designed to prevent such risks from materialising, in particular:

•   a specific system for preventing the risk of corruption and non-compliance with international economic sanctions, which includes in particular a documentary framework that formalises the ethics guidelines in accordance with which all Group employees must carry out their professional activities; training dedicated to these issues; an internal “Rubis Integrity Line” whistleblowing system allowing each employee to report breaches of ethics rules (described in chapter 4, section 4.5.1.1). The governance rules in place within the Rubis Terminal JV provide for the application of ethics standards that are at least equivalent to those applied within the Rubis Group;

•   Group-level governance including: the CSR & Compliance Department tasked with overseeing and coordinating the development and implementation of the Group’s compliance policy and managing risks and issues relating to CSR, the appointment of a Compliance Manager for each division and a network of 36 Compliance Advisors (including four within the Rubis Terminal JV) present in most of the countries where the Group operates.

(1) This risk is described in the NFIS, chapter 4, section 4.5.1.1.

3.1.2.4     Financial risks

FOREIGN EXCHANGE RISK

Probability:     Impact:

Description of risks

Due to its international footprint and its business sector, Rubis is naturally exposed to fluctuations in foreign currencies (excluding the euro, its functional and reporting currency), and mainly fluctuations in the US dollar, as most of the Group’s revenues are generated in that currency. Rubis Énergie buys petroleum products on international markets in US dollars, whereas the sales and expenses of the Group’s international subsidiaries outside the euro zone are generally expressed in their local currency, which fluctuates widely for certain countries (e.g., Nigerian naira and Haitian gourde). Consequently, currency fluctuations are liable to impact the Group’s earnings, both upwards and downwards.

Moreover, in some countries (Nigeria, Kenya, Haiti, Suriname and, to a lesser extent, Jamaica, Madagascar and Rwanda), the lack of foreign currencies (shortage of dollars) can cause temporary difficulties in petroleum product supplies, which are purchased on international markets in dollars, thereby impacting the activity of the subsidiaries located there.

Examples of risk management measures

•   Except for specific cases, end customers are invoiced in the functional currency of the distributing entity.

•   Where possible, foreign exchange hedges on product purchases are put in place if the US dollar exchange rate used to establish the product’s sales price in local currency is fixed in advance, in order to preserve the margin.

•   The depreciation of local currencies is reflected in selling prices, as far as possible, when currency hedging is not possible.

•   Letters of credit are negotiated with the banks of the relevant countries in order to guarantee that US dollars can be obtained at the official rate.

RISK OF FLUCTUATIONS IN PRODUCT PRICES

Probability:     Impact:

Description of risks

With a few exceptions, Rubis Énergie’s activities are not very sensitive to product prices and changes in such prices. In certain areas where Rubis Énergie operates, fuel prices are administered, which makes it possible to preserve margins in these countries (35% of volumes are generated in countries where prices are administered). However, in some countries, administered price structures are not always applied or do not sufficiently account for variations in product prices on international markets, especially in pre-electoral periods or at times of sharply rising energy prices, generating a shortfall for the relevant entities (Madagascar, Haiti). Subsidies to compensate distributors like Rubis Énergie can also be paid late and in local currency, creating exposure to exchange rate risks. In addition, in some countries, governments may requisition volumes of fuels at prices below market prices, which may result in a financial loss for Rubis Énergie. Finally, faced with rising energy prices, some competitors may decide to offer spontaneous discounts, which may reduce the attractiveness of Rubis Énergie’s service stations, which would not have the ability to match prices.

The LPG distribution business, which is less regulated, is more exposed to the risk of product price variations. As it can take longer to pass on changes to customers in certain markets, temporary mismatches can occur, both upwards and downwards.

Examples of risk management measures

•   Rubis Énergie’s diversification, both geographically and by product category, makes it possible to reduce the consequences of the materialisation of this risk on results.

•   Increases in product costs are generally passed on to the customer, either contractually or unilaterally, market conditions permitting. Otherwise, temporary shifts may occur.

•   Product purchases may be hedged when the product selling price is fixed and determined in advance.

•   Rubis Énergie has a Supply Department that allows physical flows of product supplies to be secured and optimised upstream.

RISKS RELATED TO ACQUISITIONS

Probability:     Impact:

Description of risks

Acquisitions are an integral part of Rubis’ growth strategy. The risks of transactions of this nature are mainly related to difficulties or delays in the Group’s integration of acquisitions and, in particular, the implementation of the Group’s management standards. Risks relating to the evaluation of assets and liabilities may also emerge after the completion of an acquisition, as the quality of the information provided is sometimes limited by the local regulatory framework. Lastly, external environmental factors could affect the achievement of expected profits, including the macroeconomic environment, country risks as described in section 3.1.2.2, changes in the specific markets in which the transaction takes place, the response from or changes in the competition, or the loss of a competitive logistics advantage. There is a risk of impairment related to these risks.

Following major acquisitions in recent years, the Group has recorded significant goodwill (€1,719 thousand as of 31 December 2022).

Moreover, the Group’s strategy to diversify in favour of less carbon intensive energy resulted in two operations in the past two years:
the acquisition, completed on 14 April 2022, of 80% of Photosol France (now Rubis Photosol), one of the leading independent developers of photovoltaic electricity in France;
the acquisition of an equity interest of 18.5% in HDF Energy at the time of that company’s IPO in June 2021. This investment is classified in the Group’s consolidated statement of financial position under “Financial assets at fair value” with a counter entry in other comprehensive income. As such, the Group is exposed to a loss in value.

Examples of risk management measures

•   Rubis SCA’s Management Board, in conjunction with the General Managements of Rubis Énergie and Rubis Photosol, undertakes an in-depth examination of the companies or assets they intend to acquire as part of due diligence process, in order to better understand the contingencies, anticipate risks and integrate those risks into the valuation of the project.

•   A structured acquisition integration procedure is implemented, including in particular the appointment of a General Manager familiar with the Group’s rules and processes and the relevant business line.

•   In accordance with IFRS, Rubis tests goodwill for impairment at least once a year, and whenever Management identifies an indication of loss of value (see note 4.2 to the consolidated financial statements). Impairment is recognised if the recoverable value falls below the net carrying amount, with recoverable value being the greater of the value in use and fair value, less costs to sell. An impairment of €40 million was recognised as of 31 December 2022, reflecting the operational difficulties encountered by the Group in Haiti, given the political, economic and security environment in the country, which has affected all business sectors. The timetable for a return to normal conditions cannot be established with certainty.

•   Rubis SCA’s Management Board, together with the General Managements of Rubis Énergie and Rubis Photosol, conduct a detailed analysis of the investment programmes of the various Group subsidiaries to ensure that the expected value creation is realistic.

•   Regarding the Photosol acquisition: keeping management teams who have in-depth knowledge of their business in order to ensure business continuity and development.

RISKS RELATED TO MANAGEMENT OF THE EQUITY INTEREST IN THE RUBIS TERMINAL JV

Probability:     Impact:

Description of risks

The Rubis Terminal JV, created as part of the partnership concluded in 2020 between Rubis SCA and an infrastructure fund, is 55%- and 45%-owned (respectively) and jointly controlled by the two partners. Due to Rubis SCA’s loss of exclusive control, this activity has been accounted for in Rubis SCA’s consolidated financial statements using the equity method starting 30 April 2020 (see notes 3.2.2 and 9 to the consolidated financial statements).

This partnership aims to support the development of the Bulk Liquid Storage activity (operated by Rubis Terminal Infra and its subsidiaries, formerly Rubis Terminal) by strengthening its existing positions on its markets (ARA zone, France and Spain), diversifying its offering, and enabling it to consider new development opportunities. The partnership makes it possible to share economic and financial risks by limiting the amount of capital committed.

As a partner in this joint venture, Rubis SCA could be exposed to a risk that its equity interest loses value if there are difficulties in implementing the strategy defined with its new partner, which could affect the achievement of the expected profits.

In addition to the usual factors relating to the external environment (such as changes in competition and country and geopolitical risks) and legal and regulatory risks (such as the loss of an operating license, major litigation, significant changes in environmental regulations) that are liable to influence the Rubis Terminal Infra’s development, a deadlock should the partners disagree on decisions to be adopted or the partner’s failure to respect its commitments and obligations could lead to unfavourable consequences on expected results. This partnership’s success therefore depends in particular on the effectiveness of the governance framework put in place.

Furthermore, Rubis could be exposed to image risk if a major operational risk materialises (particularly an industrial risk) as a result of the joint venture’s name being associated with the Group. Finally, as Rubis SCA holds 55% of the joint venture’s capital, it may be held liable if Rubis Terminal Infra fails to comply with regulations applicable to entities considered as subsidiaries within the meaning of Article L. 233-1 of the French Commercial Code.

Examples of risk management measures

Rubis SCA has chosen as its partner a major infrastructure fund that has a long-term investment policy. This fund, which has a global footprint, invests in line with the best international ESG standards.

The Group ensures that its interests as a partner are protected, notably through the signature of a shareholders’ agreement, its representation on the joint venture’s governance bodies (Board of Directors) and regular reporting from Rubis Terminal Infra’s Management (see section 3.2.4).

Contractual arrangements enabling conflicts and deadlocks within the partnership to be resolved are included in the shareholders’ agreement.

Rubis ensures that the same level of standards as those implemented in its controlled entities are complied with by Rubis Terminal Infra’s Management teams by monitoring indicators and reports submitted by Management.

3.2 Internal control

3.2.1 Internal control framework

Framework

For the following description of internal control procedures, Rubis referred to the French Financial Markets Authority (Autorité des Marchés Financiers – AMF) guide dated 22 July 2010, which sets out a reference framework for risk management and internal control.

However, Rubis has adapted the AMF framework’s general principles to fit its business and own characteristics.

Objectives

Rubis has put in place a certain number of procedures designed to ensure that:

•   its activities comply with laws and regulations;

•   the instructions and strategic goals defined by the corporate bodies of Rubis SCA and its subsidiaries are applied;

•   the Company’s internal processes run smoothly, particularly processes that contribute to safeguarding its assets;

•   financial information is reliable;

•   a process exists for identifying the principal risks linked to the Company’s business;

•   there are tools to prevent fraud and corruption.

Like any internal control system, the system put in place by Rubis cannot provide an absolute guarantee that the Company will be able to achieve its objectives and eliminate all risks.

Scope

This section sets out the procedures applicable to Rubis Énergie, wholly-owned by Rubis SCA, and its sub-subsidiaries, as well as to Rubis Photosol and its sub-subsidiaries. These procedures are distinct due to the specificities of the two organisations and are therefore described separately.

The Rubis Terminal JV is managed jointly with the partner. The joint venture’s General Management is responsible for setting up and ensuring internal controls (in accounting, financial and risk matters) in accordance with applicable standards and regulations and its shareholders’ expectations. Details about this joint venture are provided in section 3.2.4 of this chapter.

System components

Although it has acquired an international scale, Rubis wishes to remain a decentralised organisation that is close to the field so that it can provide its customers with solutions that are adapted to their needs by having the ability to take the necessary operational decisions quickly. Regular exchanges, conducted whenever necessary, between the Management Board, on the one hand, and the General Management and functional departments of Rubis Énergie and its foreign subsidiaries on the other hand, are the cornerstone of this organisation.

This managerial model gives the Manager of each industrial site or subsidiary a large degree of autonomy for managing his/her activity. However, such a delegation of responsibility is closely tied to complying with established procedures regarding accounting and financial information and risk monitoring, as well as regular controls by Rubis SCA’s relevant departments and by the functional departments of Rubis Énergie and Rubis Photosol (see sections 3.2.2.3 and 3.2.3.2).

Lastly, the Management Board inform Rubis SCA’s Supervisory Board (through its Accounts and Risk Monitoring Committee) of the essential characteristics of the Group’s internal control and risk management procedures. The Supervisory Board ensures that the main identified risks have been taken into account in the Company’s management and that systems designed to ensure the reliability of accounting and financial information are in fact in place (see chapter 5, section 5.3.2).

3.2.2 Accounting and financial internal control

Rubis SCA controls its divisional head subsidiaries: Rubis Énergie (Retail & Marketing and Support & Services activities) on the one hand, and Rubis Photosol on the other hand, in collaboration with the General Management of these companies. Rubis SCA draws up the Group’s strategy, coordinates and finances its development, takes the main management decisions resulting therefrom and ensures their implementation, both at the level of its direct subsidiaries and their subsidiaries. Rubis SCA has established accounting and financial structures and procedures that contribute to reliable internal controls being implemented.

3.2.2.1     General organisation of the Group

THE SUBSIDIARIES’ AND RUBIS SCA’S DEPARTMENTS

The Consolidation & Accounting Departments of Rubis SCA, Rubis Énergie and Rubis Photosol consolidate the Group’s accounts on a quarterly, half-yearly and annual basis. Their work involves:

•   checking that the consolidated financial statements are consistent with the provisional consolidated results prepared by the subsidiaries;

•   verifying that IFRS has been correctly applied;

•   analysing the consolidated financial statements through an analytical review, explaining changes in each item between two reporting dates.

They also monitor standards with a view to identifying any impact of proposed accounting reforms on the Group’s financial statements.

These departments are assisted by a specialist audit and accounting firm, and work under the oversight of the Managing Partners, the Chief Financial Officer and the Director of Accounting and Consolidation.

Accounting and financial information prepared by the subsidiaries is reported to Rubis SCA, via the Consolidation and Finance Departments and, ultimately, to the Management Board.

ACCOUNTS AND RISK MONITORING COMMITTEE OF THE SUPERVISORY BOARD

The main assignments of the Accounts and Risk Monitoring Committee (whose members and functioning are described in chapter 5, section 5.3.2) are as follows:

•   examining the financial statements, ensuring consistency of methods, quality of data and completeness, and ensuring that the financial statements give a true and fair view;

•   monitoring internal control procedures with respect to accounting and financial matters and risk exposure.

To carry out its work, the Accounts and Risk Monitoring Committee hears all managers in the information chain: the Management Board, Managing Director, Chief Financial Officer, Director of Accounting and Consolidation, Corporate Secretary, the CSR Director & Chief Compliance Officer, and the Statutory Auditors.

The members of the Accounts and Risk Monitoring Committee have access to the same documents as the Statutory Auditors and examine the summary of the Statutory Auditors’ work.

3.2.2.2     Preparation and reporting of accounting and financial information

The internal control system relies on several channels for reporting information designed to comprehensively identify sensitive issues.

PROCEDURE MANUALS

Rubis Énergie

Two manuals have been issued to harmonise the internal control and accounting treatment of the various transactions carried out:

•   the internal control manual;

•   the accounting policies manual.

There are also formalised memoranda and procedures covering areas such as:

•   delegations and limitations of powers in terms of incurring expenses (including investments), approving invoices, and bank payment authorisations;

•   sales management, to define the special terms and conditions granted to customers, limit the total outstanding amounts authorised, obtain bank guarantees, etc.

Rubis Photosol

Notes and procedures are formalised for all areas considered strategic in the company, and in particular in terms of:

•   delegations and limits of authority, relating to expenditure commitments, on the one hand, and bank payment powers, on the other;

•   dbilling of revenue;

•   capex monitoring (accounting, capitalisation by components, related tax declarations, budget monitoring).

All operations involved in the preparation of financial data (production, first-level controls, and even second-level controls) are inventoried in a work programme adapted to each type of company and are systematically monitored.

The roles and responsibilities of all persons involved in the preparation and reporting of accounting and financial information are identified and summarised in dedicated documents.

INFORMATION SYSTEMS

Rubis Énergie

Rubis Énergie has a centralised information system that makes it possible to consolidate all financial information: management reports for each company, standardised by type of business line/activity; quarterly accounts, monthly margin analyses, monitoring of capital expenditures, budgetary and management forecast monitoring in three phases (initial budget approved in year Y-1 including a three-year plan, budget forecast updated in the second quarter and then in the fourth quarter of year Y). All financial data is archived and backed up daily.

Automatic consistency checks are also carried out directly by the IT system in order to limit any input errors. Documents stored in the central system also serve as a reference and a basis for reconciliation for the internal audit teams during their missions.

Rubis Énergie also operates a document management system that allows its various subsidiaries to share technical, HSE and legal information. Major investment and construction projects are thus closely monitored by Rubis Énergie’s Technical Department.

Rubis Photosol

Rubis Photosol’s accounting and financial information is produced and recorded using modular financial management software integrating the monitoring of investments, to which a cash management system and a supplier invoice digitisation solution are linked. The server hosting the financial management tool is backed up daily.

The information systems are configured to integrate a certain number of controls, to limit and/or block transactions according to the powers of each individual and to integrate certain internal control rules, in particular:

•   the so-called “four eyes” rule is systematically included in the definition of profiles in all systems impacting financial flows;

•   the expenditure commitment powers of all employees concerned are configured in the invoice validation system;

•   automatic consistency checks are integrated into the accounting system to limit data entry errors (duplication, nature and calculation of VAT).

All of these tools are administered by the Rubis Photosol Administration and Finance Department.

Information system administration rights are granted to a limited number of people who receive specific training.

Financial, legal and operational documents are produced and backed up via a document management system equipped with a back-up system with redundant server and daily backups.

For the financial year 2022, the work relating to the consolidated financial statements was carried out by the central Rubis SCA team using the Group tool (SAP BFC) and according to the customary procedures.

BUDGETS AND REPORTING

Rubis Énergie

Budgets are drawn up at the end of the year by Rubis Énergie’s subsidiaries and sub-subsidiaries successively, as part of a rolling three-year budget plan based on management elements and budget indicators defined and standardised by business line. The indicators are defined by Rubis Énergie’s General Management and operational management in accordance with Rubis’ strategy.

Budget indicators include gross profit, EBITDA, EBIT, net profit/(loss), capital expenditure, cash flow and free cash flow, debt, volumes, carbon footprint reduction.

At Rubis Énergie, budgets are drawn up by each subsidiary by country. They are reviewed by the division’s Management Control, Audit and Consolidation Department, which, after discussion and/or revision, prepares a consolidated budget that is then reviewed by Rubis Énergie’s General Management and forwarded to Rubis SCA for review at Management Committee meetings.

Rubis Énergie’s Finance and Management Control Department prepares monthly reports and analyses differences between actual data, budget forecasts, and data from prior financial years.

The reports are issued within 10 calendar days after the end of the month and are then examined and compared to initial forecasts at the Management Committee meeting, with the Rubis SCA Management Board in attendance.

Rubis Photosol

On the basis of the strategic orientations defined by Rubis Photosol’s General Management in conjunction with Rubis SCA’s Management Board, budgets are prepared at the beginning of the financial year by each operational management, for their respective areas of responsibility and with a horizon of two years.

These budgets are integrated into a two-year forecasting model (known as the “short-term model”) that includes data from almost all of the Group’s entities, as well as a consolidated overview at the level of the Rubis Photosol head entity. This model enables the production of key indicators essential to the monitoring of the activity, namely: revenue, EBITDA, net profit, investments, net debt, electricity production and installed capacity.

The indicators from the model are then reviewed by Rubis Photosol’s General Management, which ensures consistency with the strategic orientations defined in conjunction with Rubis SCA’s Management Board and the consistency of budgets between them. Some budgets may then be revised.

The final budgets approved by Rubis SCA’s Management Board and Rubis Photosol’s General Management are included in the final short-term model, the indicators of which will then be fixed as reference indicators.

These budgets, and consequently the short-term model, are then updated quarterly. At each quarterly closing, the data obtained are compared to the forecasts and the differences are analysed and explained.

A 35-year forecasting model (known as the “long-term model”) is also developed, based, on the one hand, on the short-term model and, on the other hand, on assumptions that may be internal (for example, changes in the portfolio and forecast MWp) or external (for example, changes in the price of electricity).

In addition, a report produced and distributed on a monthly basis enables Rubis Photosol’s General Management to precisely monitor the key elements of the activity of Rubis Photosol and its subsidiaries and presents changes in the project portfolio, monthly electricity production, corresponding revenue, and explanations of differences between forecasts and previous financial years.

Lastly, monthly reporting (also available on a daily basis via a dedicated tool) makes it possible to monitor mark-to-market exposures for derivatives of Rubis Photosol and its subsidiaries.

FINANCING AND CASH MANAGEMENT

Rubis Énergie

Rubis SCA’s and Rubis Énergie’s Finance Departments are responsible for negotiating with banks to raise acquisition financing. They also analyse bank covenants. Cash investments are made in cash instruments, excluding any speculative or risky investments.

Rubis Photosol

Rubis Photosol’s Financing Department is responsible for negotiating project financing with banks (non-recourse debt), on the one hand, and corporate financing (bank or private financing), on the other hand.

Banking covenants are verified twice a year, on the basis of the annual and half-yearly financial statements.

Cash management, together with verification of compliance with the various conditions imposed in loan and cash agreements are carried out by the Treasury division within the Administration and Finance Department.

FINANCIAL STATEMENTS

Rubis Énergie and Rubis Photosol

The companies falling within the scopes of Rubis Énergie and Rubis Photosol prepare quarterly, half-yearly and annual consolidation packages. The half-year and annual financial statements are reviewed and audited by the Statutory Auditors. Rubis SCA’s Finance and Consolidation Departments prepare the Group’s consolidated financial statements in accordance with the standards issued by the International Accounting Standards Board (IASB) and adopted by the European Union. Consolidation procedures include a set of controls to guarantee the quality and reliability of financial information.

3.2.2.3     Supervisory bodies

The internal control system relies on technical and operational procedures designed to identify sensitive issues, and on a lean and streamlined organisation built around Rubis SCA’s Management Board and General Management and Rubis Énergie’s functional and operational departments in order to ensure the effectiveness of the internal control systems via the Management Committees. An internal control manual was drafted in 2020 in collaboration with the French Institute of Audit and Internal Control (IFACI), making it possible to list all the control points to be complied with in each area in which Rubis Énergie’s subsidiaries operate. The new manual should enable the Group’s various companies to conduct self-assessments on a regular basis and to continue to ensure that the risks of fraud and failures are properly controlled. At Rubis Photosol, Management Committees are held monthly, bringing together the Directors and General Management of Rubis Photosol. These Committees ensure in particular that effective internal control is put in place at the subsidiary. In addition, Rubis Photosol has an internal Management Committee whose main mission is to ensure the retranscription of the decisions and orientations defined during the Management Committee meeting with Rubis SCA.

FUNCTIONAL DEPARTMENTS OF RUBIS ÉNERGIE AND RUBIS PHOTOSOL

Rubis Énergie’s functional departments carry out regular and necessary checks on the procedures in place in their respective fields. Reporting procedures and indicators make it possible to have high-quality monitoring.

Rubis Photosol’s functional and operating departments meet bi-monthly in the presence of Rubis Photosol’s General Management. These meetings are designed to present reportings, budget dashboards and the progress of projects at their various stages, as well as significant events that may impact results. Non-financial challenges (notably, the determination of CSR commitments and risk mapping) are also presented to ensure that they are taken into account operationally by all departments.

INTERNAL AUDIT

Internal audit is an independent and objective activity that makes it possible to ensure that operations are properly controlled and that the procedures in place are constantly improved. Internal audits allow Rubis Énergie’s General Management to reach its targets by assessing its risk management, control and corporate governance processes via a systematic and methodological approach, and to make recommendations to improve their efficiency.

At Rubis Énergie, this function is part of the Management Control, Audit and Consolidation Department. The Director of the department and his/her colleagues carry out internal audits on the entire scope of the Retail & Marketing and Support & Services activities. These audits are planned with Rubis Énergie’s General Management at the beginning of the year. There are numerous fields of inquiry, which mainly cover verifying that local and Group processes are correctly applied, in particular with regard to the prevention of corruption, the improvement of internal control procedures and accounts closing procedures, inventory, cash and fixed asset controls, and controls of all other off-balance sheet commitments and liabilities recorded in the audited company’s accounts. The audit may also cover capital expenditures and analyse differences between expected returns and actual profitability.

The auditor has complete freedom to conduct his/her work as he/she deems appropriate and is independent from the local management when performing this task. The audit brief and report template follow a standard model so that the conclusions can be efficiently understood by all recipients, namely the General Manager of the audited company and the Finance Department and General Management of Rubis Énergie. The risk factors identified during internal audits are also used to update the relevant company’s risk mapping.

The audit recommendations are subject to a schedule for the implementation of corrective actions which must be respected by the company concerned.

The proper implementation of these corrective actions is also automatically verified during the next audit of the relevant company. In addition, each subsidiary sends Rubis Énergie’s General Management a monitoring report on the implementation of audit recommendations every two months until all the measures recommended by the internal audit have been definitively implemented.

The consolidators are also responsible for analysing the monthly results and the consistency of the data supplied each month by all consolidated companies. This work makes it possible to anticipate accounting errors and improves the reliability of the Group’s financial statements.

Each Rubis Énergie subsidiary is audited once every two years, on average. Internal auditors have worked on the development of IT tools making it possible for Rubis Énergie to better manage risks and associated action plans. These new tools, after validation of the needs expressed by Rubis Énergie’s various operational departments, should, by mid-2023, contribute to strengthening risk management and reinforcing control and due diligence procedures.

THE SUBSIDIARIES’ MANAGEMENT COMMITTEES

Control procedures are structured around Rubis Énergie’s Management Committee.

A Management Committee has been established for each country or region. This Committee meets twice a year and includes: the country’s General Manager, General Management, Finance Department, Management Control, Audit and Consolidation Department,Technical Department, the division’s Resources and Risks Department, and Rubis SCA’s Managing Partners, Managing Director and Chief Financial Officer.

During these meetings, budget reportings and dashboards are analysed, along with the performance and results of each business line, development projects and project monitoring, and events considered to be significant for the Company and Group, as much in terms of strategy and operations as in terms of personnel. Questions and issues raised at previous meetings may also be reviewed if necessary. Non-financial challenges, such as the rollout and implementation of the CSR strategy (and in particular the CSR Roadmap, Think Tomorrow 2022-2025) and decarbonisation projects are also carefully reviewed during these Management Committee meetings.

Therefore, it is ultimately the Management Committees that analyse the financial and non-financial information collected through the reporting process set up by Rubis Énergie’s operational management and those of its sub-subsidiaries. The entire reporting cycle is based on standardised principles and a single database that is shared by all teams within the Finance Departments and operational management involved in reporting.

RUBIS SCA’S SUPERVISORY BODIES

Rubis SCA’s Consolidation and Accounting Department runs numerous checks aimed at ensuring that financial information is reliable, particularly during account closing reviews.

Rubis SCA’s Management Board, Managing Director and Chief Finance Officer regularly analyse the subsidiaries’ financial statements and periodically meet with Rubis Énergie’s General Management in order to conduct an assessment, evaluate risks and the corrective actions that may be necessary to achieve the Group’s objectives (both financial and CSR). Lastly, the Group CSR Director & Chief Compliance Officer maintains ongoing dialogue with the subsidiaries on various topics, including litigation, trademarks, insurance, risk identification and monitoring (mapping), compliance (anti-corruption, embargoes, etc.).

3.2.3 Internal risk management

All major risks and their monitoring, as well as the corresponding policies for covering these risks are described in detail in section 3.1 of this chapter and in chapter 4.

In terms of risk, the Group operates in business sectors that are tightly controlled and regulated. The Group’s structure is designed to reflect this circumstance. All French sites covered by the Seveso directive have safety management systems whose main purpose is to define the organisation, staff functions, procedures and resources that allow the Group to establish and implement a prevention policy for major accidents.

In addition, Group entities often operate their activities in the framework of ISO 9001 and ISO 14001 quality certifications, particularly with respect to the adoption and application of procedures and instructions relating to safety and the environment (see chapter 4, section 4.2.1.2). Accordingly, they follow processes that are extremely formalised.

Internal control procedures for risk management and monitoring seek to cover all of the Group’s businesses and assets. They are based on a process for identifying and analysing the main risks which is reinforced by the appropriate organisation, allowing General Managers to address these risks and maintain them at an acceptable level.

3.2.3.1     General organisation of the Group

THE SUBSIDIARIES’ AND RUBIS SCA’S DEPARTMENTS

In the same way as for accounting and financial internal control, internal risk management is subject to monitoring by the subsidiaries’ operational management, which keep Rubis SCA regularly informed.

At Rubis Énergie, the headquarters’ Technical Department (QHSE) establishes information reporting procedures and preventive measures for anticipating and managing risks, as described in chapter 4, section 4.2.1. Rubis Énergie’s Technical Department reports information on the main risks to its General Management. Certain events may also be discussed by the Management Committee.

At Rubis Photosol, internal procedures are backed up by control systems. The management control function has also been strengthened.

Lastly, Rubis Énergie and Rubis Photosol present these main risks to the relevant departments of Rubis SCA (Management Board, Accounting and Consolidation Department, Finance Department and Corporate Secretary in charge of the Legal Department, CSR & Compliance Department) through different transmission channels, such as risk mapping (see section 3.2.3.2 below).

ACCOUNTS AND RISK MONITORING COMMITTEE

The Accounts and Risk Monitoring Committee reviews how internal control and risk management procedures are organised, as described in this section 3.2.2.1 of this chapter and in section 5.3.2 of chapter 5.

3.2.3.2     Identification and monitoring of the main risks

The internal control system relies on several channels for reporting information on the main risks, which are designed to exhaustively identify sensitive areas.

RISK MAPPING

Rubis has developed and conducted mappings of risks to which the Group’s various activities may be exposed. The analysis of these risks also takes into account their occurrence and their financial and reputational impact (on a scale of one to five). These mappings were conducted in close cooperation with Rubis SCA’s Legal, Consolidation, and Finance Departments, together with the operational managers and Rubis Énergie’s Financial and Technical Departments. The risk mapping system has been extended to Rubis Photosol as part of its integration process. A self-evaluation is carried out at regular intervals to identify new risks.

The risks analysed have been divided into different families: market risk, accounting miscalculation, insurance, and commercial, environmental, industrial, climate, supply chain, social, legal, and IT risks. The legal risk category also includes issues related to fraud, contractual breaches and, until 2017, corruption risks. In 2018, the Group carried out a specific process to assess the corruption risks to which entities may be exposed, in accordance with the Sapin II law (see chapter 4, section 4.4.1.1).

The maps are completed annually by the operational Managers of the industrial sites and by the Directors of the French and international subsidiaries, assisted by Rubis Énergie’s functional Managers. They are updated during the year at Management Committee meetings. The maps aim to provide on a yearly basis the monitoring status of the significant risks that have been identified and to describe any measures that have been taken or need to be taken to mitigate them if they cannot be completely eliminated.

All these maps are consolidated by Rubis Énergie.

At Rubis Photosol, a risk mapping was formalised in 2022, drawn up in close collaboration between the Rubis SCA Corporate Secretary and the Rubis Photosol Legal Department, on the basis of discussions with the heads of the various departments (International Development and France Development, Administration and Finance Department, Technical Department, Engineering and Construction Department, Operations and Maintenance Department, Human Resources) as well as Rubis Photosol’s General Management.

These consolidated mappings, together with a review of the major events and non-financial challenges of the past year, are sent by Rubis SCA’s Management Board to the Accounts and Risk Monitoring Committee for special meetings dedicated to risks (see chapter 5, section 5.3.2). In turn, the Accounts and Risk Monitoring Committee and the Management Board report to the Supervisory Board at its meetings in March and September.

HSE AND CSR REPORTING AND PROCEDURES

The functional departments of Rubis Énergie and Rubis Photosol have established reporting, analysis and information-sharing systems covering health, safety and environment (HSE) issues. These systems are described in greater detail in chapter 4, section 4.2.1.2.

The Group CSR & Compliance Department has also implemented an IT tool for reporting and analysing CSR data (environmental, safety, social, compliance and societal) as described in chapter 4, section 4.5.2 (methodological note in the Non-Financial Information Statement).

3.2.3.3     Supervisory bodies

The control system is based on management accountability and risk monitoring entrusted by the Management Board to each subsidiary’s General Manager and on a system of internal and external audits.

THE FUNCTIONAL DEPARTMENTS OF RUBIS ÉNERGIE AND RUBIS PHOTOSOL

As part of its decentralised structure, the Group encourages quality and independence among its employees, who are responsible for all aspects of their role, including risk management.

Rubis Énergie

Rubis Énergie’s General Management is ultimately responsible for the risk management policy, within the framework defined by Rubis SCA’s Management Board.

In addition to the local teams, the operational managers of each entity are assisted by Rubis Énergie’s functional departments: Technical/HSE Department, Finance Department, Management Control, Audit and Consolidation Department (including Compliance), Resources and Risks Department, CSR/Climate/New Energies Department.

Entity General Managers have overall responsibility for risk management and control at their facilities. In addition, Rubis Énergie has a Technical Department that regularly provides operational advice and conducts inspections of facilities with the aim of guaranteeing compliance with uniform operational, safety and environmental standards.

Rubis Photosol

Rubis Photosol’s General Management is ultimately responsible for the risk management policy, within the framework defined by Rubis SCA’s Management Board.

INTERNAL AUDIT

Certain non-financial risks are included in the internal audit programmes. Accordingly, verifying the reliability of ethics and anti-corruption policies is one of the issues addressed during inspections performed locally by Rubis Énergie’s Management Control, Audit and Consolidation Department.

THE SUBSIDIARIES’ MANAGEMENT COMMITTEES

At meetings of subsidiaries’ Management Committees (see section 3.2.2.3), an item bearing on the review and monitoring of risks is regularly included on the agenda and is the subject of discussions between the subsidiaries’ General Managers and the Management Board.

STANDING EXTERNAL BODIES

These are:

•   French Regional Environment, Development and Housing Departments (DREALs), which are responsible in France for regular inspections of industrial facilities and for the application of the “Safety Management System” in order to ensure that the subsidiary has its business risks under control. Similar systems exist for the sites of certain foreign subsidiaries;

•   ISO certification bodies, such as AFAQ (Association française de l’assurance qualité) or LRQA (Lloyds Register Quality Assurance), which regularly audit certain ISO 9001-certified Rubis Énergie subsidiaries. During these audits, facilities are regularly checked for compliance with procedures, processes and operating practices put in place as part of the Quality plan to ensure they keep their certification and identify areas for improvement.

3.2.4 Rubis Terminal JV

The General Management of Rubis Terminal Infra is responsible for implementing and ensuring internal control (in accounting, financial and risk matters) in all of the joint venture’s subsidiaries, in accordance with applicable standards and regulations. Rubis SCA exercises its control through monthly reports sent by Rubis Terminal Infra’s General Management to the designated members of the Board of Directors, on which Rubis SCA has representatives.

Rubis Terminal Infra’s budget is drawn up by its General Management in conjunction with the Finance Department and is approved by RT Invest’s Board of Directors.

Rubis Terminal Infra’s General Management provides RT Invest’s shareholders with an annual update of the consolidated risk maps of all its subsidiaries (technological risk map; financial, legal and commercial risk map; corruption risk map) as well as a review of the major events and non-financial challenges of the past year.

3.3 Insurance

The Group has taken out several insurance policies in order to offset the financial consequences of materialised risks. The main policies cover both property damage and operating losses as well as civil liability.

Specific policies have also been put in place for the Group’s newly-developed businesses.

Finally, the Group has also taken out a policy covering its Senior Managers’ civil liability.

Insurance programmes are taken out with leading international insurers and reinsurers. The Group believes that these programmes are suited to the potential risks linked to its activities. However, the Group cannot guarantee that in the event of a claim, and an environmental claim in particular, all financial consequences will be covered by insurance. The Group also cannot guarantee that it will not suffer any losses that are uninsured.

3.3.1 Rubis SCA

Senior Managers’ civil liability

Senior Managers of Rubis SCA and its controlled subsidiaries are insured, as are Senior Managers of designated 50%-owned joint ventures.

The policy covers the financial consequences of incidents resulting from any claim involving the individual or joint and several civil liabilities of the insured persons and attributable to any professional misconduct committed by such insured persons in the performance of their management duties.

The cover is capped at €10 million per year for front-line insurance, €10 million per year for second-line insurance and €30 million per year for third-line insurance, all losses combined.

3.3.2 Rubis Énergie (Retail & Marketing/Support & Services)

International programmes taken out by Rubis Énergie on behalf of itself and its subsidiaries have been renewed with leading insurers.

3.3.2.1     Property damage and parametric insurance

The “All risks except” policy was renegotiated for one year with the same insurers.

The Damages guarantee in the event of fire and similar events provides compensation in the amounts of €200 million per claim for terminals and €15 million per claim for service stations. This contractual limit was calculated on the basis of the maximum amount of possible loss.

The Group’s exposure to natural events, particularly in the Caribbean, is covered in the amount of €15 million per claim and per event.

A parametric hurricane insurance policy has also been set up covering sites in the Caribbean, with compensation capped at €5 million.

In compliance with local laws, for subsidiaries located outside the European Union, Rubis Énergie’s international programme is taken out with our lead insurer’s local network. Rubis Énergie’s policy provides coverage where there are differences in terms and limits.

3.3.2.2     Civil liability

Rubis Énergie’s programme covers operating civil liability and post-delivery civil liability. Coverage amounts to €150 million per claim, all damages included, and the programme has been renewed with the same insurers.

In compliance with local laws, for subsidiaries outside the European Union, Rubis Énergie’s first-line international programme with minimal coverage is taken out with our insurer’s local network. The Group policy provides coverage where there are differences in terms and limits.

The Group environmental civil liability policy was renegotiated in 2022 for a term of two years for Rubis Énergie and its subsidiaries. Compensation is capped at €40 million per claim and covers environmental liability, damage to biodiversity and clean-up costs.

Due to its refining activities, SARA renegotiated its contract as of 1st January 2022, providing specific first-line cover for two years in the amount of €20 million per insurance period. The Master programme provides second-line insurance.

The aviation liability coverage taken out by Rubis Énergie for its subsidiaries that distribute aviation fuel has been renewed under the same terms in the amount of US$1 billion for risks related to damage caused to third parties during refuelling.

3.3.2.3     Shipping

Charterer’s civil liability insurance has been taken out for all Rubis Énergie’s activities/subsidiaries with a P&I Club, a member of the International Group, with guarantees of US$500 million and US$1 billion in the event of pollution. The eight vessel-owning companies are covered for their civil liability by the same P&I Club belonging to the International Group.

A Group cargo insurance policy was renewed to cover damage to goods. It is capped at US$70 million for Rubis Énergie and its subsidiaries.

A vessel hull policy has been taken out to cover for damage and machinery breakdown.

3.3.2.4     Other risks

A political violence policy (excluding mandatory pools) was subscribed for €80 million to cover the Group’s depots and service stations.

3.3.3 Rubis Photosol

The insurance programmes taken out by Rubis Photosol on its behalf and that of its subsidiaries have been renewed with leading insurers specialising in the renewable energy sector.

3.3.3.1     Damage occurring during the construction phase

During the photovoltaic facility construction phase, Rubis Photosol has two insurance policies: a project owner’s civil liability policy (RCMO) and an All Risks Site Assembly Tests policy (TRCME).

These two policies were renewed in January 2022 with the same insurer for a period of three years. The renewal took place under conditions identical to those in force in 2021.

These policies cover all photovoltaic facilities under construction from the moment a prior declaration is made to the insurer.

The RCMO covers each declared company developing a photovoltaic installation project against the consequences of its civil liability during construction sites up to an amount of €10 million, all damages combined.

The TRCME policy covers in particular claims related to fire, attacks, vandalism, theft, bad weather (storms, snow, hail), and natural disasters.

All of the assets comprising the power plant, with the exception of the HTB items, are covered.

The insured capital represents 10% of the amount of the damage coverage per plant, with a maximum of €1 million.

An anticipated loss of revenue policy is also put in place for all projects in the amount of the annual revenue of the facility concerned over a 12-month period. As no revenues have been generated at this date, this is an estimate of annual revenue.

3.3.3.2     Damage occurring during the operational phase

The Rubis Photosol insurance programme in the operational phase includes, on the one hand, the breakage of photovoltaic facilities and property damage policy and, on the other hand, the loss of revenue policy.

These two policies were also renewed in January 2022 under identical conditions to the previous ones.

The photovoltaic facilities breakage and property damage policy covers all facilities (roofs, shades and ground) up to the declared value of each one. Claims resulting from fire, attacks, vandalism, theft, bad weather (storms, snow, hail) and natural disasters are covered under this policy.

Loss of revenue is intended to compensate the company covered for loss of revenues caused by any claim during the operating phase, for a period of 12 months.

3.3.3.3     Civil liability

An electricity producer civil liability policy covers each company developing a photovoltaic facility, regardless of the type of facility.

Damages arising during construction in terms of civil liability are covered annually for an amount of €10 million and during the operating phase for an amount of €6.5 million.

Rubis Photosol’s servicing and maintenance subsidiary, Photom Services, has its own civil liability coverage. Thus, Photom Services has taken out professional civil liability in the amount of €8 million per claim and per year. It also benefits from a 10-year civil liability.

All of these policies were also renewed for a period of three years from 1st January 2022.


4. CSR and NON-FINANCIAL INFORMATION / NFIS /

Although it has acquired an international dimension, Rubis has remained a company on a human scale which, through a decentralised organisation, encourages professionalism, experience and autonomy of its employees, who assume all the responsibilities linked to their positions, including the management of non-financial risk. Rubis believes that involving Management in CSR issues at all levels of the organisation is key to ensuring the sustainability of its activities (section 4.1.1). To better focus its efforts, the Group has carried out a risk analysis that identified 15 risks as being the most material in terms of its activities (section 4.1.2). These risks are grouped around five priority challenges that underpin the Group’s CSR approach:

•   limiting our environmental impact (section 4.2.2);

•   operating in a safe environment (section 4.2.3);

•   fighting against climate change (section 4.3);

•   attracting, developing and retaining our talents (section 4.4);

•   operating responsibly and with integrity (section 4.5).

4.1 Non-Financial Information Statement / NFIS /

This section includes Rubis’ CSR strategy, in line with the Non-Financial Information Statement (NFIS) requirements provided for by European Directive 2014/95/EU transposed by French Government Order 2017-1180 and implementing decree 2017-1265. This NFIS presents:

•   the main risks related to the Group’s activities(1);

•   the policies implemented to address those risks;

•   monitoring indicators and their results.

4.1.1 A model for sustainable growth

A diagram presenting the Group’s business model is available in chapter 1 of this document on pages 16-17.

4.1.1.1   Activities structured around three businesses and one joint venture

As an independent player in the energy sector, present in around 40 countries in Europe, the Caribbean and Africa, Rubis is structured around three businesses:

•   two operated by Rubis Énergie:

•   Retail & Marketing of fuels, liquefied gas and bitumen,

•   Support & Services, supporting the Retail & Marketing activity: trading-supply, shipping and refining;

•   a new Renewable Electricity Production division created in 2022, Rubis Renouvelables, including:

•   Rubis Photosol, one of the leading independent producers of photovoltaic electricity in France,

•   the acquisition of an 18.5% stake in the capital of HDF Energy, a global pioneer in hydrogen electricity.

In addition, the Rubis Terminal JV carries out a Bulk Liquid Storage activity (petroleum and chemical products, biofuels, fertilisers, agrifood products) on behalf of diverse industrial customers.

(1) Including, for this Non-Financial Information Statement, the activities of the Rubis Terminal JV, in which Rubis SCA holds a 55% stake and over which it lost exclusive control on 30 April 2020.

Details of the scope of the NFIS

Exclusion of Rubis Photosol for financial year 2022

In accordance with the rules defined by Rubis, any acquisition of an entity (change in scope) is gradually taken into account in the CSR scope and not before the first full financial year occurring after the date of integration of the entity in the financial scope. For the sake of consistency with the financial scope, it was decided to exceptionally take into account social data (excluding training data) from the financial year 2022. The other CSR stakes require an analysis of the risks and opportunities, the definition of policies to address them and associated objectives during the financial year 2023, as this is a new activity for the Group. For further information, please refer to the methodological note in section 4.6 of this chapter.

In accordance with the EU Taxonomy Regulation 2020/852, Rubis Photosol has been included in the 2022 taxonomy indicators since its consolidation in the financial scope, i.e., 1st April 2022.

Contribution of the Rubis Terminal JV

In accordance with the applicable regulations (Article L. 225-102-1 of the French Commercial Code), the activities of the Rubis Terminal JV, which Rubis SCA holds at 55% and over which it lost exclusive control on 30 April 2020, are included in this Non-Financial Information Statement. The Rubis Terminal JV data are presented as follows: environmental data presented at 100% and Group share (55%); greenhouse gas emissions at 55% in accordance with official methodologies; social/health and safety data at 100%, societal data at 100%. For further information, please refer to the methodological note in section 4.6 of this chapter.

Rubis’ development strategy is based on specialised market positioning, a robust financial structure and a dynamic acquisition policy. In addition to these commercial and financial elements, the development strategy also incorporates non-financial objectives that allow the Group to pursue sustainable growth. The regularity of the teams’ performance stems from a corporate culture that values entrepreneurial spirit, flexibility, accountability and the embracing of socially responsible conduct. Rubis conducts its activities by implementing a CSR approach that contributes to the United Nations’ Sustainable Development Goals (SDGs).

4.1.1.2   Empowerment and freedom of initiative: people at the heart of the organisation

In keeping with its motto: “The will to undertake, the corporate commitment”, Rubis puts human relationships at the heart of its organisation. Individually empowering men and women who contribute to its activities means promoting freedom of initiative and the ethical, social and environmental values that Rubis wishes to see respected by all.

The Group aims to act with professionalism and integrity across its entire scope.This requirement safeguards against any wrongdoing that could be prejudicial to the company, employees, business relations or to any other external stakeholder, and is reflected in the following principles, detailed in the Rubis Group Code of Ethics (see section 4.5.1):

•   compliance with applicable legislation and regulations;

•   promotion of safety and respect for the environment;

•   respect for individuals;

•   rejection of all forms of corruption;

•   prevention of conflicts of interest and insider trading;

•   compliance with competition rules.

4.1.1.3    Strengthened CSR governance thanks to committed management that is aware of ethics, social and environmental risks

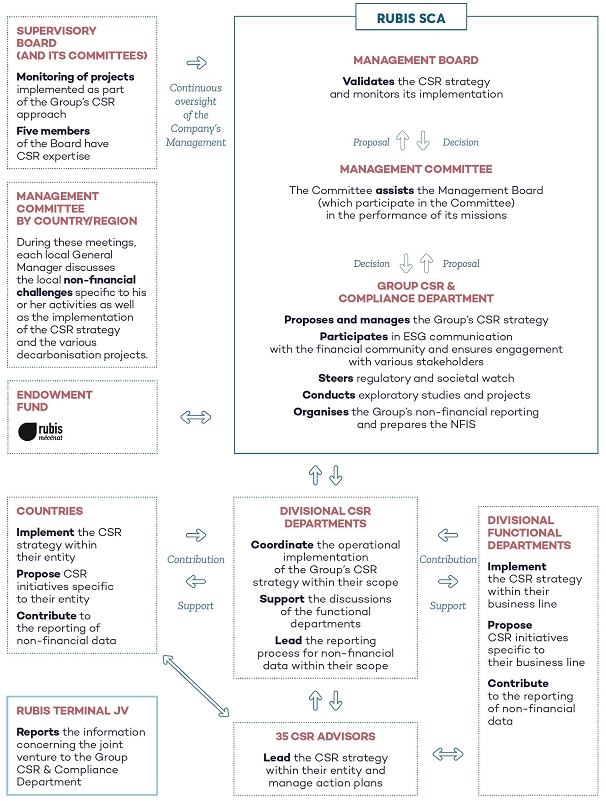
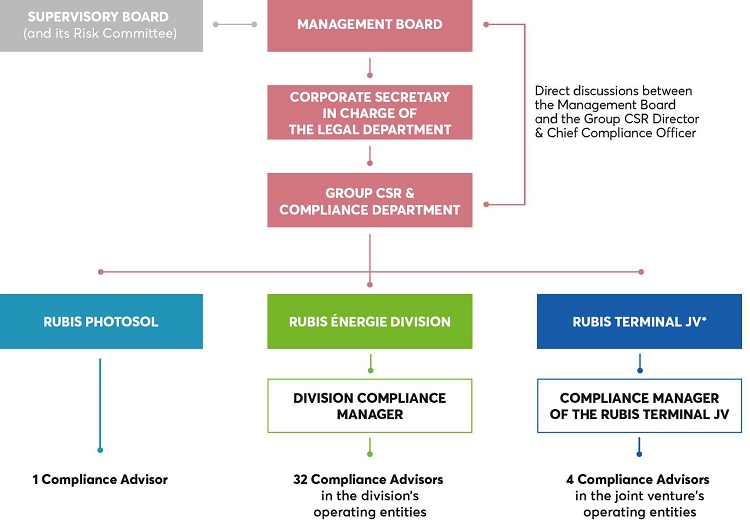
The CSR policy is driven by Rubis SCA’s Managing Director in charge of New Energies, CSR and Communication in conjunction with the Management Board. She is supported by the Group CSR & Compliance Department, which is responsible for proposing the CSR policy’s guidelines and driving the approach in coordination with the various Departments involved (Climate, HSE, Human Resources, Finance, Legal, and Social Engagement).

Since 2015, part of the Managing Partners’ annual variable compensation has been linked to ethics, social and environmental criteria (see chapter 5, section 5.4.2). These criteria are also included in the framework letters that set out the annual objectives of Rubis Énergie’s Senior Managers. A presentation of the initiatives taken and results obtained is made to the Supervisory Board’s Accounts and Risk Monitoring Committee each year.

In 2022, Rubis continued to expand its CSR teams, both at Group level and in Rubis Énergie’s CSR & Climate Department. A network of 35 CSR Advisors throughout the subsidiaries has been set up to ensure the deployment of Rubis’ CSR approach in all entities.

Rubis Photosol created the position of CSR Manager in January 2023, whose mission is to roll out and adapt the Group’s CSR strategy to this new photovoltaic electricity activity.

CSR GOVERNANCE


The Rubis Terminal JV continues to implement the CSR policy it has defined to date, in line with Rubis’ general principles. In accordance with regulations, as a subsidiary that is 55% owned by Rubis SCA, the Rubis Terminal JV continues to report its annual CSR data to the Group so that they can be included in this Non-Financial Information Statement. However, as this entity is jointly controlled by Rubis SCA and its partner, the CSR policy is now steered and monitored by the joint venture’s Board of Directors, on which Rubis SCA is represented. The joint venture’s CSR objectives are adopted by its Board of Directors. As a shareholder, Rubis SCA ensures that the Rubis Terminal JV complies with CSR standards that are at least equivalent to its own.

Lastly, the Rubis SCA Accounts and Risk Monitoring Committee monitors the analysis of the Group’s main ethics, social and environmental risks and the corrective measures taken to prevent such risks (see chapter 5, section 5.3.2).

4.1.1.4   A continuous improvement approach

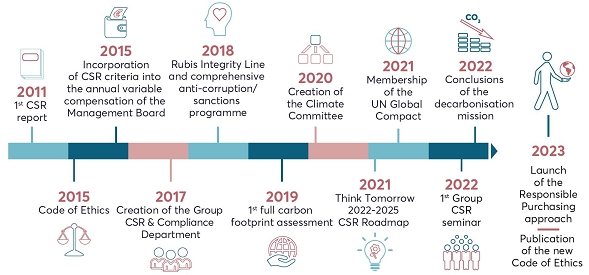
Since 2011, the year in which Rubis issued its first CSR report, the Group has been committed to a continuous improvement process in its approach to CSR.


2022 HIGHLIGHTS

2022 was an opportunity for the Rubis Group to consolidate the implementation of its new CSR approach. Initiated in 2021, with the publication of the CSR Roadmap Think Tomorrow 2022-2025, the Group actively continued to roll out its commitments, in particular with:

•   the acceleration of investments in renewable energies, with the completion of the acquisition of an 80% stake in Photosol;

•   the conclusions of the assessment mission on the decarbonisation of activities, making it possible to identify operational actions to achieve the climate strategy defined in 2021;;

•   continued strengthening of teams to accelerate the implementation of the CSR approach;

•   the launch of a biodiversity project, with the initial assessment of the biodiversity footprint of the main Rubis Énergie business units;

•   the organisation of a CSR seminar bringing together nearly 80 participants over three days, in particular all of the CSR Advisors as well as the General Managers of the subsidiaries;

•   the preparation of a human rights risk mapping.

THE CSR ROADMAP, THINK TOMORROW 2022-2025

In September 2021, the Group published its first CSR Roadmap, Think Tomorrow 2022-2025.

With this roadmap, Rubis is bolstering and steering its CSR strategy in line with the United Nations’ Sustainable Development Goals (SDGs). It is built around three areas broken down into nine commitments presented in the NFIS risk table in section 4.1.2.2 of this chapter:

•   pillar 1: reducing our environmental footprint;

•   pillar 2: providing a safe and stimulating working environment;

•   pillar 3: contributing to a more virtuous society.

These commitments are combined with 19 objectives and indicators, such as:

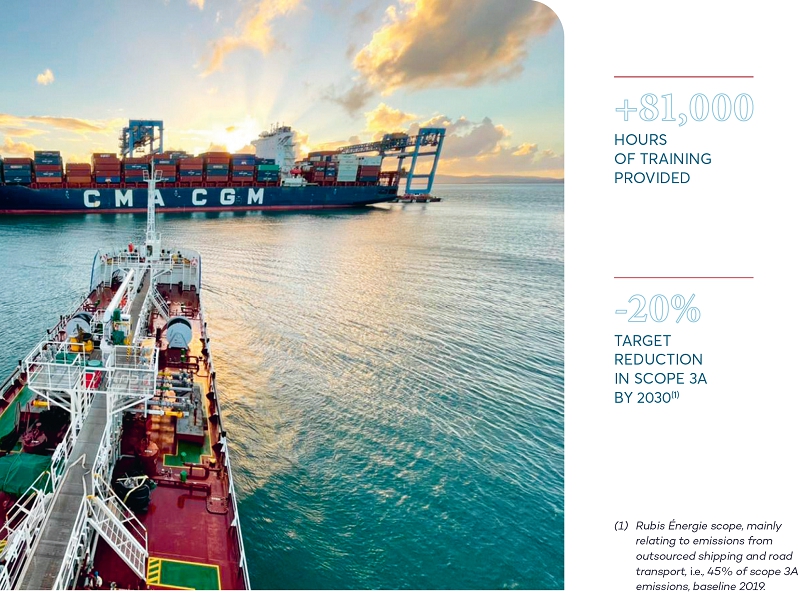
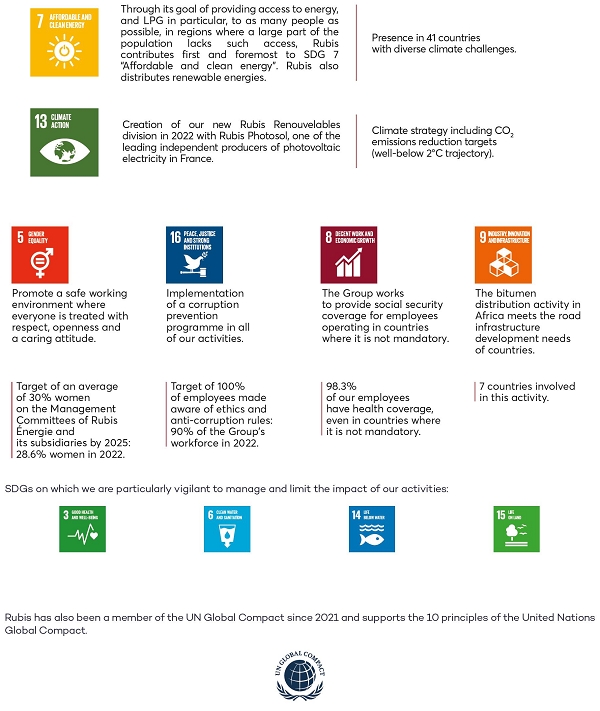
•   reducing CO2 emissions resulting from operations: -30% by 2030 (2019 baseline) in scopes 1 and 2 (Rubis Énergie scope), an objective that was revised upwards compared to the objective communicated previously (-20% initially announced in June 2021, same scope). An additional target of a 20% reduction in scope 3A CO2 emissions by 2030 (2019 baseline) (Rubis Énergie scope, mainly outsourced maritime and road transport items, i.e., 45% of scope 3A) was defined in 2022;

•   reducing the number of accidental spills in excess of 200 litres of products with an impact on the environment (number of spills in 2025 < than that of 2020, i.e., 20);

•   continuously reducing occupational accidents with lost time for employees and service providers at our facilities: until 2025, frequency rate < 4.5 for employees, and number of accidents with lost time decreasing for service providers and achieving the objective of “zero fatal accidents” each year;

•   increasing the number of women in senior management: 30% women on average in Management Committees by 2025;

•   raising awareness of employees about business integrity: 100% of employees to improve their awareness of ethics and anti-corruption rules in 2023.

Comprehensive information about this roadmap (which has been rolled out in the subsidiaries, which adapt the roadmap according to their local challenges) is available on our website at: https://www.rubis.fr/uploads/attachments/ Rubis_CSR%20roadmap_2022_2025-EN.pdf.

MONITORING OUR CSR PERFORMANCE

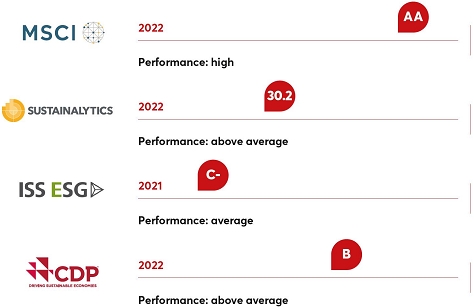
Rubis SCA wishes to continue its transparency efforts and to interact more proactively with non-financial rating agencies. In 2022, Rubis’ efforts were recognised by, in particular:

•   MSCI, which renewed Rubis’ AA rating;

•   CDP, which awarded Rubis a B rating on the Climate Change questionnaire.


OUR CONTRIBUTION TO THE SUSTAINABLE DEVELOPMENT GOALS (SDGS)

Rubis’ approach, as well as the associated objectives and actions, are in line with the 17 UN Sustainable Development Goals (SDGs), some of which relate more directly to the Group’s activities through their positive contributions:


4.1.2 The main CSR risks associated with the Group’s activities

In accordance with Articles L. 225-102-1 and R. 225-105 of the amended French Commercial Code, Rubis has conducted a three-stage analysis of its main non-financial risks (section 4.1.2.1), which identified 15 main risks grouped around five priority challenges (section 4.1.2.2).

4.1.2.1   A three-step risk analysis

RISK MAPPING ANALYSIS

Risk maps are prepared by the Group’s functional departments (CSR, HSE, Operations, Finance, Legal, etc.), and are completed locally by the operating subsidiaries. They are analysed on a consolidated basis and are then reported to Rubis SCA’s Managing Partners and presented to the Accounts and Risk Monitoring Committee. Risk mapping makes it possible to assess (impact and probability) the events that are likely to have a significant adverse impact on the Group’s business, financial situation, reputation or outlook, on a scale of 1 to 5. These risk maps are updated annually in view of changes in the Group’s business lines and operations and the observations made by employees, stakeholders and the Accounts and Risk Monitoring Committee (see chapter 3, section 3.2.3.2).This process is part of a co-building approach that aims to reach a shared assessment.

ANNUAL RISK MAPPING PROCESS


ANALYSIS OF SECTOR RISKS

In addition to analysing pre-existing risk maps, Rubis’ CSR teams use work carried out by other companies and trade organisations to verify the consistency of the risk items identified in their risk mapping and to add to the risk map if necessary.

Existing frameworks (the SASB Materiality Map® in particular), sector benchmarks (IPIECA) or those of trade organisations/associations (Medef, ORSE, C3D) and CSR publications from other companies were used to assess the most material risks in view of the business segment. The concerns voiced by stakeholders (investors, ESG analysts, civil society) are tracked using a monitoring system put in place by the Group. The results make it possible to weight the risk analysis and account for the importance of these risks to its stakeholders and to identify weak signals and key challenges with respect to the principal areas the Group is expected to act on.

RUBIS’ MAJOR STAKEHOLDERS


Regular dialogue with communities

Committed to local populations, the Group values dialogue with its stakeholders and promotes dynamic activity in the regions where it operates, both on an economic and employment level and on the issue of “living as a community.”

Depending on the status or mission of these stakeholders, dialogue with stakeholders takes place at the local level (subsidiary), at the level of entire divisions or directly by the parent company (Rubis SCA) (see section 4.5.2.1).

Rubis is also committed through an active and targeted social engagement policy, via its artistic endowment fund Rubis Mécénat and its community investment with subsidiaries, mainly focused on education and health (see section 4.5.2.3).

MULTIDISCIPLINARY WORKING MEETINGS

The consolidated result of risk mapping revised in view of the benchmark described above was presented to HSE Managers (environmental and safety components) and to officers responsible for social issues (personal safety and HR) for review and validation from a non-financial perspective.This review was the subject of regular meetings and discussions with the Group CSR & Compliance Department.

The result of this risk analysis was approved by Rubis Énergie’s General Management and then by Rubis SCA’s Management Board and the Accounts and Risk Monitoring Committee.

The Rubis Terminal JV has followed the same risk assessment process, which was validated by its General Management. At this stage, the completion of the sale of 45% of the capital of the storage activity to an infrastructure fund in 2020 is unlikely to jeopardise the analysis of CSR risks relating to the joint venture, whose business remains unchanged. The periodic review of this analysis is now presented by the Rubis Terminal JV to its shareholders at meetings of its Board of Directors, which validates the objectives.

Rubis Photosol, which is outside the scope of the NFIS for financial year 2022 due to its joining the scope of the Group during the financial year, will formalise an analysis of its non-financial risks in 2023.

4.1.2.2   Fifteen risks grouped around five key challenges

The analysis of CSR risks highlights 15 main risks relating to the Retail & Marketing and Support & Services activities of Rubis Énergie, and the Rubis Terminal JV*. The Photovoltaic Electricity Production activity (Rubis Photosol) was integrated into Rubis during the financial year 2022. Given the specific nature of this activity requiring dedicated risk analyses and the implementation of related management measures, this activity is not therefore included in the scope of the NFIS for the financial year 2022. It will be included from financial year 2023.

These risks are grouped around the following five challenges:

•   limiting the environmental impact of activities;

•   protecting the health and safety of people working on site and of local residents, and facility security;

•   fighting against climate change;

•   attracting, developing and retaining talents;

•   business ethics demonstrated by operating responsibly and with integrity.

CHALLENGES   MAIN RISKS   MONITORING INDICATORS   MEANS AND OBJECTIVES   SCOPE   2022 RESULTS   2021 RESULTS   RUBIS CSR ROADMAP
COMMITMENTS(1)
Limiting our environmental impact   Water and soil pollution   Number of accidental spills reaching the environment > 200 litres   By 2025, reduce the number of accidental spills reaching the natural environment > 200 litres to less than 20 (2020 baseline)   Rubis Énergie   14   23   Reduce accidental product spills
      0 accidental leaks, excluding containment, in accordance with the GHS leak classification system(2)   Rubis Terminal JV   0   1    
  Emissions   Emissions from major industrial sites (NOx, VOC, SO2)   Vapour recovery devices; installation of floating screens on storage tanks   Rubis Énergie Rubis Terminal JV   NOx
Rubis Énergie (refining): 181 tonnes

Rubis Terminal JV –
Group share: 2.75 tonnes
  NOx
Rubis Énergie (refining): 125 tonnes

Rubis Terminal JV –
Group share: 5.8 tonnes
   
          VOC
Rubis Énergie (refi ning): 186 tonnes
Rubis Terminal JV –
Group share: 159.5 tonnes
  VOC
Rubis Énergie (refi ning): 205 tonnes
Rubis Terminal JV –
Group share: 148 tonnes
   
          SO2
Rubis Énergie (refining): 288 tonnes

Rubis Terminal JV: NA
  SO2
Rubis Énergie (refining): 62 tonnes

Rubis Terminal JV: NA
   
  Use of resources   Used/treated water  

Green Water project (Rubis Énergie): seawater desalination to significantly reduce freshwater consumption at the SARA refinery

Use of rainwater, wastewater treatment

  Rubis Énergie Rubis Terminal JV   Water used
Rubis Énergie (refining): 252,906 m3
Rubis Terminal JV –
Group share: 99,170 m3
  Water used
Rubis Énergie (refining): 150,104 m3
Rubis Terminal JV –
Group share: 169,604 m3
   
          Water treated
Rubis Énergie (refining): 88,319 m3
Rubis Terminal JV – Group share: 212,660 m3
  Water treated
Rubis Énergie (refining): 65,417 m3
Rubis Terminal JV –
Group share: 256,131 m3
   
    Operational safety   Number of major industrial accidents   “Zero major industrial accidents” target   Rubis Énergie Rubis Terminal JV   Rubis Énergie: 0
Rubis Terminal JV: 0
  Rubis Énergie: 0
Rubis Terminal JV: 0
   
Operating in a safe environment   Personal safety Health and safety at work   Frequency rate of accidents with lost time > 1 day declared (excluding commuting accidents) (employees)   Maintain a lost-time accident frequency rate <4.5 until 2025   Rubis Énergie   4.7   4   Reduce personal injury operating accidents with lost time
    Number of accidents with lost time > 1 day declared (service providers)   Maintain the number of accidents with lost time <32 until 2025 (2020 baseline)   Rubis Énergie   11   20  
    Change in Total Incident Rate (TIR)   Reduce employee TIR by 25% by 2025 (vs 2020)   Rubis Terminal JV   -3%   -5%   -
    Number of occupational accidents with lost time   Achieve 0 accidents with lost time   Rubis Terminal JV   13   8    
    Number of deaths following an occupational accident (excluding commuting accidents)   Achieve and maintain the objective of “zero fatal accidents” each year   Rubis Énergie   0   1 employee; 2 service providers   Zero fatal accidents
    Defensive driving training rate for drivers in the most exposed countries(3)   100% of drivers in the most exposed countries trained in 2023   Rubis Énergie   81% (91% of employee drivers and 78% of external drivers)   62% (76% of employee drivers and 59% of external drivers)   Raise awareness of traffic accidents in our activities
  Safety/health of customers and local residents   Percentage of industrial sites holding at least one certification (mainly ISO 9001, 14001 and 45001)   Maintain and renew our certifications   Rubis Énergie
Rubis Terminal JV
  Rubis Énergie: 32%
Rubis Terminal JV: 100%
  Rubis Énergie: 27%
Rubis Terminal JV: 100%
   
* As far as possible, the description of the risks relating to the Rubis Terminal JV is presented separately from the risks relating to the Retail & Marketing and Support & Services activities. However, for the sake of clarity for the reader and to limit duplication, as certain risks are similar and are subject to similar management measures, they are not presented in separate paragraphs.
CHALLENGES   MAIN RISKS   MONITORING INDICATORS   MEANS AND OBJECTIVES   SCOPE   2022 RESULTS   2021 RESULTS   RUBIS CSR ROADMAP
COMMITMENTS(1)
Fighting against climate change   GHG emissions   Greenhouse gas emissions  

Decarbonisation plan for operations (by 2030, target of -30% for scopes 1 and 2 (vs 2019, at constant scope))

  scopes 1 and 2 emissions

  activity carbon intensity indicator (scopes 1 and 2/EBITDA)

  Rubis Énergie   235 kt CO2 eq scope 1 9.8 kt CO2 eq scope 2 0.360   196 kt CO2 eq scope 1 10.9 kt CO2 eq scope 2 0.375   Reduce the carbon footprint of our industrial sites, vessels and trucks (scopes 1 and 2)
      By 2030, target of -20% of scope 3A (excluding products sold) (Rubis Énergie scope, mainly outsourced maritime and road transport items, i.e., 45% of scope 3A) (vs 2019) Scope 3A emissions   Rubis Énergie   225 kt CO2 eq scope 3A   183 kt CO2 eq scope 3A   Reduce the carbon footprint of our value chain
  Adaptation of activities   Percentage of business units that organised an energy efficiency awareness campaign among their customers   From 2022, each business unit will be required to organise at least one awareness-raising initiative per year   Rubis Énergie   48%   NA   Raise our customers’ awareness of energy efficiency
    Carbon intensity indicators for products sold   A target for reducing the carbon intensity of our products will be set in 2023(4)
Scope 3B emissions
  Rubis Énergie   13,034 kt CO2 eq scope 3B   12,867 kt CO2 eq scope 3B   Reduce the carbon intensity of our products and diversify our business lines
Attracting, developing and retaining talents   Diversity and equal opportunities   Percentage of women in governing bodies   By 2025, an average of 30% of Management Committee members to be women   Rubis Énergie   28.6%   27.4%   Strengthen the diversity of our teams
      Maintain a proportion of at least 30% of the least represented gender on the Group’s Management Committee   Rubis SCA   Gender parity   Gender parity  
      By 2030, 40% of the Executive Committee should be women   Rubis Terminal JV   25%   25%    
  Developing skills   Percentage of employees trained   100% of employees trained each year   Rubis Énergie   90.1%   82.4%   Support the development of our employees’ skills
      10% of employees trained in changes in our business lines (energy transition, CSR, etc.) each year to 2025   Rubis Énergie   28%   NA  
  Quality of life at work   Absenteeism rate for non-occupational illnesses   Maintain a social environment conducive to employee well-being and retention   Rubis Énergie Rubis Terminal JV   Rubis Énergie: 2.17%
Rubis Terminal JV: 7.1%
  Rubis Énergie: 1.81%
Rubis Terminal JV: 5.93%
  Be an attractive employer
  Employees’ involvement in the Group’s value creation   Percentage of employees receiving a pay rise during the year   Group social policy promoting employee commitment to work   Rubis Énergie Rubis Terminal JV   Rubis Énergie: 66.1%
Rubis Terminal JV: 50.6%
  Rubis Énergie: 50%
Rubis Terminal JV: 53.6%
   
Working responsibly and with integrity   Fighting corruption   Percentage of employees made aware of ethics and anti-corruption rules   100% of employees made aware in 2023   Rubis Énergie Rubis Terminal JV   Rubis Énergie: 88%
Rubis Terminal JV: 98%
  Rubis Énergie: 76%
Rubis Terminal JV: 77%
  Strengthen our employees’ understanding and adherence to our ethics rules and principles
  Responsible purchasing   Integration of CSR/ethics criteria   Launch of a responsible purchasing approach in 2023: mapping of high-risk purchases, action plan, responsible purchasing charter   Rubis Énergie   NA   NA   Ensure responsible management of our supply chain
  Regional, economic and social impact   Number of beneficiaries of community investment   Continuation of international social engagement policy   Group (Rubis SCA, Rubis Énergie and the Rubis Terminal JV)   Nearly 50,000 beneficiaries(5)   Nearly 200,000 beneficiaries   Contribute to local development and address global societal challenges
    Rate of business units implementing community investment that meets a local need   100% of business units in 2025   Group (Rubis SCA, Rubis Énergie and the Rubis Terminal JV)   67%   67%  
(1) CSR Roadmap Think Tomorrow 2022-2025, concerning the Rubis Énergie scope, since it was published, before the acquisition of Rubis Photosol finalised in April 2022. The Rubis Terminal JV, jointly controlled by Rubis SCA and its partner, has defined its own roadmap, the Mid Term Sustainability Roadmap 2022-2030.
(2) The accidents taken into account are classified according to the GHS (Globally Harmonised System for the Classification and Labelling of Chemicals).
(3) The countries in which the Group operates considered to be the most exposed to road safety risks are among the 100 countries identified by the WHO as having the highest number of accidents: https://www.who.int/data/gho/data/indicators/indicator-details/GHO/estimated-road-traffic-death-rate-(per-100-000-population).
(4) The Group planned to define a target for reducing the carbon intensity of products sold in 2022. Nevertheless, as the acquisition of Rubis Photosol led to a change in the product mix sold, through the integration of new activities, the definition of this objective was postponed.
(5) Excluding beneficiaries of the exceptional donation to the Fondation de France’s Ukraine Solidarity Fund. Change in the calculation method in 2022 vs 2021: the number of beneficiaries is calculated pro rata to the amounts paid to each association.

A RISK PREVENTION POLICY ADAPTED TO THE GROUP’S ACTIVITIES

Appropriate procedures are implemented to address the challenges identified in the risk analysis.

Health and safety risks for individuals working at the sites and for local residents, and the risks relating to the activities’ environmental impact are subject to enhanced preventive measures, which are carried out in the framework of regular inspection programmes and major capital expenditures (see section 4.2).

In line with the Group’s values, social risks are managed in a decentralised way to make the most of human capital and to take into account the specific nature of the Group’s activities. In addition to workplace health and safety, which as an industrial group are Rubis’ priorities, the issues of well-being at work, equal opportunities in the workplace and sharing the Group’s growth with employees are carefully monitored (see section 4.4).

Other challenges, such as ethics and corruption risks, are also subject to specific policies and procedures drawn up as part of the continuous improvement process (see section 4.5).

Details about the main risks relating to the Non-Financial Information Statement and on the related policies and indicators appear in sections 4.2 to 4.5 of this document. The main risks are identified using the following pictogram: / NFIS /. Other challenges, which were not identified as priority risks in the risk analysis but that are nevertheless considered as important for both the Group and its stakeholders or that must be disclosed in accordance with current regulations, are also included in sections 4.2 to 4.5.

The Rubis Terminal JV’s risk prevention policy, which has been in place for many years, was developed in line with Rubis Group standards. Now a co-shareholder of this joint venture, Rubis SCA, via its representatives on the joint venture’s Board of Directors, continues to promote the Group’s standards vis-à-vis the partner and to monitor the Rubis Terminal JV’s efforts and performance.

4.1.3 Comparability, reliability and control of social and environmental information

The comparability and reliability of information primarily results from the standardisation of methods used for reporting social and environmental data, as described in the methodology note (see section 4.6).

The reported information is checked using verification procedures and analyses. Internal audits relating to certain non-financial information (ethics, anti-corruption) are also carried out.

A cross-reference table listing the provisions of the French Commercial Code is provided in section 4.6.4 in order to facilitate the reading of this chapter.

4.2 Limitin our environmental impact and operating in a safe environment

Protecting people and the environment is everyone’s business and a priority for Rubis. As a committed and responsible company, the Group continuously works to protect its environment (section 4.2.2) and seeks to operate safely (section 4.2.3). To manage this approach to quality, health, safety and the environment, the Group has defined a general framework and a governance system has been implemented for each activity (section 4.2.1).

4.2.1 Our QHSE approach / NFIS /

4.2.1.1    General principles

A general framework for quality, health, safety and the environment (QHSE) has been defined in order to prevent risks and to limit the negative impacts of our activities.

The QHSE policy framework, which is referred to in the Group’s Code of Ethics, states that each employee must act responsibly when performing his/her duties, comply with the health, safety and environmental protection procedures on site, and pay particular attention to compliance with these rules by all parties (colleagues, suppliers, external service providers, etc.). This framework constitutes the common foundation for all the Group’s activities.

In order to account for the challenges and risks that are specific to Rubis Énergie’s activities and those of the Rubis Terminal JV, each of them has drawn up their own QHSE policy consistent with the Group’s general principles.

Concerning Rubis Photosol, the integration work will focus on potential adjustments to its QHSE policy during 2023 and the setting of an action plan and related objectives. These policies clarify the Group’s principles by transposing them into operational requirements. Dedicated governance has been set up for the implementation of these policies.

The main objective of these QHSE policies is to prevent risks in order to better protect physical and environmental integrity and to minimise the impacts of a major accident (see section 4.2.3). This is reflected in the implementation of the measures required to limit incidents as far as possible and thereby reduce the probability of a severe event occurring. In addition, the Group also strives to reduce its environmental footprint (see section 4.2.2).

4.2.1.2    Management system

OVERSEEING OF RISK MANAGEMENT

The implementation of QHSE policies is overseen by facility Managers who are assisted by Rubis Énergie’s and the Rubis Terminal JV’s industrial, technical and HSE Departments. At larger sites, quality and/or HSE engineers are also involved in this process. The General Managers of Rubis Énergie’s subsidiaries and their functional departments report on their HSE work at Management Committee meetings that are held within each division twice a year, in the presence of Rubis SCA’s Management Board. The Rubis Terminal JV’s management reports on the implementation of its HSE policy and its results to its Board of Directors, on which Rubis SCA has representatives.

Rubis Énergie (Retail & Marketing and Support & Services activities)

Rubis Énergie believes that it is essential to protect the health and safety of people and property located in or near its facilities. As such, Rubis Énergie has established a “Health, Safety and Environment (HSE) Charter”, which requires its affiliated companies to comply with HSE objectives that it considers to be fundamental (and which sometimes go beyond locally applicable regulations), and with the additional aim of heightening employee awareness about safety.

These general objectives are to be achieved through the following key measures:

•   disseminating Rubis Énergie’s fundamental HSE principles within its subsidiaries in order to create and strengthen HSE culture;

•   implementing sector-specific best business practices;

•   having document systems established in accordance with “quality” standards ensuring reliability and safety of operations;

•   regularly assessing technological risks;

•   enhancing preventive facility maintenance;

•   regularly inspecting facilities and processes (transport activities included) and addressing any identified deficiencies;

•   analysing all incidents and proposing to all subsidiaries lessons learned documents on notable events in order to avoid their recurrence;

•   regularly training employees and raising awareness about technological risks.

Depending on the activity, the following actions are also taken:

•   taking care to analyse the state of facilities in light of specific Group standards and local regulations and, as necessary, scheduling work to bring them up to standard;

•   joining organisations or associations (GESIP, JIG, IATA, Oil Spill Response Ltd, WLPGA, Eurobitume, Energy Institute) in order to share feedback and implement the best practices of the profession, as well as to benefit from specialised expertise for operations or in the event of an incident (see details in section 4.2.2.1) and maritime pollution liable to occur during loading/unloading operations in Rubis Énergie’s depots.

Rubis Terminal JV (Storage activity)

The Management of the Rubis Terminal JV has rolled out the shared cultural values, including the principles of the “Always safe” safety culture, to all its subsidiaries and joint ventures.

Its three fundamental principles are:

•   “safety is in our DNA”, the integration of safety as a priority at all levels of the Company;

•   “prevention culture”, openly share knowledge and experiences in order to improve prevention and integrate it upstream of design and operations;

•   “proactive attitude”, reflect and analyse in order to act before an event occurs by having a positive, honest and transparent attitude to help each other detect dangerous situations and correct them quickly.

The Rubis Terminal JV considers that protecting health and safety contributes to the Company’s success and should therefore never be neglected, and that action must be taken upstream to avoid accidents and occupational illness. The Management of each Rubis Terminal JV industrial site has the obligation to ensure that regular audits assessing compliance with safety principles and standards take place. Performance indicators have been put in place in order to trigger and monitor a continuous improvement process with respect to health and safety.

The Rubis Terminal JV’s General Management and that of each facility make an annual commitment to employees, customers, suppliers, governments and local residents, pledging to apply a QHSE policy incorporating safety improvement targets specific to each site. Managers also agree to adhere to recognised international QHSE standards, which are set out below.

Finally, the Rubis Terminal JV has committed to a multi-year quantified programme for reducing its energy consumption and its CO2 and atmospheric emissions through the internal distribution of a document entitled “Group objectives for environmental impacts and energy consumption” to limit its environmental footprint.

Following its materiality analysis carried out in 2022, a roadmap “Rubis Terminal Infra Sustainability Mid Term Roadmap 2022-2030” was drawn up with medium-term commitments and was validated by its Board of Directors.

This document, built on the principle of the 3Ps (People, Planet, Prosperity), taking into account the materiality of its activity on its environment, details objectives in terms of reducing greenhouse gas emissions, and monitoring sustainable and safe operational methods, while mitigating its impact on the environment. In addition, the environmental policies of the Rubis Terminal JV define the monitoring and improvements of energy and water consumption and waste management, the results of which are presented in the corresponding sections of this chapter (section 4.3.4.3 for the carbon intensity of the activity, section 4.2.2.3.1 for water consumption and section 4.2.2.3.2 for waste management).

The following actions are also implemented:

•   monitoring of programmes such as HACCP or GMP+ (see table below), under which the Rubis Terminal JV has committed to complying with the sector’s regulatory provisions and professional recommendations for its various activities, comparing its practices with best industrial practices and to constantly seek to improve its performance in the areas of safety, health and environmental protection;

•   regarding the chemical product storage depots, joining the Chemical Distribution Institute – Terminals (CDI-T), a non-profit foundation working to improve safety at industrial sites in the chemicals industry.

Site certification

Certain operated sites are certified, particularly those classified as Seveso.

  Some of Rubis Énergie’s distribution or industrial activities (Vitogaz France, Sigalnor, SARA, Lasfargaz, Rubis Energia Portugal, Vitogaz Switzerland, Rubis Energy Kenya, Vitogas España and Easigas) are ISO 9001-certified (quality management system), as are all of the Rubis Terminal JV’s depots.
  The activities of SARA (refinery), Vitogaz Switzerland, Vitogas España and Rubis Energia Portugal (Retail & Marketing) are ISO 14001-certified (environmental management system), as are all of the Rubis Terminal JV depots with a chemical product storage activity. This standard provides a framework for controlling environmental impacts and seeks to ensure the continuous improvement of its environmental performance.
  The activities of Vitogaz Switzerland and the Rubis Terminal JV’s Spanish depots are certified ISO 45001, while the activities of Rubis Energia Portugal and the Rubis Terminal JV’s Spanish depots are OHSAS 1800-certified (occupational health and safety management)
  For the Rubis Terminal JV’s chemical product depots, the Chemical Distribution Institute – Terminals (CDI-T) is in charge of inspections and audits of the transport and storage elements of the global chemical product supply chain.
  The Rubis Terminal JV’s Dunkirk site has a continuous risk management approach regarding the storage of foodstuffs. Employees are trained in best practices through the analysis of food risks. They apply the principles of this approach, known as HACCP, and know how to meet the particular needs of the food sector, such as product traceability throughout the logistics chain. Moreover, the terminal has declared that it stores products used for animal feed. This has been registered with the DDPP (Direction départementale de la protection des populations – Regional Directorate for the Protection of Populations). Finally, this site is preparing to obtain GMP+B3 certification for the transhipment and bulk storage of liquids used for animal feed.
  Vitogaz France has held NF Service Relation Client (NF345) certification since 2015. It was the first French company to obtain certification under the new version 8, in December 2018.
Revised in 2018, NF Service Relation Client certification is based on international standards ISO 18295- 1 & 2. A guide to best practices in customer relationship management, it takes customer expectations into account and aims to guarantee constant improvements to service quality. For Vitogaz France, this approach to seeking excellence in customer experience aims at establishing a long-lasting commercial relationship, delivering quality service over time, ensuring that transmitted information is exhaustive and clear, and acting promptly in accordance with its commitments.
  The Spanish depots of the Rubis Terminal JV, as well as the Rotterdam and Dunkirk terminals, are certified ISCC, and ISCC+ for Dunkirk. This certification indicates that traceability is ensured from the collection of raw materials (from biomass or waste and residues) to the transformation process, in accordance with this international sustainability standard applicable to all sectors.

32% of Rubis Énergie’s industrial sites (Retail & Marketing and Support & Services activities) have at least one certification (ISO 9001, 14001 and 45001).

100% of the Rubis Terminal JV’s industrial sites have at least one certification.

4.2.2 Limiting our environmental impact

The risks to the environment stemming from Group activities are monitored and managed very closely.

ACTIVITIES WITH SPECIFIC ENVIRONMENTAL IMPACTS

Rubis’ business lines are organised around three activities: Retail & Marketing, Support & Services, and Photovoltaic Electricity Production (the latter being outside the scope of the NFIS for the financial year 2022), as well as a Bulk Liquid Storage activity on behalf of a diversified industrial customer base, operated by the Rubis Terminal JV. These activities present industrial risks that, depending on the activities and the nature of the products being handled (fuels, biofuels, liquefied gas, bitumen, chemical and agrifood products and solar electricity), may have environmental impacts of varying nature and scale. These risks are described in each part of this section.

The environmental impact of Rubis Énergie’s Retail & Marketing activities stems mainly from the risks of accidental spills or the leakage of products from various Group sites (storage depots, service stations, filling plants for LPG cylinders, customer facilities, aviation or marine refuelling facilities) that are generally limited in size.

The environmental impact of Rubis Énergie’s Support & Services activity stems mainly from the Group’s sole refinery in the French Antilles (SARA) due to its industrial processing activities, and from its shipping business.

The environmental impact of the Rubis Terminal JV’s Storage activity results from the large size of the depots (and therefore the quantity of products being stored and transferred) and the nature of some of the products being handled, which require energy-intense facilities (boilers, for example).

MEASURES LIMITING THE GROUP’S ENVIRONMENTAL IMPACT

This chapter details the preventive measures put in place and key monitoring data for the following priority environmental risks, identified by means of pictogram / NFIS /:

•   preventing water and soil pollution that may be caused by accidental product spillages (section 4.2.2.1);

•   assessing and limiting atmospheric emissions from industrial activities (section 4.2.2.2);

•   optimising the use of resources by conserving water resources (section 4.2.2.3.1).

Another risk the Group does not consider to be a priority in terms of its activities but that is significant nevertheless is that of waste management (section 4.2.2.3.2).

The Group’s climate strategy and all the actions it implements to reduce the environmental impact of its activities, also aim to protect biodiversity (section 4.2.2.4).

4.2.2.1 Water and soil pollution / NFIS /


The risks of water and soil contamination related to the Group’s operations result mainly from accidental spillages of stored and/or transported products, which at some sites may result from activities that predate the Group’s presence at the site. In general, the entities are gradually investing in the sites to improve the safety of their facilities and to eliminate pollution risks to every possible extent.

RUBIS ÉNERGIE

Retail & Marketing activity

Risks

The petroleum products distribution business is liable to generate risks of water and soil contamination resulting from accidental spills, tank overflows, spreading, tank and/ or pipe leaks, and wastewater discharges (at fuel depots, service stations, and customer facilities). Road transport of products, which is necessary to supplying distribution sites and customers (fuel, bitumen) is also liable to result in accidental spills.

Measures to prevent and contain pollution

Tanks containing hazardous products and associated pipework undergo systematic inspections at storage sites in accordance with international standards during regular mandatory on-site visits, generally once every 10 years. Moreover, to prevent groundwater and soil pollution in the event of accidental spillage, storage tanks are often installed in watertight retention basins. These basins are kept shut. They are only opened for manual emptying after checks have been performed confirming the absence of pollutants. In the loading/unloading zones at storage sites for tank trucks, the retention platforms are purpose-designed for each type of product being handled and, as a general rule, are connected to oil-water separators connected to treatment plants or buffer basins. Water discharged into the environment after treatment is analysed quarterly.

Equipment used at Rubis Énergie service stations that is liable to generate soil pollution (mainly tanks and piping) is checked periodically (particularly in respect of the absence of defects and water-tightness) and is gradually being replaced by double-wall technology. This includes double-walled underground tanks and pipes that are equipped with leak detectors which provide continuous oversight to guard against any possible pollution. The medium-term (2030) objective is to replace single-walled tanks that are over 30 years old.The regions most affected by this measure are the Bahamas, Jamaica, the West Indies, Haiti and East Africa. As an example, the tanks at seven service stations, i.e., approximately 25 tanks, were replaced in the Caribbean region in 2022, representing an overall investment of approximately US$5 million.

In parallel, Rubis Énergie is reinforcing its preventive maintenance programmes for this equipment (see section 4.2.3.1) and is continuously improving the safety/ environmental training of service station managers, notably to ensure that they have the resources available to immediately detect any loss of product due to defective equipment/practices or fraud.

Rainwater that may have been polluted through contact with roadways is increasingly being treated before being discharged into the environment; service stations requiring them are equipped with rainwater collection and treatment systems whenever road repair work is planned.

Regarding the road haulage of petroleum products, in addition to the application of the regulations applicable to the transport of hazardous materials, additional measures are taken to prevent the risk of traffic accidents. Courses in defensive driving have been introduced in countries where this risk is heightened due to driving habits, distances driven or poor road infrastructure quality.

Moreover the cleaning of gas cylinders takes place in a closed circuit, which limits water consumption and the risk of wastewater contamination.

Support & Services activity

Risks

The Support & Services business (refining and shipping) could give rise to water and soil pollution in the event of accidental spillage or leaks and through the use of wastewater (desalination water, stripping treatments, tank draining), bulk tank drain water and ballast wastewater.

Moreover, the shipping activity can generate risks of water pollution during vessel loading/unloading operations or in the event of a shipping accident.

Measures to prevent and contain pollution

For vessel chartering, Rubis Énergie calls on the services of a specialised company that systematically vets the vessels in question. This company collects information about the vessel’s condition (construction date, maintenance, etc.) and the operator’s quality (crew reliability, etc.). It then submits a recommendation on the risks of using the vessel that the teams rely on before signing the charter agreement.

Rubis Énergie has also taken preventive measures to address maritime pollution at its terminals during product loading/unloading operations.

Results

Water pollution

    Suspended solids released into water*   Petroleum products released into water
(in kg)   2022   2021   2020   2022   2021   2020
Refining (Support & Services)   2,390   1,884   2,120   71   159   277
Retail & Marketing   Not available   Not available   Not available   Not available   Not available   Not available
* Suspended solids released into water: see definition in section 4.6.3.

In the refinery, the commissioning of a new lamellar separator in early 2019 made it possible to significantly reduce the amount of suspended solids and petroleum products in wastewater. Without calling into question the improved performance achieved following this investment, it must be emphasised that the sharp reduction in discharges observed in 2020 is attributable to shutdowns of production units due to two major scheduled shutdowns for periodic facility maintenance. The overall decrease in flows of pollutants at the refinery in 2021 and 2022 can be explained by improved performance in residual water treatment and a lower intake of process water resulting from the manner in which the facilities operate.

Soil pollution

In accordance with professional practices, Rubis Énergie monitors accidental spillages of liquid petroleum products with a unit volume of more than 200 litres. In 2022, the subsidiaries recorded 14 incidents (mainly due to facility leaks, traffic accidents or non-compliance with operating procedures).This decrease compared to 2021 (23 incidents reported) is the result of better awareness-raising among local teams and actions to upgrade HSE standards.

Any significant spill must be followed by remedial action aimed at returning the environment to its initial state as quickly as possible.

Rubis Terminal JV

Risks

The Storage activity can generate accidental pollution of water and soil, in particular by overflows from secondary retention tanks surrounding tanks, piping or transfer stations located on the sites, by leaks from pipes outside the sites, as well as discharges into wastewater.

Measures to prevent and contain pollution

At storage sites and transport pipelines in the public sector, a preventive maintenance programme is in place for all tanks and equipment containing hazardous products. The systematic inspection of tanks containing hazardous products and their associated pipes is carried out in accordance with international standards, during various periodic visits. Moreover, to prevent groundwater and soil pollution in the event of accidental spreading, storage tanks are (with some exceptions) installed in watertight retention basins (lined with concrete or clay compounds). These basins are kept shut.They are opened manually after checks have been performed confirming the absence of pollutants.

In the loading/unloading zones for tank trucks, railway tanker wagons and at each wharf for vessels and barges carrying hazardous products, the retention platforms are purpose-designed for each type of product handled and, as a general rule, are connected to oil-water separators connected to treatment plants or buffer basins. Water is tested at discharge points at least every half-year, and monthly at the outflows from treatment plants. Weekly or monthly checks are carried out on nearly all sites to verify that there is no floating pollution in the groundwater monitoring wells located downstream of facilities.

Results

Water pollution

    Suspended solids released into water*   Petroleum products released into water
(in kg)   2022   2021   2020   2022   2021   2020
Rubis Terminal JV   4,296   4,672   3,843   384   274   366
•  of which Group share   2,363   2,570   2,114   211   151   201
* Suspended solids released into water: see definition in section 4.6.3.

The volume of suspended solids discharged into the water is very low compared to the volume of water discharged (over 380,000 m3). The change between 2021 and 2022 is small.

Soil pollution

The incidents of reported soil pollution by hazardous products correspond to pollution where volumes are greater than 200 litres occurring during the year. In 2022, no incidents were reported.

4.2.2.2   Emissions from industrial activity / NFIS /

With the exception of refining in the French Antilles, Rubis Énergie’s activities are not classified as industrial transformation processes. Due to their size, the Rubis Terminal JV’s storage sites are the other significant source of atmospheric pollutants within the Group. The Group is committed to implementing a policy to limit these emissions.

To this end, the various sources of pollutant emissions are being evaluated progressively. The carbon footprint assessment is published in section 4.3.4 relating to climate change.

RUBIS ÉNERGIE

Retail & Marketing activity

Risks

The petroleum products distribution business generates VOC (volatile organic compounds) emissions; however, these emissions remain relatively low.

In liquefied gas distribution, VOC emissions are generated by connection/disconnection operations when filling cylinders and trucks and when degassing cylinders for technical inspections. Other VOCs are made up of the solvents contained in paints used for cylinders.

Regarding automotive fuel distribution, storage and distribution facilities generate VOC emissions from petrol. These emissions are particularly low due to measures taken to collect petrol fumes, as described below.

The Retail & Marketing activity does not emit significant volumes of NOx.

Limitation measures

In fuel depots, particularly those equipped with source loading stations, petrol vapours are collected during tank truck loading; in France, where regulations have required it for several years, these vapours are treated in vapour recovery units (VRUs) that condense them before returning them to the storage tanks. In addition, top loading stations are gradually being replaced by source loading stations, and petrol storage tanks are increasingly being equipped with floating screens that considerably limit the release of vapours into the atmosphere during the storage phase.

In service stations, vapours emitted during reception and delivery to customers are gradually being recovered, especially in France where regulations have required this for several years.

Support & Services activity

Risks

The refining activity generates atmospheric emissions into the air due to its industrial transformation processes. The main emission sources are furnaces, combustion turbines, boilers and flares.

Shipping generates SO2 emissions due to the fuels consumed by vessels. However, these emissions have been much lower since the 1st January 2020 entry into force of the Low Sulphur regulation implemented by the International Maritime Organization (IMO 2020), which limits the maximum sulphur content of marine fuels to 0.5% (compared to 3.5% previously).

Limitation measures

The continuous monitoring of the refinery’s atmospheric emissions is strengthened by the commissioning of dust and carbon monoxide analysers in the two units generating the highest emissions. As described in the section on Retail & Marketing activities above, measures to collect petrol vapours have also been implemented.

Each year, a refinery smoke control campaign is carried out by an authorised body to validate the results of its self-monitoring.

Regarding the shipping activity, various solutions have been implemented in order to comply with the International Maritime Organization’s Low Sulphur regulation:

•   Rubis Énergie has fitted one of its eight directly owned vessels (as of 31 December 2022) with a scrubber. This scrubber captures sulphur emissions by washing exhaust fumes. These chimney evacuation filters treat exhaust gas, eliminating up to 90% of sulphur dioxide (SO2) and fine particles;

•   the seven other directly owned vessels, as well as those operated on a time-charter basis by Rubis Énergie, now use low-sulphur fuel oil (0.5% maximum).The availability of this low-sulphur fuel oil in the three activity zones (Caribbean, Europe and Africa) is very satisfactory.

Understanding air pollutants and greenhouse gases

Human activities (transport, accommodation, industry, agriculture) are sources of greenhouse gas emissions and air pollutants. Although they are closely linked and some measures thus aim to reduce both air pollutants and greenhouse gases (for example, improved efficiency of heating systems at the storage sites and optimisation of distances covered by delivery trucks), they should not be confused with one another.

•   Made up of toxic gases or harmful particles, air pollutants have a direct and generally local effect on health and the environment when they exceed certain thresholds. Over and above human activities, they can also come from natural sources, such as volcanoes (sulphur dioxide). Due to their negative impacts, the release of these air pollutants resulting from human activities is supervised and monitored. Air pollutant emissions measured in the Rubis Storage and Support & Services activities concern:

•  nitrogen oxides (NOx), which are formed in particular during fossil fuel combustion;

•  sulphur dioxide (SO2), which arises from several industrial processes and the consumption of fossil fuels containing sulphur;

•  volatile organic compounds (VOC), including benzene, which is found in paint and automotive fuel in particular.

•   Greenhouse gases occur naturally in the atmosphere and play a vital role in regulating and maintaining the Earth’s average temperature (natural greenhouse effect). Contrary to air pollutants, greenhouse gases have little direct effects on health. However, an excess of greenhouse gases released by human activities is largely responsible for global warming (the so-called additional greenhouse effect).

The greenhouse gas released by Rubis’ activities is carbon dioxide (CO2), which is measured (carbon footprint assessment) and subject to reduction measures (see section 4.3.4).

Results

  NOx emissions VOC emissions SO2 emissions
(in tonnes) 2022 2021 2020 2022 2021 2020 2022 2021 2020
Refining
(Support & Services)
181 125 185 186 205 182 288 62 240

In 2020 and 2021, atmospheric emissions from refining activities decreased due to the shutdowns of production units resulting from two major scheduled shutdowns for periodic facility maintenance.

RUBIS TERMINAL JV

Risks

The storage activity releases VOCs (volatile organic compounds) from the surface of the stored products which, in accordance with their physico-chemical properties, may vaporise, depending on the storage and handling conditions.

Limitation measures

Collection of petrol vapour in the Rubis Terminal JV’s fuel distribution terminals

These vapours are recovered when tank trucks discharge their loads and are piped to vapour recovery units (VRU), where they are condensed into liquid fuel before being reinjected into the storage tanks.

In addition, fuel storage tanks are equipped with floating screens, and loading is performed via source loading stations that make it possible to minimise VOC discharges into the atmosphere. At chemical product storage sites, toxic product vapours are collected. In addition, any chemical vapours, including VOCs, in the Antwerp and Rotterdam depots are collected and treated.

These two sites were designed from the start to collect and treat all vapours, including VOCs, found above liquids and pushed out of tanks during transfers.

Reduction of energy consumption in storage terminals

As the energy consumed by the storage terminals is derived from the same source as the energy generating CO2 (pumps and boilers), the actions taken by the Rubis Terminal JV to reduce energy consumption at sites, in terms of both existing and new heating systems, are described below (section 4.2.3.2).

Results

   NOx emissions  VOC emissions
(in tonnes)   2022   2021   2020   2022   2021   2020
Rubis Terminal JV  4.9  10.5  11  290  269  311
  of which Group share  2.8  5.8  6.1  159.5  148  171

In the storage sites, the low values calculated once again show a very limited NOx impact from this activity in 2022, with a decrease partly due to changes in scope vs the previous year (4.5 tonnes).

In terminals where boilers are installed, i.e., chemical and mixed terminals, NOx emissions are declining due to the start-up of gas boilers in Strasbourg and Rouen to replace heavy oil-fired boilers.

Concerning VOCs, the reduction of more than 13% recorded in 2021 reflected the full-year operation of a more efficient vapour recovery unit treatment system for petrol emissions at the Rouen site. There was an increase of 7.8% in 2022, which is explained by a structural increase in petrol activities at the terminals of 21% in France over the same period.

SO2 are not measured by the Rubis Terminal JV because the fuels used are either gas or standard low-SO2 liquid fuels (mandatory in the EU countries where the terminals are located).

4.2.2.3 Use of resources

In line with principles of the good governance of its activities, Rubis makes optimum use of the natural resources needed by its value chain, which is a key component of its corporate responsibility (section 4.2.2.3.1). Moreover, although the Group produces little waste, it ensures that the quantities of waste are limited and that waste is recycled (section 4.2.2.3.2).

4.2.2.3.1 PRESERVATION OF WATER RESOURCES / NFIS /

Risks

The Retail & Marketing activity does not require recurrent and significant use of water for industrial processes. Water is consumed in only very limited quantities for fire drills and periodic storage tank requalification and for cleaning and the requalification of LPG cylinders at cylinder filling plants.

The Support & Services activity (refining) consumes water mainly through its industrial transformation processes (boilers, etc.) and for its facilities’ fire-fighting systems.

Water consumption of Rubis Terminal JV mainly comes from fire drills carried out to test the effectiveness of the systems in place, the needs for the dosing of liquid fertilisers and urea-based solutions for the reduction of NOx from diesel engines. This usual consumption is increased by occasional water requirements for hydraulic testing (resistance tests) for new tanks.

Measures to reduce water consumption

In the activities with the highest level of consumption (refining and the Rubis Terminal JV), significant efforts are made to reduce the net consumption of freshwater:

•   the use of rainwater for refilling fire reservoirs and for dosing fertiliser. The facilities concerned have dedicated collection tanks;

•   treating wastewater enables the Rubis Terminal JV storage sites to report a higher volume of treated wastewater than the volume of freshwater used, as rainwater collected on sealed surfaces is also treated. In the refinery, all process water is collected and treated before being discharged into a modern residual water treatment unit. Systematic sampling and regular analyses make it possible to check that the water discharged after the various treatment stages complies with regulatory standards;

•   an investment project for industrial water production facilities at the refinery through the desalination of sea water (based on the principle of reverse osmosis) will significantly reduce the net consumption of freshwater. This project, called Green Water, commissioned in 2022, should make it possible to cover all the refinery’s industrial water requirements (capacity of 30 m3/h for demineralisation lines and 5 m3/h for service water requirements). Ultimately, it should enable the refinery’s city water consumption to be reduced by 80%. Domestic water (sanitary, kitchen) will continue to be supplied through the drinking water network.

Results

   Water used*     Water treated*     
(in m3)  2022  2021  2020  2022  2021  2020  
Refining (Support & Services)   252,906   150,104   174,014   88,319   65,417   92,209  
Rubis Terminal JV  180,309  308,370  305,640  386,655  465,692  471,056  
  of which Group share  99,170  169,604  168,102  212,660  256,131  259,081  
* Used and/or treated water can be either standing (reservoirs or lakes) or flowing water (rivers) above ground, sea water, groundwater or water from the distribution network supplying the site. Discharged water is extracted water, as well as rainwater, which explains the higher volume of water treated than water used for the Rubis Terminal JV.

Water consumption related to the refinery remained below the regulatory threshold prescribed in the prefectural order authorising the operation of the refinery.

Since 2018, the Rubis Terminal JV’s water consumption has been optimised. The ending of significant water table abstraction, which was designed to protect groundwater against surface pollution following the clean-up of a large site, made it possible to reduce water consumption by 98% since 2013.

On a like-for-like basis, the 8% increase in treated water corresponds to a high level of rainfall in France, not recorded since 1959. The 30% reduction in water used corresponds to a year with less commissioning of new tanks than the previous year, generating less water consumption associated with hydraulic tests.

4.2.2.3.2 WASTE MANAGEMENT

Given their respective business lines, the Group’s activities generate little hazardous waste and, therefore, there is no significant risk in this regard. The main sources of waste generation are storage and refining activities. In order to minimise its impact, to the extent possible, the Group limits the quantity of waste generated and recycles such waste. Subsidiaries ensure that residual waste that cannot be recycled is treated as required by applicable standards.

Analysis by activity

The Retail & Marketing activity generates virtually no hazardous waste, other than in the storage activity. The only hazardous waste produced is mainly made up of residues and sludge, which are treated as required by locally applicable standards, as outlined below in respect of the storage activity.

The Support & Services activity (refining only) produces hazardous waste, mainly petroleum product residues and sludge (which are recovered when waste water from tanks and/or separators is treated during maintenance work) and chemical products.

The Rubis Terminal JV (provision of bulk liquid storage capacity) generates three types of hazardous waste (construction and demolition waste are not taken into account):

•   waste generated by the subsidiaries’ regular activity, particularly following maintenance and inspection, which is mainly comprised of residues and sludge removed when tanks (and/or separators) are cleaned during maintenance operations or when switching between products. Like all other waste, residue and sludge removal is systematically registered, declared and sent to authorised recycling or destruction plants. Residue and sludge with combustion power are usually sent to authorised thermal recovery centres;

•   goods not delivered to customers, which can sometimes only be removed from sites as “hazardous waste” from an administrative point of view;

•   waste from clean-up work, particularly from certain recently acquired sites that contain legacy pollution that predates Rubis Terminal JV’s arrival.


Measures to limit and recycle waste

Innovative procedures and tools have been implemented to limit the production of both hazardous and non-hazardous waste. To this end, the entities are continuing their efforts to increase the number of sites using thermal recycling networks, when such treatment facilities are available nearby.

A continuous inventory of hazardous materials and substances is regularly reported to the local authorities (in the European Union). A register is kept available for inspection by the Regional Directorates of Environment, Planning and Housing (DREALs) at each French site.

The Rubis Énergie refinery and the Rubis Terminal JV have also established a system of systematic sorting of non-hazardous industrial waste, which corresponds to all waste that is neither hazardous nor inert.

This sorting is performed through the use of suitable and appropriately positioned containers on each site.

Results

   Volumes of hazardous waste  Waste recovery rate  
(in tonnes)  2022  2021  2020  2022  2021  2020  
Refining (Support & Services)  69  144  255  94%  73%  59%  
Rubis Terminal JV  2,964  3,032  2,314  51%  38%  22%  
  of which Group share  1,630  1,668  1,273  NA  NA  NA  

In 2021 and 2022, volumes of reported hazardous waste related to the refining activity were down significantly compared to 2020. This significant change is mainly attributable to the fact that a significant volume of chemical products had to be destroyed in 2020 in the context of the dismantling of the Sulférox 17 unit, which had also generated 400 tonnes of non-hazardous waste (concrete, waterproofing, stainless steel, ferrous metals). Waste recycling consists of reusing petroleum sludge and other waste soiled by petroleum products as fuel or another energy source. Oils are regenerated for reuse. Metals and metallic compounds are recycled or recovered.

The production of waste classified as hazardous at the Rubis Terminal JV sites was stable at constant scope. The significant increase in the waste recovery rate is explained by an additional management effort made on several sites, as well as by an exceptional event: the washing of several molasses tanks at the Rouen site, from which the waste at the bottom of the tanks was able to be fully recovered.

Plastic Odyssey: a round-the-world expedition to fight plastic pollution

Rubis Énergie supports and sponsors the Plastic Odyssey project, which is sailing around the world on a ship that is an ambassador for solutions to fight plastic pollution at sea.

The objectives of this expedition are to:

raise awareness of plastic waste reduction and waste recycling, particularly in emerging countries;

circulate know-how and technologies throughout the world;

produce conferences, films and photo reports during the expedition.

Plastic Odyssey has developed open source, low-cost plastic recycling technologies to treat waste generated on land before it ends up at sea. The aim of these machines is to economically develop the plastic waste treatment sector: to create jobs while fighting against pollution at the source.

In order to test these solutions and share them in the countries most affected by pollution, these machines have been taken aboard the MV Plastic Odyssey, a 40-metre former oceanographic research vessel, for a three-year expedition to Africa, South America and South-East Asia. This anti-pollution ambassador is promoting solutions to drastically reduce waste production and build a more sustainable future.

4.2.2.4 Biodiversity

In 2022, Rubis conducted a preliminary analysis of environmental risks from a biodiversity perspective within Rubis Énergie (Retail & Marketing and Support & Services). This specific study of the biodiversity challenges will enable it to fine tune its assessment in 2023 and define the priorities of its action plan to respond to them as well as any additional management measures.

This initial inventory was carried out on the basis of interviews with seven representatives of entities, followed by the sending of a questionnaire to each business unit. The Encore (Exploring Natural Capital Opportunities, Risks and Exposure) database developed by Natural Capital Finance Alliance in partnership with UNEP-WCMC (UN Environment Programme – World Conservation Monitoring Centre) was used to identify marine and land biodiversity hotspots as well as water-stressed areas located close to our sites. This approach has made it possible to raise both the operational teams’ awareness of biodiversity challenges and to identify the most exposed subsidiaries and sites in the Retail & Marketing and Support & Services activities.

In general, the Rubis Group’s main direct impacts on biodiversity are related to site operations and the shipping and ground transport necessary for the activities (atmospheric, soil and water emissions; energy consumption; noise and light pollution).

Some sites are located in areas that are more sensitive in terms of land or marine biodiversity or water stress.

The Group’s climate strategy and the actions it implements to reduce the environmental impact of its activities also aim to protect biodiversity.

For example, the SARA refinery, the entity that consumes the most water for its industrial transformation processes, is not located in an area of water stress. Nevertheless, it has implemented the Green Water project, enabling it to desalinate and demineralise seawater using reverse osmosis, and thus take less potable water from the public network so that the population can benefit from it. This water, once treated and resalinated to a level close to that of seawater, can then be discharged.

The SRPP (Réunion Island) has implemented measures to reduce the light pollution from its depot by reorienting the lighting to limit the dazzling of Mascarene petrels, an endemic species of critically endangered birds.

4.2.2.5 European Green Taxonomy

4.2.2.5.1 PRESENTATION OF THE MAIN PRINCIPLES OF THE TAXONOMY REGULATION

The European Green Taxonomy, provided for by the EU Taxonomy Regulation 2020/852 of 18 June 2020, is a system for classifying economic activities considered as environmentally sustainable by the European Commission on the basis of scientific criteria. This regulation is the result of the action plan for sustainable finance launched in 2018 by the European Commission in order to direct capital flows towards the activities that it has identified as priorities according to their ability to contribute to one of the following six environmental objectives (see diagram below). An activity is considered “eligible” when it is described in the corresponding delegated regulations (concerning the two climate objectives, in Annexes I and II of Delegated Regulation EU 2021/2139 of 4 June 2021 published on 9 December 2021).


An activity can contribute to both of the European Taxonomy’s climate objectives:

•   through its intrinsic performance (for the Rubis Group, for example, the production of electricity from renewable sources);

•   when it directly enables other sustainable activities. It is then qualified as an enabling activity; or

•   if it promotes the transition to a carbon neutral economy and cannot be replaced by technically and economically feasible low-carbon alternatives. It is then qualified as transitional. This is the case, for example, for transport activities.

Then, to be considered sustainable within the meaning of the taxonomy, an “eligible” activity must be “aligned”. To do this, it must be demonstrated that the said activity meets the requirements set out in Article 3 of the Taxonomy Regulation:

•   it makes a substantial contribution to one of the six environmental objectives, i.e., it meets the technical criteria specified in the delegated regulations;

•   it does not harm the other five environmental objectives (principle of Do No Significant Harm);

•   it complies with minimum safeguards.

In accordance with the Taxonomy Regulation and delegated regulations, three indicators based on the Group’s consolidated financial statements are published: the share of revenue, capital expenditure (“capex”) and operating expenditure (“opex”), together with economic activities considered, on the one hand, as eligible and, on the other hand, as aligned with the technical criteria of the taxonomy, concepts detailed in section 2 below.

For the second year of application of these provisions, non-financial companies must publish:

•   the share of their eligible and ineligible activities under the taxonomy for the three aforementioned indicators;

•   the share of their aligned and non-aligned activities under the taxonomy for the three aforementioned indicators;

•   the indicators relating to data for the financial year 2022.

In this context, a review of Rubis’ activities in the light of the European Green Taxonomy was carried out in order to determine the share of the Group’s activities eligible under the European Green Taxonomy. In accordance with the Taxonomy Regulation, the indicators to be published relate to consolidated financial data. Consequently, the storage activities of the Rubis Terminal JV, an equity associate in Rubis SCA’s financial statements, are not included in Rubis’ taxonomy indicators.

The Group has adopted assumptions and methods as described in this document when they are material and which may change depending on the interpretations and Frequently Asked Questions published by the European Commission.

4.2.2.5.2 ANALYSIS OF THE GROUP’S ACTIVITIES WITH REGARD TO THEIR ELIGIBILITY AND ALIGNMENT

Eligibility

The assessment of Rubis’ eligible activities was carried out on the basis of a detailed analysis of its various activities with regard to the activities described in the Taxonomy Regulation. This analysis was carried out jointly by the CSR and Consolidation teams, with support from the HSE and Climate/New Energies teams. Rubis’ accounting plans were studied in order to establish an accounting methodology.

As of 31 December 2022, the Group’s activities were as follows:

•   Retail & Marketing of fuels, liquefied gas (LPG) and other types of products such as bitumen (Rubis Énergie);

•   Support & Services, which includes the supply, transport and service activities carried out for the needs of Retail & Marketing activities (Rubis Énergie);

•   Photovoltaic Electricity Production via ground-based solar power plants (Rubis Photosol).The Group manages the entire cycle of photovoltaic projects (financing, construction and operation of power plants);

•   Bulk Liquid Storage (Rubis Terminal JV). As this joint venture is accounted for using the equity method in Rubis’ financial statements, no information is reported in the Group’s taxonomy indicators.

During its taxonomy analysis, the Group identified two activities, from among those listed by the European Regulation as being fully eligible under the first applicable objective of climate change mitigation:

•   activity 4.1 – Electricity generation using solar photovoltaic technology: the Group has an activity, via Rubis Photosol, for the construction and operation of photovoltaic power plants in France on its own behalf and that of third parties;

•   activity 7.6 – Installation, maintenance and repair of renewable energy technologies as part of its construction and operation of solar power plants: the Group, via Rubis Photosol, performs technical and material maintenance activities for its own network and on behalf of third parties through maintenance contracts.

The analysis revealed the absence of eligible revenue for the rest of the Group’s activities (in particular in connection with its Retail & Marketing activities not mentioned in the Regulation). The analysis of eligibility for investments and operating expenses was therefore focused on “individual measures”:

•   activity 4.1 – Electricity generation using solar photovoltaic technology: the Group supports an investment policy for the installation of photovoltaic panels on roofs in its Retail & Marketing subsidiaries (via its subsidiary Rubis Énergie, in the French Antilles and Jamaica);

•   activity 4.10 – Storage of electricity: the Group is developing (via its subsidiary Rubis Énergie, as part of the RSB project) photovoltaic energy production infrastructures coupled with hydrogen electricity storage capacities to ensure continuity of energy distribution;

•   activity 5.1 – Construction, extension and operation of water collection, treatment and supply systems: the Group (via its subsidiary Rubis Énergie) operates a seawater desalination unit at the SARA refinery (in Martinique), which enables the autonomous production of fresh and demineralised water for the refining process and any water needs on the island. This consists of an osmosis unit and reduces the pressure on the potable water network;

•   activity 6.5 – Transport by motorbikes, passenger cars and light commercial vehicles: for the head office and its subsidiaries, the Group has its own vehicles as well as long-term leases for light commercial vehicles;

•   activity 7.2 - Renovation of existing buildings: the Group carried out renovation work on buildings (excluding storage and distribution facilities for fossil-based products);

•   activity 7.7 – Acquisition and ownership of buildings: the Group, within the meaning of the Regulation (including the inclusion by IFRS 16 of its long-term leases) has the use and ownership of its buildings for administrative and/ or operational use, for all its activities in France and abroad.

In addition, as of 31 December 2022, non-material capital expenditure (less than €1 million) was committed for activities 1.2, 6.10, 6.15, 7.3 and 7.6.

It should be noted that in 2022, as in 2021, the Rubis Group has considered the shipping of fuels and bitumen as ineligible.

Delegated Regulation EU 2021/2139 explicitly states that fossil fuel transport activities cannot be considered as aligned under the substantial contribution criterion of the climate change mitigation objective. The transport of bitumen, which is not a fuel but a derivative of crude oil, is not directly referred to in the texts. However, for the sake of consistency with the taxonomy spirit and given the non-material nature of this activity, Rubis has treated this activity in the same way as fossil fuel transport. Therefore, it is not included at this stage in eligible activities. The Rubis Group has deemed it more prudent not to present as an eligible activity an activity that structurally, according to the text, could never be aligned.

As a result, in line with this interpretation, investments made and operating expenses for facilities dedicated to the storage and distribution of products from fossil sources (petroleum products, liquefied gas, bitumen) are also excluded by the Group from eligible activities.

It should be noted that the Group’s eligible capex for the financial year 2022 amounted to €423 million out of a total of €679 million. The eligibility ratio thus stands at 62% of consolidated capex. This high ratio is explained by the acquisition of Photosol on 1st April 2022, for which the fair value of non-current assets is included for €417 million including right-of-use assets. The acquisition of Photosol meets the Group’s objective to integrate low-carbon energy production into its activities. However, this change in scope cannot be considered for the purposes of the 2023 taxonomy reporting.

Alignment

Description of the method used for the substantial contribution and DNSH criteria

In order to assess the alignment of its activities, Rubis SCA and the subsidiaries concerned systematically verified compliance with the criteria of substantial contribution to climate change mitigation as well as DNSH (Do No Significant Harm).

The analysis carried out demonstrated the alignment of its operations for activities 4.1 relating to the generation of electricity using photovoltaic technology (via Rubis Photosol and Rubis Énergie for individual measures) and 7.6 relating to equipment installation and maintenance (via Rubis Photosol):

BUSINESS SEGMENT   ENERGY
Taxonomy activity         Activity 4.1 – Electricity generation using solar photovoltaic technology
TECHNICAL SCREENING CRITERIA
Substantial contribution to climate change mitigation  Comments on alignment   Opinion on alignment for the entity
Mitigation criterion: the activity consists of producing electricity using solar PV technology.  For the company, this means qualifying the activity that is carried out.  The installation and operation of PV solar panels meets the definition of the substantial contribution criterion. Proof of alignment: purpose of contracts signed with third parties.
Do No Significant Harm  Comments on alignment  Opinion on alignment for the entity
DNSH 2 –
Climate change adaptation:
This activity complies with the criteria set out in Appendix A of the Delegated Acts.
  The company must demonstrate that it has carried out a study to identify and anticipate the risks related to climate hazards.  The Rubis Photosol and Rubis Énergie subsidiaries conducted a physical risk analysis for each of the sites declared as eligible and aligned. Proof of alignment: Risk analysis and adaptation plan.
DNSH 3 –
Sustainable use and protection of water and marine resources:

None.
  -  -
DNSH 4 –
Transition to a circular economy:
The activity consists of assessing the availability and, as far as possible, using equipment and components that are highly durable and recyclable and that are easy to dismantle and refurbish.
  The company must demonstrate the existence of a sourcing strategy and its implementation, as far as possible.  Projects to install solar panels at the Rubis Énergie subsidiary’s service stations and Rubis Photosol’s solar power plants are accompanied by actions to promote the sustainability and recyclability of PV panels (sourcing strategy, environmental tax, commitment on the dismantling of PVs, business cases, etc.) Proof of alignment: Profitability and sustainability analysis, sourcing strategy, payment of environmental tax.
DNSH 5 –
Pollution prevention and control:

None.
   -     -  
DNSH 6 –
Protection and restoration of biodiversity and ecosystems:
This activity complies with the criteria set out in Appendix D of the Delegated Acts.
  The company must demonstrate that it has carried out a study on its impacts within the ecosystems. Compliance is automatic in France.  The conduct of an environmental impact study is governed by French law. In   other jurisdictions, specialised firms are commissioned to carry out impact studies. Proof of alignment: Administrative authorisation for construction, impact studies.
BUSINESS SEGMENT   ENERGY   
Taxonomy activity         Activity 7.6 – Installation, maintenance and repair of renewable energy technologies
TECHNICAL SCREENING CRITERIA
Substantial contribution to climate change mitigation  Comments on alignment  Opinion on alignment for the entity
Mitigation criterion: The activity consists in one of the following individual measures, if installed on-site as technical building systems:
(a) installation, maintenance and repair of solar photovoltaic systems and the ancillary technical equipment; (…)
  For the company, this means qualifying the activity that is carried out.       The installation and maintenance of PV solar panels meets the definition   of the substantial contribution criterion. Proof of alignment: Purpose of contracts signed with third parties.
Do No Significant Harm   Comments on alignment  Opinion on alignment for the entity
DNSH 2 –
Climate change adaptation:
This activity complies with the criteria set out in Appendix A of the Delegated Acts.
  The company must demonstrate that it has carried out a study to identify and anticipate the risks related to climate hazards.  The Rubis Photosol subsidiary conducted a physical risk analysis for each of the sites declared as aligned. Proof of alignment: Risk analysis   and adaptation plan.
DNSH 3 –
Sustainable use and protection of water and marine resources:

None
  -  -
DNSH 4 –
Transition to a circular economy:

None
  -    -  
DNSH 5 –
Pollution prevention and control:

None
  -  -
DNSH 6 –
Protection and restoration of biodiversity and ecosystems:

None
  -  -

The other activities were not considered aligned with regard to the DSNH or the substantial contribution criteria.

Description of the method used for minimum safeguards

The analysis of compliance with minimum safeguards was carried out at the Rubis Group level by the Group CSR & Compliance Department, in conjunction with the CSR Advisors of the various entities.

The Group’s compliance with the minimum safeguards criterion is based on Rubis’ commitment to the United Nations Principles on Business and Human Rights, the OECD Guidelines for Multinational Enterprises, as well as the Group’s commitment to respect the principles and rights set out in the eight fundamental conventions mentioned in the declaration by the International Labour Organization.

The procedures that the Group puts in place to comply with these commitments include, among other things, membership of the UN Global Compact, the mapping and publication of risk factors inherent to Rubis’ activity and the implementation of a Group alert mechanism.

These procedures will be strengthened for 2023 with , in particular, the definition of an action plan based on the initial conclusions of the human rights risk mapping and the launch of work on responsible purchasing with the implementation of a dedicated system to monitor the mitigation measures taken by the Group and its suppliers.

The Group’s policies concerning the fight against corruption (in line with the Sapin II law), tax evasion and respect for human rights are presented in section 4.5.1. The measures aimed at strengthening the Group’s approach to human rights within the value chain are inspired by the French duty of vigilance (to which the Group is not legally subject).

4.2.2.5.3 TAXONOMY INDICATORS

Revenue

Definition of the indicator

As of 31 December 2022, the amounts corresponding to eligible activities (A.2), i.e., eligible revenue, correspond to almost the entire revenue of the subsidiary Rubis Photosol, for an amount of €32 million.

The amounts corresponding to aligned activities (A.1), i.e., eligible and aligned revenue, also correspond to almost the entire revenue of the Rubis Photosol subsidiary.

The denominator corresponds to the Group’s consolidated revenue (i.e., €7,135 million).

Results

The results detailed using the regulatory tables are presented in chapter 8, section 8.5. Overall, 0.45% of Group revenue is eligible and aligned.

Capital expenditure (capex)

Definition of the indicator

As of 31 December 2022, the breakdown of the numerator of the eligibility ratio (A.2), i.e., Rubis’ eligible capex, is as follows: the Rubis Photosol subsidiary’s almost entire eligible capex since 1st April 2022 represents €413 million for activity 4.1 and €1 million for activity 7.6.

In addition, activity 7.7 generated capex of €3 million.

The increase in non-current assets related to the acquisition of Rubis Photosol on 1st April 2022 is also included in the Group’s eligible capex for activity 4.1, in the amount of €396 million (value as of 1st April 2022).

The amounts corresponding to aligned activities (A.1), i.e., eligible and aligned capex, correspond in particular to:

Rubis Photosol’s capex for activities 4.1 and 7.6.

It should be noted here that 100% of the eligible capex for activities 4.1 and 7.6 of the Rubis Photosol subsidiary are aligned with the technical criteria of the taxonomy.

The total capital expenditure used as the denominator for the calculation of the capital expenditure indicator for the taxonomy is €679 million and corresponds to increases in property, plant and equipment and intangible assets over the period, including increases in IFRS 16 right-of-use assets and business combinations. It can be reconciled with the figures shown in notes 4.1 and 4.3 to the financial statements as follows:

(in thousands of euros) Changes in scope Acquisitions Reclassifications Total
Note 4.1.1 Property, plant and equipment 316,845 224,138 (9,836) 531,147
Note 4.1.2 Right-of-use assets 51,360 42,348 - 93,708
Note 4.3 Intangible assets 46,683 7,427 205 54,315
TOTAL 414,888 273,913 (9,631) 679,170

Results

The results detailed using the regulatory tables are presented in chapter 8, section 8.5. In summary, 62.3% of the Group’s capex were eligible and 61% were aligned in 2022.

Operating expenses (opex)

Definition of the indicator

Analysis of opex led to the identification of flows for the activities of Rubis Photosol and Rubis Énergie. For Rubis Photosol, opex related to eligible and aligned activities are not material. The maintenance of the fleet is internalised and the opex mainly consist of the purchase of spare parts and repairs. For Rubis Énergie, the opex identified by the regulation and eligible under “individually sustainable measures” are not material. They mainly relate to non-capitalised research and development costs and short-term leases.

Results

Taking into account the analysis carried out on the opex within the meaning of the taxonomy, these represent a maximal amount of €165 million, which is not material at the Group scale. The share of eligible and aligned operating expenses under the European Green Taxonomy is deemed nil.

The results detailed using the regulatory tables are presented in chapter 8, section 8.5.

4.2.2.5.4 ADDITIONAL INFORMATION

The oil and gas sector plays a key role in terms of access to energy, particularly in many of the regions where Rubis operates and where a large portion of the population does not have this access to energy. The need to reduce greenhouse gas emissions at the global level, reflected in the European Green Taxonomy, is well integrated by Rubis, which is investing in the energy transition and in the carbon reduction and diversification of its historical activities.

In addition, in June 2021, the Group acquired an 18.5% interest in HDF Energy (hydrogen-electricity) as part of a strategic partnership. Due to the nature of the transaction (non-controlling interest through the acquisition of shares for €78.6 million), it cannot be taken into account in the capex as defined in the taxonomy, although it corresponds to an eligible activity (activity 4.1 Electricity production using solar photovoltaic technology): the power plants developed aim to provide continuous or on-demand electricity from renewable energies (wind or solar), combined with high-power fuel cells to remedy the intermittent problems of renewable energies.

Since 2017, Rubis has collaborated with HDF Energy on the West Guyana Power Plant (CEOG), of which SARA holds 30%. CEOG is an innovative plant comprising solar panels, batteries and storage of hydrogen produced with the assistance of electrolysers. The plant will make it possible to supply the equivalent of 10,000 households with stable, guaranteed and non-polluting electricity once commissioned, which is scheduled to take place in mid-2024. A similar project is being studied in Barbados. It will help the Barbadian State achieve its target of 100% renewable energy by 2030.

In general, the development method of these projects, usually a joint venture, will not allow them to be counted in the taxonomy indicators and, therefore, to value the Group’s diversification towards less carbon-intensive activities, including when the activities are eligible or even aligned.

Virtuous investment spending

Alongside its taxonomy reporting, Rubis Énergie defined and implemented its own reference framework of capex identified as virtuous in terms of their contribution to the fight against climate change. These capital expenditures are outside the scope of the European Green Taxonomy. The main criteria used to identify virtuous capex from an environmental point of view are decarbonisation (reduction of CO2 emitted) and the ability to promote the energy transition. While these expenses represented a limited amount in 2021, they increased in 2022 and will be subject to specific reporting from 2023.

Among these capex that are virtuous but not eligible at this stage, we can note solarisation projects (facilities for the production of electricity from photovoltaic systems, with or without batteries) on the roofs of buildings or service stations, which are not included at this stage in the eligible capex (see section 4.2.2.5.3, paragraph capex). The electricity produced, consumed by users or resold, not only reduces CO2 emissions, but also achieves savings in electricity consumption. For example, as of 31 December 2022, 10 subsidiaries have installed photovoltaic panels on their buildings.

A more detailed presentation of the operating actions implemented to control and reduce the carbon footprint of the Group’s activities and to diversify its activities can be found in section 4.3 “Combating climate change” of this chapter.

Rubis Terminal JV

The Rubis Terminal JV specialises in the storage and handling of bulk liquid and liquefied products, such as fuels, chemical and agrifood products. It has been consolidated using the equity method in its financial statements since 30 April 2020 and is 55%-owned by Rubis SCA. It cannot therefore be included in the Group’s taxonomy indicators, in accordance with Regulation EU 2020/852. The Rubis Terminal JV was nevertheless analysed as a whole, given that the joint venture is included in the Group’s Non-Financial Information Statement. In this context, a review of the activities of the Rubis Terminal JV in the light of the European Green Taxonomy was carried out in order to determine the share of the company’s activities eligible under the European Green Taxonomy.

No revenue-generating activity of the Rubis Terminal JV has been identified as eligible under the European Green Taxonomy, given the partial and specific consideration of storage activities within the Delegated Climate Regulation. The taxonomy does not necessarily include all the activities constituting the complete production chain of the finished product, which alone may be eligible. The potentially eligible activity of the Rubis Terminal JV would have been the storage of raw materials for the production of biofuels or other products and energy. However, after a more detailed study of the texts and exchanges with the teams of the Rubis Terminal JV, it became clear that storage activities not explicitly described in the texts of the European Green Taxonomy are not eligible activities. Discussions with professional storage organisations are underway to clarify the role of storage activities.

It is important to highlight the essential contribution of the Rubis Terminal JV in the value chain of the following products, which are eligible under the taxonomy, thanks to its storage activity for the manufacturing industry:

•   chemical product storage activity: this represented 40.9% of the revenue of the Rubis Terminal JV as of 31 December 2022, with these products then being used in various industries (3.11 carbon black activity, 3.16 nitric acid activity, 3.17 plastics in primary form activity, as defined in Delegated Regulation 2021/2139);

•   energy and biofuel storage activity: the biofuel storage activity (activity 4.13 as defined in Delegated Regulation 2021/2139) represented 12% of the revenue of the Rubis Terminal JV as of 31 December 2022;

•   blending activity allowing the marketing of additive products ready for consumers: the Rubis Terminal JV is involved, in particular, in blends that make it possible to include a portion of regulatory biofuel in fuels sold (activity 4.13 of Delegated Regulation 2021/2139).

4.2.3 Operating in a safe environment / NFIS /

Due to the nature of their activities, the safety of operations is a constant concern for Rubis Énergie’s and the Rubis Terminal JV’s HSE teams. Rubis Énergie operates 16 industrial sites that are classified as Seveso sites (high and low threshold, including a refinery) in the European Union, as well as 49 similar sites located outside the European Union (petroleum or chemical product storage sites and LPG cylinder filling plants). The Rubis Terminal JV operates 27 classified industrial sites as of the date of publication of this document.

The Group’s HSE teams are committed to a continuous process aimed at improving measures and procedures relating to the security of property and the safety of people, particularly employees but also external service providers, customers and local residents. Strict industrial health and safety standards are applied by all Group subsidiaries. Efforts are focused on the safety of the facilities, so as to prevent major accidents, and on personal safety, by preventing workstation accidents and the safety of customers and local residents from being compromised.

The Group continues to invest regularly to upgrade its facilities to comply with the strictest environmental and safety standards and to guarantee that people and their environment are protected (air, water, soil and urban areas located near its facilities).These investments guarantee the reliability of its operations and, as a result, the Group’s competitiveness. In 2022, they amounted to €109 million for Rubis Énergie (compared to €133 million in 2021). The Rubis Terminal JV invested €27 million in 2022.

What is a Seveso site?

Generally, all industrial or agricultural facilities liable to create risks or cause pollution or nuisances for local residents are qualified as installations classified for the protection of the environment (ICPE). Some of these ICPEs are Seveso classified since their operation in France is subject to authorisation by the prefect. Indeed, when an industrial site handles hazardous products, an accident can quickly have serious consequences.

Following an industrial accident that occurred in 1976 at a chemical plant in Italy, the European public authorities adopted a directive known as the Seveso Directive, named after the town near the plant where the accident occurred, to prevent major industrial accidents. The European Seveso Directive, which has been amended three times since it was adopted in 1982, classifies industrial facilities according to the level of danger they represent in case of an accident. The classification, based on the quantity of hazardous products stored, is at either a “high threshold” or “low threshold” Seveso site. The prevention measures to be implemented by operators are adapted to the type of site. They are based on a regularly updated hazard study.

4.2.3.1 Operational safety: target of zero major industrial accidents / NFIS /

Most of Rubis Énergie’s and the Rubis Terminal JV’s facilities in France and the rest of Europe (storage sites and LPG cylinder filling plants) are subject to the Seveso regulation and consequently must comply with very strict environmental protection and industrial safety standards (regular risk assessments, adoption of measures to prevent and, where necessary, manage the consequences of potential accidents). These standards are being phased in gradually by non-European subsidiaries while taking into account the constraints of the local environment.

RISKS

Risk mapping is performed by the subsidiaries’ Management with the support of the heads of Retail & Marketing, industrial facilities and of the shipping activities (see chapter 3, section 3.2.3.2).

With regard to operational safety, the main risk is the occurrence of a major accident in industrial or distribution facilities (service stations), including an explosion or fire that could cause damage to people, the environment and/or property, etc.

MEASURES TO LIMIT INDUSTRIAL RISKS AND GUARANTEE OPERATIONAL SAFETY

In order to reduce the industrial risks inherent in its activities (regardless of whether they are subject to European regulations) and in accordance with the “zero major industrial accidents” target the Group has set for itself, QHSE teams work on the following factors.

Improving preventive maintenance of facilities and employees’ risk perception

Rubis Énergie and the Rubis Terminal JV continued to roll out their respective preventive facility maintenance tools (computer assisted maintenance management). Once the relevant information has been loaded into the database, these systems allow monitoring and preventive maintenance work to be planned. Its other functions are to catalogue all past maintenance operations so as to create a servicing history, anticipate spare parts requirements, assess maintenance costs in connection with the management of machinery equipment, and prepare budget estimates.

In addition, Rubis Énergie is gradually involving its employees in a continuous effort to improve the safety of facilities by respecting the Plan – Do – Check – Act rule.

Moreover, to improve understanding of the systems and the assessment of the risks relating to Seveso facilities, the Rubis Terminal JV has promoted the use of Piping and Instrument Diagrams (PID). PIDs are a system for presenting process functions, which is used to catalogue a site’s pipes, tanks and pumps and to harmonise disparate existing blueprints by replacing them with a single reliable plan that can be duplicated on all sites.

Use of lesson learned procedures

The organisational arrangements of these procedures vary according to the activities.

Rubis Énergie uses its extranet to circulate to all its subsidiaries a document base that includes lessons learned. Recommendations can then be made after analysing accidents and can include adapting organisational measures, updating risk prevention procedures, reinforcing employee training activities, facilities modifications or improving equipment monitoring.

The procedure for reporting incidents, near misses and accidents by subsidiaries, which gives rise to lessons learned, is an excellent indicator of the safety culture prevailing in the various entities. It is also an important aspect of the continuous improvement process. For example, between 2021 and 2022, Rubis Énergie was able to circulate more than 20 lessons learned reports to all its subsidiaries, detailing the description, consequences and main causes of each incident and the main recommendations to be put in place to prevent such incidents from happening again. These reports covered a wide variety of areas, including the inspection of liquefied gas cylinders before filling, securing containers on trailers, works at service stations, loading tank trucks at depots, fuel deliveries to customers, etc.

The Rubis Terminal JV has developed safety-sharing software (Rubis Terminal Operational Platform) to facilitate and encourage the collection and exchange of safety-related information. This interface collates incident and near-incident reports at each terminal and comes with a lesson learned management module and a report module and dashboard. It is used by local QHSE teams and promotes interactions between sites in view of limiting the repetition of risky events.

Prevent and control technological risks: the preventive safety mechanism at facilities

Prevention of technological risks is ensured through regular inspections of the Group’s sites and subsidiaries by the Industrial and Technical Departments of Rubis Énergie and the Rubis Terminal JV. They are detailed in reports prepared in consultation with the heads of the relevant facilities and the heads of the relevant subsidiaries in order to analyse potential anomalies and/or shortcomings and to take steps to remedy them. Within Rubis Énergie, 27 subsidiaries were audited in 2022.

In addition to inspections and lessons learned, each entity implements preventive measures that are appropriate for its own activity, including:

•   internal inspection programmes for all liquefied gas and fuel bulk storage tanks, which are generally scheduled every 10 years or as required by international standards;

•   installation and maintenance of safety equipment such as gauges, level alarms, fire defences, gas detection systems, etc.;

•   systematic verification that all substances stored, whether existing or new, have been authorised in advance by an operating permit if required;

•   pursuant to Seveso regulations, a procedure to prevent major accidents at French facilities involving hazardous substances, and supplemented by “Instrumented Risk Control Measures” (IRCMs);

•   periodic inspection of fire-fighting systems and regular updating of contingency plans in consultation with local authorities. In addition, these facilities are regularly tested through exercises that simulate potential accident conditions as closely as possible.

Should a major event occur despite the implementation of these rigorous preventive measures, arrangements have been made for:

•   establishing a crisis management organisation that can be triggered rapidly if there is a major event. For example, the relevant high-risk facilities have emergency response plans that aim to bring incidents under control as quickly as possible using local resources so as to guarantee the best possible protection of people and property. These plans are combined with 24/7 on-call crisis management procedures that may be activated depending on the severity of the event. Lastly, some subsidiaries organise regular training sessions on crisis communications through accident simulation exercises, which allows them to test pre-established communication protocols;

•   the option to obtain assistance from specialist companies. For example, Rubis Énergie has partnered with Oil Spill Response Ltd to receive assistance in the event of maritime pollution at its fuel depots. It also partners with professional bodies such as GESIP (Groupe d’étude de sécurité des industries pétrolières et chimiques – Group for Safety Research in the Petroleum and Chemical Industries), WLPGA (World Liquefied Petroleum Gas Association), JIG (Joint Inspection Group) and IATA (International Air Transport Association), which are expert organisations in aviation refuelling and provide general operational, training and safety support.

The Rubis Terminal JV Seveso storage sites in question possess both internal and external resources for responding to pollution accidents. For example, specialised companies are appointed to manage any river spills that could be carried along by the current.

RESULTS

In 2022, in line with the target set by the Group, no major accidents occurred in the framework of Rubis Énergie’s and the Rubis Terminal JV’s activities.

In addition to the constant concern of preventing major industrial accidents, the Group also continues to make efforts to reduce the occurrence of more minor industrial accidents to every possible extent.

For more information, please refer to sections 4.2.3.2.1 “Occupational health and safety” and 4.2.2.1 “Water and soil pollution”.

4.2.3.2 Personal safety / NFIS /

Personal safety is a direct result of operational safety. Rubis is just as attentive to workplace safety (section 4.2.3.2.1) as it is to the safety of customers and local residents (section 4.2.3.2.2). The Group’s objective is to have no fatalities at facilities operated by Group subsidiaries, including the Rubis Terminal JV, and to reduce as far as possible the number of accidents that are liable to result in lost time for both subsidiary personnel and outside contractors. With regard to road traffic accidents (particularly on the African continent, where the accident rate is high), each subsidiary is responsible for implementing the preventive instructions and training plans needed to reduce the rate of accidents recorded as much as possible, depending on local constraints.

4.2.3.2.1 OCCUPATIONAL HEALTH AND SAFETY / NFIS /

A proactive occupational health and safety policy has been implemented. It covers both preventing occupational accidents and preventing occupational and non-occupational illnesses.

Risks

Beyond the generic risks inherent in any industrial activity, Rubis’ activities carry more specific risks in terms of occupational health and safety, which are related in particular to:

•   the intrinsic properties of products being handled (hazardous materials);

•   transport (road safety): each year vehicles transporting products cover many kilometres.

Each Group entity endeavours to offer the safest working conditions to its employees and to service providers working on its sites.

Measures taken

Rubis’ Code of Ethics sets out a general framework for the Group’s safety culture, which requires all employees to act responsibly when performing their duties, to comply with the health, safety and environmental protection procedures on site, and to pay particular attention to compliance with these rules by all parties (colleagues, suppliers, external service providers, etc.). On this basis, a quality health, safety and environmental (QHSE) policy has been prepared by Rubis Énergie and the Rubis Terminal JV to protect the physical integrity of individuals and to minimise the impacts of any major accidents.

Since 2015, variable compensation for the Group’s Management Board includes a criterion relating to changes in the accident rate (rate of frequency of occupational accidents per million hours worked), underscoring its commitment and involvement in safety challenges.

Occupational accidents and operator safety

To guarantee the maximum level of safety for operators at Group sites, each entity is responsible for holding training sessions for external operators on the risks generated by the facilities and the products handled within such facilities. For example, Rubis Énergie has set itself the additional objective of maintaining a level of training that will enable it to maintain the HSE performance level of its employees.

The Rubis Terminal JV, whose operational teams already receive training on the subject, achieved a rate of 100% of employees at the head offices in each country who attended an HSE risk awareness training course, which is, moreover, part of the training for all new hires.

Furthermore, prior to working in a facility, each external service provider must also approve a safety plan (sometimes called a prevention plan or safety protocol) describing the risks associated with the work, safety instructions and emergency instructions.

The objective is for there to be no fatalities and to reduce as far as possible the number of accidents likely to result in lost time, with respect to both subsidiaries’ personnel and external service providers.

Occupational illness and health

The Group pays close attention to risks linked to occupational illness and, for several years now, has offered ergonomic training to employees in at-risk positions.

Regarding other health risk factors, exposure measurement campaigns are conducted, notably by the SARA refinery, regarding chemical products, noises and vibrations, Legionella and asbestos.

Regarding non-occupational illnesses, the Group is present in some countries experiencing epidemics. Awareness-raising and assistance programmes have been developed in some subsidiaries, for example in the context of the fight against AIDS (South Africa), the Ebola epidemic, malaria (Nigeria), the plague (Madagascar), cholera (Haiti) and chikungunya (the Caribbean).

Lastly, private health coverage is taken out for employees to enable them to access healthcare (see section 4.4.3.2).

Road safety

In the area of road safety, the Group is constantly seeking to improve outcomes in terms of road accidents associated with its activities, and in particular those of Rubis Énergie and its subsidiaries. In addition to the application of the regulations applicable to the transport of hazardous materials, additional measures are taken concerning road haulage. To avoid traffic accidents, certain of Rubis Énergie’s subsidiaries have stepped up their road risk prevention programmes and give instructions that take local constraints into account, such as no night driving in certain countries and/or random alcohol or drug testing.

Defensive driving programmes have been introduced in countries where driving risk is heightened due to driving habits, distances travelled, poor quality road infrastructure or the specificities of the product being transported. The countries in which the Group operates considered to be the most exposed to road safety risks are among the 100 countries identified by the WHO as having the highest number of accidents: https://www.who.int/data/gho/data/ indicators/indicator-details/GHO/estimated-road-traffic-death-rate-(per-100-000-population). In 2022, 81% of the drivers (91% of employee drivers and 78% of external drivers) had been trained.

Furthermore, measures have been taken to modernise equipment (vehicle fleets), notably in Haiti where, in 2018, a five-year action plan in the amount of approximately US$17 million was put in place to replace 70 tank trucks belonging to carriers working for Dinasa. Some subsidiaries have rolled out on-board electronic assistance (France, Switzerland, and Portugal) and tracking systems (Nigeria, Bermuda, Jamaica, South Africa and Madagascar).

Training as a means of preventing risks

Given the risks associated with its activities, the Group invests in training its employees on health, safety and environmental issues. Detailed data is presented in section 4.4.2.

Results

Workplace accidents

The number of workplace accidents recorded by the subsidiaries’ Human Resources Departments (including the Rubis Terminal JV) increased compared to the previous financial year (45 in 2022, compared to 35 in 2021). The efforts made by the operating subsidiaries in the area of health and safety over the past several years, by raising employees’ awareness of the risks associated with their activities (see section 4.4.2) and by improving QHSE procedures (see section 4.2), have gradually and significantly reduced the workplace accident frequency rate. The rate has fallen by more than 42% since 2015 at Rubis Énergie (8.2 in 2015, compared to 4.7 in 2022, per million hours worked) and by 22% at the Rubis Terminal JV (18.3 in 2015, compared to 14.3 in 2022).

While the change in this frequency rate is a key monitoring indicator for the Group, the teams work hard to ensure all accidents are reported, wherever they occur. The Group thus strives to have reporting that is as complete as that required by European regulations. In addition to the analysis of the change in frequency rate, the quality of reporting, which can lead to increases, is thus also a key indicator of safety culture.

  Number of occupational accidents with lost time > 1 day* Of which number of fatalities Frequency rate of occupational accidents with lost time (per 1 million hours worked)* Frequency rate of occupational accidents with lost time (per 200,000 hours worked)* Number of occupational illnesses Instances of total and irreversible work disability
  2022 2021 2020 2022 2021 2020 2022 2021 2020 2022 2021 2020 2022 2021 2020 2022 2021 2020
Rubis SCA/Rubis Patrimoine 0 0 1 0 0 0 0 0 24.3 0 0 4.9 0 0 0 0 0 0
Rubis Énergie 32 27 31 0 1 0 4.7 4 5.3 0.9 0.8 1.1 1 1 0 0 2 1
TOTAL 32 27 32 0 1 0 4.7 4 4.9 0.9 0.8 1.0 1 1 0 0 2 1
Rubis Terminal JV 13 8 9 0 0 0 14.3 9 11.9 2.9 1.8 2.4 0 1 0 1 0 0
TOTAL INCLUDING THE JV 45 35 41 0 1 0 5.8 4.6 5.5 1.2 0.9 1.1 1 2 0 1 2 1
* Including commuting accidents for French subsidiaries. Commencing in 2022, the indicators occupational “accidents with lost time > 1 day” and “frequency rate of occupational accidents with lost time” no longer include the commuting accidents accounted for by French entities, even if they remain considered as being occupational accidents under the declarations made to health insurance funds in accordance with French regulations. These accidents are accounted for as occupational accidents in only a small number of countries and the HSE measures defined and implemented by Group entities relate above all else to preventing accidents that take place during employees’ working hours. It should be noted that travel carried out in connection with an employee’s activity during their working hours remains included in the accounting for occupational accidents (employees who travel on business, drivers, etc.).
In 2021, four commuting accidents reported by entities within the Rubis Énergie scope resulted in lost time lasting more than one day. If the frequency rate is recalculated by excluding these commuting accidents, the frequency rate stands at 4 for Rubis Énergie and 4 for Rubis Énergie + Rubis SCA/Rubis Patrimoine combined.

In 2022, there were no fatal accidents.

Other occupational accidents leading to lost time of more than one day resulted mainly from slips and low-level falls, handling (LPG cylinders, in particular) or minor injuries (cuts, burns). The severity rate (measured in terms of number of days of absence due to an occupational accident) of occupational accidents rose in 2022 compared to 2021: 0.16 vs 0.06 (0.19 vs 0.08 if the Rubis Terminal JV is included).

The absenteeism rate resulting from occupational accidents and illnesses is still very low across the Group as a whole, standing at 0.13% in 2022 (0.16% including the Rubis Terminal JV).

Accidents involving external providers

Monitoring of accidents occurring at Group sites and involving external providers has also been put in place: 11 accidents were reported by the subsidiaries in 2022 (compared to 20 in 2021).There were no fatalities concerning service providers in 2022.

ABSENCE DUE TO OCCUPATIONAL ACCIDENTS AND OCCUPATIONAL ILLNESS*

  2022 2021 2020
Rubis SCA/Rubis Patrimoine 0% 0% 0.18%
Rubis Énergie (Retail & Marketing/Support & Services) 0.13% 0.07% 0.09%
TOTAL 0.13% 0.06% 0.09%
Rubis Terminal JV 0.46% 0.35% 0.22%
TOTAL INCLUDING THE JV 0.16% 0.10% 0.15%
* Days lost as a percentage of the total number of days worked per annum.

4.2.3.2.2 PROTECTION OF THE HEALTH AND SAFETY OF LOCAL RESIDENTS AND CUSTOMERS / NFIS /

The Group’s subsidiaries place particular importance on the health and safety of local residents and customers.

Risks

When local residents live or carry out an activity within the immediate proximity of the Group’s sites, they can be exposed to any industrial risks that may occur. While most Seveso industrial sites are not located in urban areas and are only accessible to authorised persons, service stations, which are accessible to the public, are often located in urban or suburban areas. However, the risk regarding service stations is lower because the quantities of products stored there are limited.

Measures taken

All the measures described in the section on operational safety also protect the health and safety of local residents and customers. Depending on the sector in which the subsidiaries operate and their customers’ specific expectations, subsidiaries take various initiatives, including:

•   a demanding risk prevention policy is in place in all subsidiaries, to protect all persons who are liable to be exposed to risks associated with the handling of stored or distributed products. This policy, which gives rise to substantial internal prevention and control systems, is described in section 4.2.3, section 4.4.2 and in chapter 3, section 3.1;

•   Seveso regulations, which are extremely stringent with respect to health and safety obligations, are complied with by relevant European sites;

•   several subsidiaries have obtained ISO 9001 and 14001 certifications, others are in the process of obtaining certification (see section 4.2.1.2). Recognition of this nature attests to commitments made regarding the health and safety of individuals and respect for the environment;

•   a preventive maintenance and facility compliance programme is implemented in service stations.

The quality of the customer relationship is a key element of the subsidiaries’ strategy but also a critical piece of information about consumer health and safety. The resulting initiatives vary depending on the type of customer.

Results

Vitogaz France has had NF Service Relation Client (NF345) certification since 2015. Revised in 2018, NF Service Relation Client certification is based on international standards ISO 18295-1 & 2. A guide to best practices in customer relationship management, it takes customer expectations into account and aims to guarantee constant improvements to service quality. For Vitogaz France, this quest for excellence in customer experience seeks to establish a long-lasting commercial relationship, deliver quality service over time, ensure that information provided is complete and clear, and to promptly meet its commitments.

4.3 Fighting against climate change / NFIS /

The Group recognises the importance and urgency of the fight against climate change; we are aware of the challenges facing our sector in terms of the energy transition. The oil and gas sector plays a key role in access to energy. This is essential to meeting the basic needs of populations (travel, heating, keeping cool, lighting, cooking) and supporting their development. Nevertheless, even today, a large proportion of the population in many of the regions in which we operate (Africa in particular) is deprived of access to energy.

The changing expectations of society and the need to reduce greenhouse gas emissions worldwide are thus leading us to strike the right balance by taking into account:

•   the need to contribute to the fight against climate change by reducing the CO2 emissions related to its activities;

•   the expectations of those who want access to affordable and reliable energy so they can meet their essential needs and the social-economic impacts of energy transition. Rubis therefore has a role to play in ensuring that this transition is as just as possible.

In this context, the Group is transforming itself into a multi-energy group, in particular through the acquisition of Photosol in 2022, a photovoltaic electricity producer, in order to support the energy transition by taking into account local realities and needs.

Furthermore, the CSR Roadmap, Think Tomorrow 2022-2025, published by Rubis in September 2021, includes the Group’s climate commitments (see section 4.3.4).

This section is structured in accordance with the recommendations of the Task Force on Climate-Related Finance Disclosures (TCFD) (see correspondence table at the end of this chapter, in section 4.3.5).

4.3.1 Governance

Management’s role

Rubis has set up a structured governance system involving all levels of management to ensure that these climate challenges are fully incorporated into the Group’s strategy.

The Managing Director in charge of New Energies, CSR and Communication at Rubis SCA is responsible for these issues at the Group’s Management Committee level, of which she is a member.

She also chairs the Climate Committee, which met three times in 2022.This Committee is made up of the Group CSR Director & Chief Compliance Officer, Rubis Énergie’s General Management and its Finance, CSR, HSE and Risk-Resources Directors (Rubis Énergie is the main contributor to the Group’s carbon footprint assessment), and a representative of the Rubis Terminal JV. Rubis Énergie’s Climate & New Energy team, which was created in 2020, provides input to the Climate Committee and coordinates the operational efforts made by all the Group’s subsidiaries. The Committee’s key role is to:

•   monitor the Climate action plan, which is based around the three pillars, “measure, reduce, contribute to carbon neutrality”;

•   monitor changes in the carbon footprint and the avenues to reduce it;

•   propose solutions for the transition to low-carbon growth in the distribution of energy products.

The principal players in this transition are trained in carbon accounting techniques and climate challenges. In particular, in November 2022, during a CSR seminar bringing together the General Managers of the subsidiaries, all the CSR Advisors, as well as part of the Group’s General Management (nearly 80 people), a session was organised on the Climate Fresco, to raise awareness of global warming. Rubis SCA and Vitogaz Switzerland also organised a Climate Fresco session to raise awareness among their teams.

Moreover, as part of the review of Rubis Énergie’s decarbonisation objectives, four webinars were organised for subsidiary General Managers, CSR Advisors and employees of subsidiaries involved in the decarbonisation of activities. These webinars made it possible to present Rubis Énergie’s scopes 1 and 2 decarbonisation trajectory (2019-2030), the full carbon assessments since 2019 and the scope considered, as well as to illustrate how to calculate tonnes of CO2 avoided according to the decarbonisation actions implemented (solarisation, installation of LED bulbs, purchase of electric vehicles, etc.).

In addition, some subsidiaries have launched more specific training actions for their employees on climate challenges and their strategy to reduce CO2 emissions. For example, Vitogaz France has set up regular communication on these topics and organised “Personal Carbon Footprint Assessment” sessions to enable everyone to see their own impact and remain mobilised. Société Réunionnaise de Produits Pétroliers (SRPP) organised awareness-raising workshops for all its employees as part of the CEE SEIZE programme (understanding the climate and energy challenges of the region, knowing the eco-friendly practices adapted to the context of their business, acquiring best practices in terms of electricity demand management (EDM). Galana (Madagascar) organises monthly awareness sessions for its employees, with, for example, quizzes or competitions between employees. SARA produced videos on the roadmap and decarbonisation, distributed to its sites, and organised a carbon footprint assessment training for SARA’s main internal players.

In 2023, Rubis Énergie will define a strategy to coordinate and raise awareness of climate challenges among all employees of the Group’s subsidiaries.

Monitoring by the Supervisory Board

Rubis SCA’s Supervisory Board is responsible for monitoring of the Group’s climate strategy and performance. In the framework of its work on this subject, the Supervisory Board relies on its specialised Committee, the Risk Monitoring Committee. At meetings held in March and September 2022, the Committee examined the Group’s current climate challenges, including a review of the presentation of the climate risk factor included in the risk factors published by the Group, the presentation of CO2 emission reduction targets, and a progress report on the work carried out in respect of the European taxonomy on “adaptation to climate change” and “mitigating climate change” objectives. The Supervisory Board was also informed about Rubis’ strategy for developing in the area of renewable energies (acquisition of Photosol) and progress on the assessment of the measures for decarbonising Rubis’ activities launched in 2021.

The importance the Group attaches to climate issues is reflected in, among other things, the inclusion since financial year 2019 of an energy efficiency performance criterion that is considered when allocating annual variable compensation to the Management Board. This criterion is based on meeting targets that aim to improve the carbon intensity (operational efficiency) of the Retail & Marketing and Support & Services activities (Rubis Énergie). The satisfaction of this criterion is verified by the Group’s Compensation and Appointments Committee each year and is submitted to Annual Shareholders’ Meetings for approval.

4.3.2 Strategy

Today, Rubis has undertaken to further incorporate energy transition challenges into its strategy. Although there are many avenues to be explored, significant technological, societal and economic challenges remain to be met in relation to reducing the proportion of fossil fuels in the energy mix and making less carbon-intense energies available to all. In order for these solutions to be successful and drive progress, they must be adapted to the specific characteristics of each of our regions. Lastly, to be sustainable, growth must also be inclusive. It is therefore essential that the policies implemented to promote the transition to a low-emission economy that is resilient to climate change have a positive social impact.

In this context, in order to move concretely towards growth that is less dependent on fossil fuels, Rubis has identified as the main pillars of its climate strategy:

•   decarbonising its historical activities (emissions related to operations): objective of reducing carbon emissions from operations by 30% by 2030 (2019 baseline, scopes 1 and 2, Rubis Énergie scope representing 99.5% of the Group’s consolidated revenue as of 31 December 2022), defined based on an in-depth study of decarbonisation levers. In 2022, an additional objective of a 20% reduction by 2030 (2019 baseline) in scope 3A CO2 emissions (Rubis Énergie scope, outsourced shipping and road transport, i.e., 45% of scope 3A) was defined;

•   diversification of its Retail & Marketing activities (carbon intensity of products sold) around three focus areas: mobility, biofuel offering and hybrid solutions offering;

•   renewable energy production: the Group completed the acquisition of Photosol (photovoltaic electricity producer) in April 2022 and acquired an 18.5% stake in HDF Energy (hydrogen electricity) in 2021.

These strategic pillars are discussed in section 4.3.3.2.

Adapting the Group by reducing the carbon footprint of its activities and diversifying its offering is a key factor in continuing sustainable growth and responding to climate risks (regulatory developments, such as the implementation of carbon taxes, physical risks linked to the effects of climate change, etc.).

Climate challenges present opportunities for Rubis Énergie and the Rubis Terminal JV to develop new offerings and products to aid in energy transition by adapting to the needs and on-the-ground realities of each region in which the Group operates. Indeed, in line with international climate agreements, including the 2015 Paris Agreement, although the fight against climate change is a global challenge and a shared responsibility, transition challenges differ depending on the geographic area.

Rubis is now directly involved in the development of renewable energies, in particular via its Rubis Photosol entity, which produces photovoltaic electricity and, in addition, contributes to innovation and the deployment of low-carbon solutions (synthetic diesel, green hydrogen, CO2 capture by algae, biological carbon sinks), while developing training and employment, and improving the local and global environmental footprint.

To support its investment decision-making, in 2022 Rubis defined a methodology for using an internal carbon price (target for implementation in 2023).

The Group’s CSR Roadmap, Think Tomorrow 2022-2025, published in September 2021 includes the Group’s climate objectives (see section 4.3.4).

At this stage, Rubis has not made a “Net Zero Carbon” commitment. Indeed, achieving this objective would require Rubis to have massive recourse to measures contributing to global carbon neutrality (offsetting). While Rubis does not rule out the measured use of such ad hoc actions in well-defined contexts to contribute to global carbon neutrality, it does not wish to base its climate strategy on this mechanism. Above all, the Group seeks to implement measures to reduce its emissions and diversify its activities, in accordance notably with the ADEME opinion published in July 2021.The few projects implemented to contribute to global carbon neutrality (offsetting) are selected with the greatest care, in particular by taking into account their co-benefits and the involvement and local presence of a subsidiary, so that they fit with the Group’s overall CSR approach.

4.3.3 Risk management

4.3.3.1      Description of risks

Climate challenges are included in the Group’s risk analysis processes, and its risk mapping work in particular, which contains a dedicated section on the issue. Therefore, each year, every business unit assesses its exposure to climate risks.

The climate risks to which Rubis, and more specifically Rubis Énergie, are exposed are described in greater detail in a dedicated risk factor in chapter 3, section 3.1.2.2. These risks are grouped into two main categories: physical risks (vulnerability of facilities to natural hazards, impact of temperature variations on product sales in the most exposed areas, Europe in particular) and transition risk (changes in the regulatory environment, particularly in Europe with the European Union’s Fit for 55 programme; stakeholder expectations). It should be noted that 23% of emissions are linked to business units within EU countries (36% of scopes 1 and 2 and 25% of emissions linked to volumes of products sold), where regulations pertaining to energy transition are the most advanced.

These risks are also described in the Group’s response to the CDP Climate Change 2022 questionnaire accessible on the CDP’s website.

The Group plans to deepen its analysis of climate, physical and transition risk scenarios in 2023.

These risks do not have the same degree of materiality for Rubis Énergie and for the Rubis Terminal JV due to the different nature of their activities. Present only in Europe, the Rubis Terminal JV’s main activity is to provide bulk liquid storage capacity for third parties (fuels including biofuels, chemical products and agrifood products) and, more marginally, to distribute small volumes of fuels.

In order to enhance the consideration of climate risks in its decision-making process, in 2022 Rubis defined a methodology for using an internal carbon price (with an objective for use in all subsidiaries falling within Rubis Énergie’s scope by 2023).This tool will help management to better incorporate climate risks and challenges in investment projects (external or organic growth) presented to it.

4.3.3.2      Carbon footprint management measures

The operational measures taken by the Group to control and reduce the carbon footprint related to its activities, and thereby strengthen its climate resilience seek to:

•   improve the energy efficiency of its operations;

•   diversify the activities of energy distribution;

•   develop the Renewable Electricity Production activity thanks to the new Rubis Renouvelables division.

These measures would not be complete without acting on demand, by implementing support and awareness-raising measures aimed at getting customers to reduce their emissions by consuming better and less. Finally, actions to contribute to global neutrality (carbon offsetting) are occasionnally implemented by the Group’s subsidiaries.

IMPROVING THE ENERGY EFFICIENCY OF THE GROUP’S OPERATIONS

The Group makes significant efforts daily to reduce energy consumption in our industrial activities, optimise operating expenses and reduce the impact of its activities on climate change. Particular attention is paid to the most energy-intense industrial sites. As energy consumption also results in air emissions other than greenhouse gases, some of the measures described below are also aimed at reducing the polluting emissions discussed in section 4.2.2.2.

In 2021, with the help of a specialised consulting firm, Rubis Énergie carried out a comprehensive study aimed at clarifying the decarbonisation trajectories for scopes 1, 2 and 3A (excluding products sold). The Group has already confirmed an ambitious objective of reducing emissions from operations (scopes 1 and 2): -30% by 2030 (2019 baseline, Rubis Énergie scope, on a like-for-like basis, with changes in scope taking into account the principles of the GHG Protocol). In 2022, an additional target of a reduction of -20% in Scope 3A emissions (i.e., excluding products sold) has been defined (2019 baseline, Rubis Énergie scope, covering outsourced shipping and road transport, i.e., 45% of scope 3A).

Rubis’ decarbonisation trajectory therefore falls within a well-below 2°C scenario.

Rubis Énergie

Initiatives to reduce energy consumption have been implemented or commenced with respect to the principal sources of carbon emissions (see comprehensive details regarding carbon emissions in section 4.3.4.2), namely:

•   the shipping of distributed products, i.e., 140 kt representing 30% of Rubis Énergie’s CO2 emissions reflected in the comprehensive carbon footprint assessment (excluding products sold);

•   the energy consumption of Rubis Énergie’s industrial facilities, i.e., 100 kt representing 21% of Rubis Énergie’s CO2 emissions reflected in the comprehensive carbon footprint assessment (excluding products sold). Some 83% of these emissions originate from the SARA refinery (84 kt Group share), an industrial transformation activity that requires energy to be consumed in order for it to be carried out;

•   to a lesser extent, the road transport of its products, i.e., 70 kt representing 15% of Rubis Énergie’s CO2 emissions reflected in the comprehensive carbon footprint assessment (excluding products sold).

Examples of initiatives

•   Initiatives relating to the Group’s vessels, such as route optimisation, controls and monitoring of bitumen heating to reduce bunker consumption, etc. In order to continue this reduction trajectory, the subsidiaries are making progress on the use of biofuels in bunkers and the installation of integrated carbon capture and storage systems (CCUS), in a low-carbon navigation market that is still immature, heterogeneous and changing.The Rubis Eastern Caribbean subsidiary, for example, began using 1,167 tonnes of HVO100 (Hydrotreated Vegetable Oil) in its fleet in 2022, i.e., the equivalent of 7% of its marine fuel needs.This also demonstrates the Group’s technical ability to use this new type of fuel.The objective for 2023 and subsequent years is to use more biofuels in vessels, depending on their availability on the market. In addition, Rubis Énergie’s joining the Sea Cargo Charter initiative in 2021 led to progress in the collection of maritime emissions data.The International Maritime Organization (IMO) has also overseen the decarbonisation trajectory to be followed for vessels, through the CII (Carbon Intensity Index).

•   SARA conducted a review of its production processes, which contributed significantly to raising the reduction target from -20% to -30% by 2030 (2019 baseline) on scopes 1 and 2 of the Rubis Énergie scope.

•   Energy saving initiatives in service stations, such as replacing lane lighting with LEDs or, solarising stations in Kenya and the Caribbean by installing photovoltaic panels to reduce electricity purchases but also improve the reliability of access to electricity. The Dinasa subsidiary in Haiti has deployed more than a hundred autonomous streetlights (powered by solar energy) at its depots.

•   Solar powering of warehouses and headquarters. As of 31 December 2022, seven subsidiaries had installed photovoltaic panels on their buildings, i.e., the equivalent of 773 kWp installed. The rate of assets undergoing solarisation is increasing significantly and will intensify in the coming years, with an estimate of an internal portfolio for projects of this type at 3.1 MWp under study.

•   Actions relating to road transport: less carbon-intensive land transport solutions are gradually being tested in the various regions in which the Group operates. An initial test of an LNG powered truck was conducted in Portugal. Road transport by certain subsidiaries is carried out using HVO (Channel Islands, Réunion Island). As part of a trial, Vitogaz Switzerland placed an order for two electric trucks in 2022, delivery of which is scheduled for 2023. Furthermore, operations to optimise delivery rounds, the renewal of fleets towards vehicles with lower consumption and the training of drivers in eco-driving are rolled out with the assistance of the transport companies providing these services for the Group’s subsidiaries. Moreover, through a partnership between Rubis Énergie and the start-up Wenow,Vitogaz France and Vitogaz Madagascar have connected their light vehicles, allowing users to adapt their driving to reduce their fuel consumption and therefore their emissions.


Rubis Terminal JV

The energy consumption of the Rubis Terminal JV industrial facilities represented 11.5 kt (scopes 1 and 2 of the complete carbon footprint assessment of the Rubis Terminal JV) in 2022. It results from the use of boilers to maintain the temperature of certain products requiring heated storage.

Examples of initiatives

As part of modernisation programmes, the boilers at the Rubis Terminal JV sites are being replaced by heat pumps or mixed systems (heat pumps and boiler) or, local conditions permitting, by greener heating systems (geothermal for instance).

DIVERSIFICATION OF OUR HISTORICAL ACTIVITIES

Rubis Énergie

In line with its DNA, the Group favours a decentralised approach to identifying solutions adapted to the specific characteristics of each local environment (climatology, vehicle fleet, etc.). These projects are being developed around the three following themes:

•   offering hybrid solutions: solarisation of facilities (with or without storage), in addition to the use of other energy sources;

•   offering biofuels;

•   mobility (electric vehicle charging stations, for instance).

Some subsidiaries have already launched projects to diversify their activities and market fuels with a less carbon-intense life cycle.

Exploration of locally produced low-carbon solutions

Rubis Énergie develops solutions adapted to the regions where it operates with a view to making local production of low-carbon energy from inputs, residues or waste collected locally both feasible and accessible.The sustainability thus targeted is of great value in terms of the energy independence of these regions, the increase in skills in the immediate vicinity of the places of consumption, as well as a sometimes significant impact on the country’s trade balance.

For example, the Rubis Energy Jamaica subsidiary welcomed a renewable energy expert from HDF Energy in 2022. This expert aims to help supervise the prospecting, identification and design of large-scale energy projects combining renewable energy and hydrogen storage.

Renewable energy production at the Martinique refinery

SARA has chosen to capitalise on the advantages of its geography and industrial process to diversify its activities in the area of renewable energy.

A true laboratory in the field of energy transition, SARA has for several years been developing projects to convert the hydrogen produced by its activities into green electricity (ClearGen) and to build a photovoltaic power plant to supply decarbonised electricity to around 3,000 residents in Martinique. SARA is actively playing its role in the fight against climate change through new projects. Biogas production projects in French Guiana are continuing: Hydrane, a project to cultivate aquatic biomass on large abandoned cultivable areas, and Hyguane, whose purpose is the pilot production of green hydrogen for space and mobility. SARA is just as active in the other regions of its scope with the launch of two pilot projects for the production of green hydrogen in Martinique and Guadeloupe. SARA also wants to be part of the sustainable mobility initiative in the French Antilles, in particular with the introduction of the first hydrogen car in Martinique and Guadeloupe to raise awareness among our stakeholders about other energy vectors.

Rubis Terminal JV

The Rubis Terminal JV is gradually diversifying its activities by developing the mix of products stored in its terminals.

In 2022, fossil fuels represented 40% of revenues from stored products (compared to 48% in 2021). Other liquid products, such as biofuels, chemical products, fertilisers, edible oils and molasses, are also stored and represent 60% of the joint venture’s revenue (compared to 52% in 2021 and 40% in 2020).

LNG storage project

Elengy and the Rubis Terminal JV have signed a cooperation agreement to launch studies on the installation of an LNG storage facility at the Reichstett terminal (Bas-Rhin). The objective is to meet the retail LNG needs of central-western Europe for road and river transport, and for industry.

DEVELOPMENT OF NEW ACTIVITIES IN RENEWABLE ENERGIES

In April 2022, Rubis announced the acquisition of Photosol, allowing it to accelerate its transition to renewable energies and decarbonisation. With a capacity of more than 500 MWp in service and ready to build at the end of 2022, as well as 3.5 GWp of projects under development, Photosol is one of the leading independent developers of photovoltaic electricity in France, with the target of reaching more than 1 GWp of installed capacity by 2026 and 2.5 GWp by 2030.

These activities are grouped within a new division, Rubis Renouvelables.This division is dedicated to the development of renewable or low-carbon energies, in addition to Rubis Énergie’s historical Support & Services and Retail & Marketing activities, as well as the Storage operated by the Rubis Terminal JV. This new division is expected to represent 25% of the Group’s EBITDA in the medium term.

In addition, the collaboration with HDF Energy (in which Rubis SCA holds an 18.5% stake) is continuing on various projects after the start-up of operations of ClearGen (1 MWp fuel cell at the SARA refinery) and the stake in the West Guyana Power Plant (CEOG). Thus, Rubis Énergie acquired a 51% stake in the joint venture developing the Renewstable® concept in Barbados (RSB project) aimed at ensuring the stable production of 12MW of solar energy during the day and in the evening and 3MW of power at night.The Group is leading the project contributing the most to date in baseline production, at 7%, to the Barbados government’s 2030 target of achieving 100% renewable electricity on the island.

MEASURES AIMED AT CONSUMERS

Aware that customer use of the fuels it distributes generates CO2 emissions, Rubis Énergie implements initiatives aimed at encouraging consumers to make better use of these products in their day-to-day lives. In 2022, 48% of our business units organised an energy efficiency awareness campaign for our customers.

For several years now, initiatives aimed at customers, professional and individuals have been carried out:

•   supporting consumers in energy saving programmes, in particular through information and awareness-raising initiatives about energy consumption habits;

•   raising customer awareness of Rubis’ renewable products: in the Channel Islands, numerous advertisements are published in several local publications to increase awareness among the island’s residents of products such as renewable diesel, renewable fuel oil and solar energy. Rubis Énergie’s subsidiary thus promotes the environmental performance of HVO among both professional and individual retail customers;

•   promoting the use of liquefied gas as a transitional energy: liquefied gas is an integral part of the energy transition, particularly in emerging countries where a significant portion of the population is energy insecure.The characteristics of LNG make it possible to respond to concerns about energy access while preserving against massive deforestation by replacing wood charcoal. Some 20 Rubis Énergie subsidiaries are positioned on the liquefied gas distribution market (bottled and bulk) and encourage its use as a substitute for the most CO2-emitting energies, such as fuel oil for heating and wood or charcoal for cooking. In 2022, liquefied gas accounted for nearly 23% of the volumes of products sold by Rubis Énergie.

For example, in Madagascar, more than 97% of households still rely on firewood and charcoal for cooking energy.To stop the massive deforestation this entails, the Malagasy government has identified various measures, including the use of alternative energies.

Vitogaz Madagascar takes part in this energy policy by promoting the use of bottled liquefied gas and by facilitating household access to this product. The extension of retail gas outlets has thus removed one of the barriers to the purchase of liquefied gas cylinders. Carrying on from prior initiatives, Vitogaz Madagascar distributed over 5,000 Fatapera kits (a portable stove for cooking that attaches directly to the gas cylinder). In addition, awareness-raising operations on access to gas were carried out with the Ministry of the Environment and Sustainable Development, the Ministry of Economics and Finance, as well as with various companies.

In terms of consumer awareness, Vitogaz Madagascar continued to produce culinary television programmes with chefs cooking using gas, also highlighting the culinary heritage of the various regions of the country.

In addition, Vitogaz France, Vitogas España, Rubis Energia Portugal and Vitogaz Switzerland continue to promote the use of liquefied gas as fuel. A vehicle running on LPG emits up to 20% less CO2 than a petrol vehicle and practically no pollutants (particles, sulphur dioxide SO2 or nitrogen oxides NOx) (see boxed text on pollutant emissions in section 4.2.2.2).

Quantitative data on CO2 emissions linked to customers’ use of products sold by the Group are included in the “Greenhouse gas emissions” table set out in section 4.3.4.2.

CONTRIBUTION TO GLOBAL NEUTRALITY

In 2022, several projects aimed at contributing to global neutrality were launched or studied, in regions where the local involvement of subsidiaries is high. Prioritising decarbonisation over carbon offsetting, Rubis Énergie is increasing its expertise in the development of carbon projects with high regional added value. The objective is to increase the impact of its actions through the lever of carbon finance. This is based on revenues from the resale of high value-added credits (blue carbon, high local content, multiple co-benefits) generated by certified carbon sequestration actions.The subject is to ensure sustainability in all these aspects while having a positive impact on the climate.

For example, in Madagascar, the Vitogaz Madagascar and Galana subsidiaries are coordinating, on behalf of Rubis Énergie, the sole financier of the plot, a mangrove replanting project in the province of Mahajanga. The plantings are carried out by a local intermediary, a social enterprise with strong regional roots and involving local populations throughout the project. In 2022, 35 hectares of mangrove trees were planted in this way, out of a total 313 hectares planned. In addition to regional challenges, one hectare of mangrove will capture around 10 times more CO2 than one hectare of terrestrial forest, due to its specific characteristics. Furthermore, endemic biodiversity will be redeveloped there.

In Corsica, Vito Corse studied the feasibility of its participation in a Posidonia seagrass transplant project, led by GIS Posidonies and the University of Corsica. Posidonia meadows are veritable carbon sinks, fixing around 5.2 t CO2 eq. per hectare per year, in addition to the existing stock of around 2,600 t CO2 eq. Funding for this project will begin in 2023.

Lastly, Eres Togo financed the local planting of 32 hectares of mangroves in 2022, i.e., 24 hectares more than requested by the government as part of the environmental certificate.

4.3.4 Objectives and indicators

To address these risks and define its transition trajectory, Rubis follows the “measure, reduce, contribute to planetary neutrality” approach.To better assess our carbon footprint, we have been undertaking a comprehensive greenhouse gas emissions assessment of our activities since 2019. The scope covered includes the activities of the Rubis Terminal JV, as well as products sold, so as to identify the most effective means available to us of reducing our footprint. Initially, the assessment was carried out in accordance with the methodology designed by the Ademe (Agence de l’environnement et de la maîtrise de l’énergie), based on the recommendations of ISO 14064-1 (see the methodology note contained in section 4.6.1.1 for more details on the reporting scope), and was carried out in the first year with the support of an Ademe-certified firm that trained Rubis’ teams in carbon accounting. In 2021, the Group reassessed its greenhouse gas emissions in strict compliance with the GHG Protocol. The refinement of this methodology and the consolidation of new subsidiaries led the Group to revise the results for 2019, which are used as the baseline for setting the Group’s CO2 emission reduction targets. The changes made are described in the notes to the emissions table.

Greenhouse gas emissions are accounted for across three scopes:

•   scope 1: direct emissions from fixed or mobile facilities located within the undertaking’s organisational scope;

•   scope 2: indirect emissions related to the production of electricity and heat and cold used;

•   scope 3: other indirect emissions generated by third-party activities upstream or downstream of the undertaking’s activities. These emissions are presented in two distinct categories, scope 3A (outsourced upstream and downstream transport of products, travel, purchases of goods and services, upstream electricity, non-current assets, waste) and scope 3B (emissions generated by the use of products sold).


It should be noted that the impact of the Group on greenhouse gases is limited to carbon impact, since greenhouse gas emissions other than CO2 are insignificant, or even non-existent. Contrary to other players in the oil and gas sector, Rubis does not have any extraction activities, which emit methane.

Regarding Rubis Photosol’s Photovoltaic Electricity Production activity, acquired in April 2022, the completion of its carbon footprint assessment is scheduled for 2023, in line with the GHG Protocol.

4.3.4.1       Climate objectives

The Group gradually and methodically defines its CO2 emission reduction goals. Ultimately, the objective is to reduce the carbon footprint of all scopes.

Rubis Énergie has developed an action plan to reduce its CO2 emissions. The plan was designed after extensive consultation with subsidiaries and functional departments, with the support of consultants specialised in each of the Company’s key business lines (land transport, shipping, refining, storage site management). Emission reduction objectives have been progressively and methodically defined on the basis of this consolidated action plan, which is defined for the 2019-2030 period. They were communicated in the CSR R oadmap, Think Tomorrow 2022-2025, published in September 2021 and for which a progress report is published each year.

In order to share its efforts and for the sake of transparency, the Group has completed the CDP’s Climate Change questionnaire since 2021 and maintained its B rating for its second reporting year.

RUBIS ÉNERGIE

Reduce the CO2 emissions from our operations

30% reduction in scopes 1 and 2 emissions by 2030 (Rubis Énergie scope, 2019 baseline, constant scope, in compliance with the GHG Protocol)

The levers identified to achieve this target are based on initiatives by Rubis Énergie and its subsidiaries, but also on technological and regulatory advances.

This target was supplemented in 2022 by a target for scope 3A (excluding products sold): a 20% reduction by 2030 in scope 3A emissions (Rubis Énergie scope, 2019 baseline, covering outsourced shipping and road transport, i.e., 45% of scope 3A).

The levers identified to meet this objective notably relate to fleets of vehicles and vessels used to transport imported and/or sold products (use of biofuels, fleet renewal, journey optimisation, slow-steaming) and, to a lesser extent, best practices in environmentally friendly driving.

Reducing the carbon intensity of our products

The Group planned to define a target for reducing the carbon intensity of products sold in 2022. Nevertheless, as the acquisition of Photosol led to a change in the product mix sold, through the integration of new activities, the definition of this objective was postponed.

Raising customer awareness

In 2022, 48% of our business units organised an energy efficiency awareness campaign for our customers.

RUBIS TERMINAL JV

The Rubis Terminal JV formalised and published a roadmap containing its targets for 2025 and 2030, expressed in carbon intensity (ratio of kg CO2 to throughput out (i.e., per tonne of product leaving the joint venture’s terminals)) by type of depot (for the figures reported in respect of 2022, see section 4.3.4.2).

4.3.4.2       Greenhouse gas emissions

(in kt eqCO2) 2022 2021 2020 2019
Scope 1(1) Direct greenhouse gas emissions
Retail & Marketing 35 36 31 30
Support & Services (refining/shipping) 200 160(3) 178(3) 214(3)(6)(7)
TOTAL SCOPE 1 RETAIL & MARKETING/SUPPORT & SERVICES 235 196 209 245
Rubis Terminal JV – Group share(2) 7.9 10.8 10 NA
Scope 2(1) Indirect emissions linked to energy consumption at sites
Retail & Marketing 4.8 5.4(4) 5.1(4) 6.1(4)
Support & Services 5.0 5.6 1.8 1.4
TOTAL SCOPE 2 RETAIL & MARKETING/SUPPORT & SERVICES 9.8 10.9 6.9 7.6
Rubis Terminal JV – Group share(2) 3.6 4.7 3 NA
TOTAL SCOPES 1 AND 2 RETAIL & MARKETING/SUPPORT & SERVICES 244.8 206.8 216 252.3
TOTAL SCOPES 1 AND 2 GROUP SHARE 256.3 222.3 229 NA
Scope 3(1) Other indirect emissions
Retail & Marketing/Support & Services 13,259 13,050(4)(5)(6) 12,427(4)(5)(6) 13,762(4)(5)(6)
  of which use of products sold for final use by customers (category 11) 13,034 12,867 12,259 13,570(8)
Rubis Terminal JV – Group share(2) 519.8 561 355 NA
TOTAL SCOPE 3 GROUP SHARE 13,779 13,611 12,782 NA
(1) See breakdown of items calculated for each of scopes 1, 2 and 3 in the description of methodology contained in section 4.6.3.
(2) Share based on the Group’s shareholding, i.e., 55%.
(3) Restatement due to an increase in scope through the integration of the Asphalt Teranga vessel into the Rubis Énergie fleet.
(4) Restatement due to material errors.
(5) Restatement due to changes in accounting method for emissions related to Spot Charters following the harmonisation of methodologies with those of Sea Cargo Charters.
(6) Restatement due to the increase in the organisational scope of the carbon footprint assessment (acquisition of subsidiaries).
(7) Restatement due to material data accounting errors (SARA, marine fuel consumption in the Bahamas, Galana shareholding rate correction, etc.).
(8) Restatement following the adjustment to the shareholding rate applied to Galana.


* Emissions are included in the geographical regions to which they are assigned (Europe, for mainland France, the Caribbean for Guadeloupe, Martinique and French Guiana, and Africa for Réunion Island).

Generally speaking, the energy consumed by the Group’s industrial facilities (electricity, steam, fuels) contributes to the proper day-to-day functioning of the industrial facilities, including safety equipment (fire motor pumps, emergency generators, etc.).

With regard to emissions linked to the use of products sold, Rubis Énergie (and the Rubis Terminal JV to a very marginal extent) distributes petroleum products that emit CO2 when used by customers. This item constitutes the principal source of the Group’s CO2 emissions and almost all scope 3 emissions, although in 2021, 52% of gross profits resulted from sales of liquefied gas and bitumen, which are products that emit little to no CO2 in use and correspond to 14% of the Group’s total emissions.

In 2022, an 18% increase in scopes 1 and 2 emissions (i.e., +38 kt) was observed. It is due in particular to the complete restart of the refinery (+30 kt). The remainder is the result of an increase in activity and the occasional use at Ringardas (Nigeria) of petroleum fuels instead of natural gas over a period during the year, resulting in increased emissions at certain times. The increase in operating emissions was limited in relation to the increase in the volumes of fuel distributed, reflecting an improvement in the energy efficiency of our operations.This notably reflects the efforts made to modernise the truck and vessel fleets, as well as a further improvement in the energy efficiency of the bitumen facilities. Moreover, for scope 3 excluding products sold (scope 3A), the significant increase in emissions is almost exclusively due to the taking into account of one-off emissions related to the construction of the Bitu River and Demerara vessels (+34 kt compared to 2021) and the mechanical increase in emissions related to the upstream energy consumed directly (in particular SARA). The decrease in scope 1 emissions of the Rubis Terminal JV at constant scope was 14% and 13% for scope 2.

4.3.4.3      Carbon intensity indicators

RUBIS ÉNERGIE

Operations carbon intensity indicator 2022 2021 2020
Tonnes CO2 eq (scopes 1 & 2) / EBITDA x 1,000 0.360 0.375 0.409

In 2021, Rubis Énergie defined a more relevant indicator than that previously used to assess the carbon intensity of its operations. The previous indicator compared scopes 1 and 2 CO2 emissions to volumes of emissions sold in MWh. However, for certain activities, no emissions are linked to the use of products sold. In particular, bitumen sales cannot be converted into MWh because bitumen is not used by our customers for energy (used for road infrastructure projects in particular). Therefore, the indicator did not correctly reflect the variety of Rubis Énergie’s activities and the result of the actions it has taken to reduce the carbon emissions of its operations.

RUBIS TERMINAL JV

A change in method was introduced between 2019 and 2020. The Rubis Terminal JV now considers outgoing product volumes (throughput out) as a reference instead of incoming and outgoing product volumes (throughput in + out) in order to align itself with other financial indicators that also use “throughput out” as a reference.

The Rubis Terminal JV also distinguishes depots according to three categories of activities: fuel distribution depots (36% of the Rubis Terminal JV’s storage capacity); mixed depots (46%) and chemical product depots (18%).

Indicators 2022 2021 2020
Kg CO2 / tonne of throughput out (total all depots) 1.25 1.62 2.04

The reduction in this indicator corresponds, at constant scope, to an improvement across all sites thanks to operations to change the fuel to gas and the optimisation of facilities. At constant scope, the overall reduction in intensity is 15.2%, with the Y-1 reference value excluding Turkey being 1.47.

ENERGY PRODUCTION AND CONSUMPTION AT INDUSTRIAL SITES

  Energy production Energy consumption
(in GJ) 2022 2021 2020 2022 2021 2020
Refining (Support & Services) 577,496 349,630 406,231 1,555,277 1,105,741 1,193,241
Retail & Marketing NA NA NA 551,171 348,950 442,956
Rubis Terminal JV NA NA NA 318,798 423,631 363,155
  of which Group share NA NA NA 175,338 232,997 199,735

The refinery is equipped with a cogeneration combustion turbine for producing electricity (3.5 MW) and superheated steam (9 t/h); two boilers also produce superheated steam, a main boiler (22 t/h) and a secondary boiler (15 t/h). In 2022, the aggregate volume of energy produced (electricity and steam) represented 37% of the energy consumed over the period, which was stable compared to 2021.

The Retail & Marketing activity does not produce energy, or only very marginally. A solarisation programme applicable to our sites and service stations is in progress (total installed capacity of 328 kWp as of 31 December 2022).

In 2022, the energy sources for Rubis Énergie’s buildings were natural gas, LPG, heating oil, diesel, biofuel, electricity supplied by the grid and on-site photovoltaic facilities and a heating network.

In 2022, the net energy consumption of the Rubis Terminal JV sites decreased compared to that of 2021, representing a decrease of 11% at constant scope. Despite the moderate increase of 2% in throughput in 2022, there was a general decrease in electricity consumption, due in particular to a change of contract in Rotterdam and the suspension of the bunkering activity, leading to the shutdown of a blending compressor and a vapour treatment unit that generated very high consumption.

The sharp increase in the prices of all energies has accelerated investments aimed at reducing our consumption.

4.3.5 TCFD correspondence table

In 2017, the Task Force on Climate-Related Financial Disclosures (TCFD) of the G20’s Financial Stability Board published its recommendations on climate-related information to be published by companies.

Theme   TCFD’s recommendations   Source of information
in Rubis reporting

Governance

Disclose the organisation’s governance around climate-related risks and opportunities.


  Describe the Board’s oversight of climate-related risks and opportunities.

  Describe Management’s role in assessing and managing climate-related risks and opportunities.

  URD 2022 – section 4.3.1 CDP C1.1
  URD 2022 – section 4.3.1 CDP C1.2

Strategy

Disclose the actual and potential impacts of climate-related risks and opportunities on the organisation’s businesses, strategy, and financial planning where such information is material.


  Describe the climate-related risks and opportunities the organisation has identified over the short, medium, and long term.

  Describe the impact of climate-related risks and opportunities on the organisation’s businesses, strategy, and financial planning.

  Describe the resilience of the organisation’s strategy, taking into consideration different climate-related scenarios, including a 2°C or lower scenario.

  URD 2022 – section 4.3.2 CDP C2.2
  URD 2022 – section 4.3.2 CDP 3.3


Risk management

Disclose how the organisation identifies, assesses, and manages climate-related risks.


  Describe the organisation’s processes for identifying and assessing climate-related risks.

  Describe the organisation’s processes for managing climate-related risks.

  Describe how processes for identifying, assessing, and managing climate-related risks are integrated into the organisation’s overall risk management.

  URD 2022 – section 4.3.3 CDP C2.1
  URD 2022 – section 4.3.3 CDP
  URD 2022 – section 4.3.3 CDP C2.2

Metrics and targets

Disclose the metrics and targets used to assess and manage relevant climate-related risks and opportunities where such information is material.


  Disclose the metrics used by the organisation to assess climate-related risks and opportunities in line with its strategy and risk management process.

  Disclose scope 1, scope 2, and, if appropriate, scope 3 greenhouse gas (GHG) emissions, and the related risks.

  Describe the targets used by the organisation to manage climate-related risks and opportunities and performance against targets.


  URD 2022 – section 4.3.4 CDP C6
  URD 2022 – section 4.3.4 CDP C6
  URD 2022 – section 4.3.4 CDP C4.1

4.4 Attracting, developing and retaining talents

Mindful that employee commitment is key to the Group’s success, Rubis ensures that individuals have the opportunity for professional development, with the aim of attracting, developing and retaining its talents. To do so, Rubis focuses its efforts on promoting diversity and equal opportunities (section 4.4.1), employee skills development (section 4.4.2), health, safety and well-being at work (section 4.4.3) and involving employees in the Group’s value creation (section 4.4.4).

Group risk mapping has identified the main human resources risks related to the Group’s activities. These risks mainly concern the health and safety of employees and external service providers working at Group sites. Apart from these risks, a key challenge relating to human resource management was identified by the relevant Management in each division: attracting, developing and retaining talent while the Group grows and where human resources must be adapted to Rubis’ development strategy. This challenge is dealt with in this chapter.

In line with its corporate culture and in order to make the most of its human capital and better address the specificities involved in the Group’s activities, the deployment of Rubis’ human resources policy has been decentralised. Rubis Énergie and its subsidiaries, Rubis Renouvelables and its subsidiary Rubis Photosol, as well as the Rubis Terminal JV, manage their human resources autonomously in line with Rubis’ values and implement local actions adapted to their needs and challenges.

In addition, in order to support skills development and foster internal mobility, a project relating to establishing a process for identifying and supporting Talents was launched in Rubis Énergie at the end of 2021. Interviews with the Group’s key players were carried out and a Steering Committee was created bringing together Group employees from various functions, activities and business lines. These steps made it possible to define a notion of “Potential” and “Talent” that can be applied in all the Group’s territories and activities, as well as to validate common detection and identification criteria. Following a validation phase of these processes at the end of 2022 via the “pilot” subsidiaries, the rollout of this system across all Rubis Énergie entities began in the first quarter of 2023 and will then be renewed annually.

Employee status and fluctuations in numbers

As of 31 December 2022, the Group had 4,498 employees, including 573 at the Rubis Terminal JV. Within Rubis Énergie, headcount increased in the Europe zone in particular (+4%). The 112 employees of Rubis Photosol, acquired in April 2022, are included in the Group’s headcount and in all social data for 2022 (excluding training data).

The Group’s shipping activity requires the use of crews who are hired through interim agencies or under a limited term employment agreement. As of 31 December 2022, the headcount of crew members who had signed an employment contract with a Group entity (under international temporary contracts) or with an interim agency, stood at 225. These non-permanent employees are not taken into account in the published social metrics. However, Rubis is particularly careful to ensure that the working conditions of these crews comply with the ILO (International Labour Organization) conventions applicable to them (see section 4.5.1.1). In 2022, no non-compliance was reported during the external audits carried out on compliance with the Maritime Labour Convention.

CHANGE IN PERMANENT EMPLOYEES BY DIVISION AND BY REGION

Number of employees 31/12/2022 31/12/2021 31/12/2020 2021/2022
change
Rubis Énergie (Retail & Marketing/Support & Services)(1) 3,788 3,685 3,669 +2.8%
Europe 707 680 672 +4%
Caribbean(2) 1,263 1,242 1,322 +1.7%
Africa 1,818 1,763 1,675 +3.1%
Total France (including French overseas departments, territories and collectivities) 737 730 729 +1%
Rubis SCA/Rubis Patrimoine (France) 25 24 24 +4.2%
Rubis Photosol (France) 112 NA NA NA
TOTAL 3,925 3,709 3,693 +5.8%
Rubis Terminal JV(3) 573 626 449 -8.5%
•  of which France 305 296 282 +3%
TOTAL INCLUDING THE JV 4,498 4,335 4,142 +3.8%
(1) Employees in France are included in the headcount of the regions to which they are assigned (Europe, for mainland France, the Caribbean for Guadeloupe, Martinique and French Guiana, and Africa for Réunion Island).
(2) Previously, non-permanent employees (vessel crews) were accounted for in the Caribbean headcount. In the context of the restructuring of its CSR approach, Rubis decided to put in place differentiated monitoring indicators in order to take the specificities of managing these teams in to account.
(3) Significant increase between 2020 and 2021 due to the integration of the Tepsa subsidiary (167 employees). Decrease between 2021 and 2022 due to the exit of Rubis Terminal Petrol.

4.4.1 Promoting diversity and equal opportunities / NFIS/


Diversity and inclusion are part of the Group’s DNA. They are an asset to the Company and key to the effectiveness of its teams.The Group is committed to ensuring that there is no discrimination based on origin, religion, gender or sexual orientation, health status and/or disability, political views, religious beliefs or family status. These values are clearly stated in the Group’s Code of Ethics. To ensure that each individual is protected against discrimination, a whistleblowing system (Rubis Integrity Line) has been rolled out across the entire Group so that any situation undermining the Group’s values and those of its subsidiaries can be reported. The Integrity Line allows all Group employees as well as external and temporary workers to securely report any alerts via a website (see section 4.5.1.1).

Since combatting discrimination is a major issue in the area of employment, the Group has set itself the target of there being zero proven reports of discrimination, notably through the application of its ethics hotline.

4.4.1.1       Gender equality

RISKS

The Group mainly carries out its activities in an industrial environment in which men have historically been the majority. In line with its principles of non-discrimination and convinced that the lack of diversity is detrimental to the creation of value, the Group has taken initiatives to help talent to flourish without any gender distinction.

GENDER BREAKDOWN WITHIN THE GROUP AS OF 31/12/2022

Rubis Group (including the Rubis Terminal JV) Rubis Group (excluding the Rubis Terminal JV)
   

MEASURES TAKEN TO IMPROVE GENDER EQUALITY IN THE WORKPLACE

Measures to improve professional equality between men and women are progressively being implemented within Group entities. For example, Rubis Énergie’s Jamaican subsidiary (Rubis Energy Jamaica) is one of the first companies in the English-speaking Caribbean to have committed, in March 2019, to the gender equality certification process devised by the United Nations Development Programme (Gender Equality Seal). This certification includes the following objectives:

•   eliminating gender-based pay gaps;

•   increasing the role of women in decision-making;

•   improving work/life balance;

•   improving women’s access to traditionally male jobs;

•   eradicating sexual harassment in the workplace;

•   communicating in a more inclusive, non-sexist, way.

Company agreements promoting the inclusion of women and gender equality in the workplace have also been entered into in some of the Group’s subsidiaries and complement existing measures in the area of fighting against discrimination in hiring, the promotion of equal pay, career development, etc.

For instance, Vitogaz France entered into a company agreement aimed at facilitating women’s access to positions of responsibility, neutralising the impact maternity/adoption leave periods have on professional evaluation and career development and, lastly, balancing work and family obligations.

In 2021, SRPP (Réunion Island) renewed its company agreement with four objectives (which are monitored by defined quantitative indicators) aimed at promoting professional equality between men and women:

•   achieving an equal percentage of review of individual situations by gender over the term of the agreement;

•   ensuring equal access to training for both men and women;

•   when recruiting for permanent, fixed-term or temporary contracts, presenting at least one female candidate in predominantly male sectors (at gas filling plants for example); likewise, presenting at least one male candidate in predominantly female sectors (administrative and accounting services for instance);

•   100% of employees will have an interview with their Manager upon return from maternity or parental leave and 100% of requests for paternity leave will be granted on first request and on the dates selected by the employee.

Communication campaigns were also launched to highlight women’s involvement in the Company and to help combat gender stereotyping in the workplace. For example, the Rubis subsidiary operating in the eastern Caribbean (Rubis Caribbean) is actively involved in the international Women’s History Month campaign, which consists of putting the spotlight on women’s contributions to historical events and contemporary society by publicly recognising the work done by its female employees.

In 2019, SARA launched the “NO to Sexism” campaign at all its sites. Since then, a series of actions regularly remind Group employees and employees of outside companies that sexism in any form whatsoever will not be tolerated. Through real-life scenes, a team of actors first helped each participant to understand what sexist behaviour is and how serious it is. Articles are regularly published on the subject. To go further, a leaflet has been distributed to remind everyone of the law on the subject and the penalties incurred.

On 8 March 2022, many subsidiaries mobilised to celebrate International Women’s Day with the theme “Equality today for a sustainable future”. For example, Galana (Madagascar) organised a reception followed by a film and relaxation session for all its female employees. At Rubis Énergie Djibouti, a fun time was organised and General Management personally thanked its female employees for the quality of their work, their reliability and their daily dedication. Dinasa (Haiti) organised a discussion-debate on the theme “Women’s leadership, a driver of development, towards responsible gender equality”, a moment of discussion that enabled Management to congratulate its employees and commit to continuing to work towards the gender equality objective by promoting the hiring of women. In South Africa, the World LPG Association organized an event attended by many young women from different companies in the sector. An employee of the Easigas subsidiary was rewarded for her professional success. She explained, through an inspiring speech, her rise from graduation, working as a receptionist in her youth, to the position as Bulk Transport Manager she currently holds within the Group.

The Group’s subsidiaries encourage the hiring of women in our male-dominated professions and fight against all forms of discrimination and sexism, in particular by ensuring that their recruitment processes, compensation policies and career management provide everyone with the same opportunities.

A company agreement was renewed within the Rubis Terminal JV in 2017. The agreement focuses on hiring, training and career development through the use of monitoring indicators. A report is presented to the central Economic and Social Council every year. The situation is positive, particularly in terms of training. The Rubis Terminal JV has set itself the target of achieving 40% women on the Group’s Executive Committee by 2030.

RESULTS

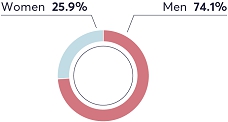
The number of women employed by the Group was up 5.5% in the financial year (1,167 female employees as of 31 December 2022, compared to 1,106 as of 31 December 2021). Women employees account for 25.9% of the total headcount.

At Rubis SCA (the parent company), the majority of management positions (senior executives) are held by women.

At the Group level, 35.5% of all management positions (senior executives and managerial personnel) are held by women, i.e., a higher proportion than their percentage of total workforce. The percentage of women holding managerial or senior executive posts (30.9%) is also markedly higher than the percentage of men with equivalent responsibilities (19.6%).

  2022 2021 2020
  Non-
executives
Executives Senior
executives
Non-
executives
Executives Senior
executives
Non-
executives
Executives Senior
executives
Women 23.1% 37.8% 29.7% 23.1% 37.9% 27.7% 23.5% 36.9% 23.6%
Men 76.9% 62.2% 70.3% 76.9% 62.1% 72.3% 76.5% 63.1% 76.4%
HEADCOUNT 3,475 783 283 3,465 621 249 3,325 597 233

NB: Data incudes the Rubis Terminal JV. Figures excluding the Rubis Terminal JV are presented in the table at the end of this section 4.4.

At the level of the governing bodies:

•   50% of the members of the Group Management Committee, which has six members, are women;

•   women sitting on the Management Committees within Rubis Énergie and its subsidiaries represented 28.6% of those Committees’ membership on average as of 31 December 2022 (compared to 27.4% in 2021 and 24.6% in 2020), including two female General Managers of subsidiaries in Rwanda and Cameroon. A woman is also Managing Director of the Gabon subsidiary, which is not included in the above-cited rate given the size of the entity, which does not have a Management Committee;

•   the Rubis Photosol Management Committee was composed of 20% women as of 31 December 2022.

GENDER EQUALITY INDEX FOR FRENCH COMPANIES

To compare pay gaps between men and women in France, a professional equality index has been phased in for French companies with more than 50 employees by French law no. 2018-771 of 5 September 2018 on the freedom to choose one’s professional future.

This index, which is scored out of 100, is calculated on the basis of four or five criteria, depending on the size of the Company’s workforce:

•   pay gap between men and women (40 points);

•   difference in the rate of individual pay rises between men and women (35 points for companies with fewer than 250 employees; 20 points for companies with more than 250 employees);

•   difference in the male/female promotion rate (15 points, only for companies with more than 250 employees);

•   share of female workers receiving a pay raise following maternity leave (15 points);

•   number of women represented in the top 10 compensation packages (10 points).

The headcount at the Group holding company, Rubis SCA (which includes those of Rubis Patrimoine for the purposes of monitoring social indicators), does not allow the index to be calculated on a voluntary basis (headcount below the required thresholds).

Rubis Énergie: the gender equality indices of the four French companies concerned were published in 2023, two of which increased significantly between 2021 and 2022:

•   SRPP (Réunion Island): 94/100 in 2022 (identical to 2021) (learn more at www.srpp.re/INDEX%20EGAPRO%20SRPP%202023.pdf);

•   SARA (French Antilles): 92/100 in 2022 (vs 81/100 in 2021) (learn more at www.sara-antilles-guyane.com/notre-demarche-rse/);

•   Vitogaz France: 86/100 in 2022 (identical to 2021) (learn more at www.Vitogaz.com/Vitogazvous/rse/index-egalite-professionnelle-femme-homme);

•   Rubis Antilles Guyane: 96/100 in 2022 (vs 81/100 in 2021) (learn more at www.rubis-ag.fr/egalite-pro ).

For the Rubis Terminal JV, its French subsidiary reported a score of 88/100 in 2021. It reached 99/100 in 2022 (learn more at https://www.rubis-terminal.com/).

In addition, in 2022, Maritec Tanker Management Pvt Ltd (MTM PL), a subsidiary of Rubis Énergie, integrated two women sailors into its workforce for the first time. They joined the Morbihan vessel, recently acquired by the Group.

4.4.1.2 Geographical diversity

Operating in over 40 countries and with more than 68 nationalities in its workforce, Rubis is keen to capitalise on the rich cultural diversity of its employees and make an impact in the regions in which it operates. Employees are split equally between Africa, the Caribbean and Europe in terms of activities. In order for this cultural diversity to be reflected in corporate culture and management, when acquiring foreign subsidiaries, the Group tries to retain and/or hire local employees for their experience and knowledge of the country: more than 98% of Group employees are hired locally. Thus, only two positions are generally occupied by expatriates in subsidiaries, those of General Managers and Chief Financial Officer. The percentage of expatriates on the subsidiaries’ various Management Committees was 18.6% in 2022 (20.7% excluding the Rubis Terminal JV).

GEOGRAPHICAL BREAKDOWN OF EMPLOYEES

    2022   2021   2020
Africa   40.4%   40.7%   40.4%
Caribbean  28.1%   28.3%   31.9%
Europe   31.5%   31%   27.7%

NB: Data incudes the Rubis Terminal JV. Figures excluding the Rubis Terminal JV are presented in the table at the end of this section 4.4.

4.4.1.3 Intergenerational diversity

The Group’s age pyramid shows that the Group has broad intergenerational diversity in its headcount, which greatly enhances the experience of its teams and the transfer of knowledge. Each age group is represented in a relatively equal way, without any significant variations between business lines and regions. The Group has set up an active training policy in order to anticipate the retirement of senior employees. Furthermore, the Group contributes to the integration of young people into the job market by recruiting interns, students under apprenticeship or professionalisation contracts and recent graduates.

BREAKDOWN OF EMPLOYEES BY AGE GROUP

  31/12/2022 31/12/2021 31/12/2020
  < 30
years
Between
30 and 39 years
Between
40 and
49 years
50
years
< 30
years
Between
30 and
39 years
Between
40 and
49 years
50
years
< 30
years
Between
30 and
39 years
Between
40 and
49 years
50
years
Rubis SCA/Rubis Patrimoine 12% 16% 36% 36% 8.3% 20.8% 37.5% 33.3% 12.5% 29.2% 33.3% 25.0%
Rubis Énergie (Retail & Marketing/ Support & Services) 11.9% 32.2% 30.8% 25.1% 12.1% 33.0% 30.2% 24.7% 13.4% 34.6% 29.5% 22.5%
Rubis Photosol 50% 29.5% 16.1% 4.4% NA NA NA NA NA NA NA NA
TOTAL EXCLUDING THE JV 13% 32% 30.4% 24.6% 12.1% 32.8% 30.3% 24.8% 13.4% 34.6% 29.5% 22.5%
Rubis Terminal JV 11% 25.1% 32.6% 31.3% 10.6% 25.2% 35.6% 28.6% 12.5% 28.0% 32.7% 26.4%
TOTAL INCLUDING THE JV 12.7% 31.1% 30.7% 25.5% 11.8% 31.8% 31.2% 25.2% 13.3% 33.8% 29.9% 23.0%

To retain this intergenerational dynamic and maintain proximity between younger and older employees, Rubis Énergie and the Rubis Terminal JV have introduced practices favouring seniors in France.

Since intergenerational diversity is key to social cohesion between all generations, Rubis Énergie prioritises:

•   anticipating career development;

•   developing skills and qualifications;

•   transmitting knowledge and developing mentoring.

As of 31 December 2022, 34 people on work-study contracts (alternant) and 120 interns worked at Rubis Énergie, as well as three people on work-study contracts and 13 interns at Rubis Photosol.

The Rubis Terminal JV has committed to:

•   keeping employees aged 55 and over in the workforce;

•   training in ergonomics;

•   paying part of the cost of qualifications that certify skills learned through experience.

Regarding young employees, the Group encourages combined work-study programmes, which it views as a very suitable tool for bringing young people into the professional world.

4.4.1.4 Disability

The Group has adopted a policy of openness favouring disabilities, which includes funding associations and institutions working in healthcare as part of its social engagement activities (see section 4.5.2.3).

Within Rubis Énergie, several subsidiaries use supply, subcontracting or service contracts with establishments and services assisting disabled people through work (Établissements et Services d’Aide par le Travail, ESAT) or a company employing a minimum number of disabled employees (Entreprise Adaptée, EA). At the same time, recruitment firms are asked to ensure that each job opening is accessible to people with disabilities.

For example, at Rubis Antilles Guyane, hiring for various leave replacements is conducted through Cap Emploi, which works with individuals with disabilities, allowing integration into the Company and which can lead to permanent employment, if needed.

In South Africa, the law (Employment Equity Act) requires companies to ensure that people with a disability make up at least 2% of their workforce. Individuals with disabilities account for over 4% of Easigas’s workforce.

From 14 to 20 November 2022, SARA observed the European week for the employment of people with disabilities, at all its sites. The Quality of Life at Work Department organised an awareness-raising event on the issue of lifelong, temporary and sudden disabilities. Employees were able to attend visually-impaired lunches, a play called “Conte-moi le handicap” with the El Lobo Bueno association, DuoDays and information workshops. The aim was to change the way people see each other in order to value employees who have disabilities. Employees greatly appreciated the week’s programme, and the various events were very well attended.

At SRPP (Réunion Island), a day to raise awareness of disability was organised on 26 October 2022. Some 30 employees were able to try out various fun activities offered by around 20 specialists in the field of motor, visual, auditory and mental disabilities: tasting and visually-impaired tour, introduction to sign language, creation of paintings, and practising a sport in a wheelchair. These workshops were led by testimonials from people with disabilities who came to share their professional experience in order to convey a strong positive message. The primary objective of this awareness-raising action was to highlight different types of disabilities, but also to communicate and discuss the adaptations necessary to integrate people with disabilities.

In addition, Vitogaz France sought to strengthen its commitments with respect to integrating and maintaining employment for people with disabilities. As part of its desire to promote diversity and equal opportunity, the company has committed to implementing an employment policy for people with disabilities, based on five pillars;

•   facilitating the recruitment and integration of people with disabilities;

•   maintaining employment of people with disabilities;

•   developing training initiatives that will make it possible to achieve or facilitate the integration of disabled workers;

•   integrating ESATs into the company’s purchasing policy as far as possible;

•   raising individual awareness through dynamic communication about how disabilities are perceived.

To carry out these actions, a disability correspondent was appointed in 2021.

The Rubis Terminal JV has also signed partnership agreements with ESATs and sheltered workshops.

For instance, for more than 20 years, the Rubis Terminal JV Company headquarters has been sourcing office supplies and maintenance products from establishments that employ disabled workers under the auspices of the Commission for Rights and Autonomy of People with a Disability (CDAPH).

In order to promote the integration of people with disabilities, by 2023, 100% of the General Management bodies and Human Resources Departments will receive training on the fight against preconceptions about people with disabilities, and by 2025, 100% of our employees will receive awareness-raising on this issue.

4.4.2 Developing skills / NFIS /

RISKS

The Group is convinced of the importance of developing its employees, whether through knowledge enhancement or diversification of experiences. The ongoing improvement of individual skills helps motivate teams, encourages coming up with innovative ideas, and boosts employee efficiency and employability. It also makes Group service quality durable and increases safety at facilities.

In addition, in line with internationally defined development priorities, Rubis is attentive to the consequences of energy transition on the workforce and the creation of decent work and high-quality jobs. The principles of a just transition for workers consist of attractiveness and development of talent, including workers in the just transition process, and supporting and training workers.

To do so, Rubis committed in its CSR Roadmap, Think Tomorrow 2022-2025, to training 10% of employees each year on changes in our businesses (energy transition,CSR, etc.) by 2025.

MEASURES TAKEN

The enhancement of employee skills contributes to the Group’s performance and employee development. It is with this in mind that training objectives have been defined.

An e-learning platform was developed in 2021 and put online in March 2022. The first module is dedicated to preventing corruption. The platform will be supplemented with other training modules as necessary.

Training as a means of moving forward

In accordance with the wishes expressed by employees, the Group invests in general training to upgrade and enhance employees’ skills throughout their careers.

Rubis Énergie and the Rubis Terminal JV have set up a wide range of training courses that are adapted to their own specific challenges:

•   language training;

•   management training;

•   functional training: training in law, customs, pay systems, etc.;

•   training on changes in our business lines (energy transition, CSR, etc.).

Training as a means of preventing risk

Concerned about protecting the physical integrity of its employees while performing their duties, the Group is investing in:

•   health, through providing training in ergonomics for jobs that carry risks to employee health, as well as safety training for different “at risk” jobs aimed at staff and external workers, product training (welding, chemical product handling), workplace first aid and rescue, etc.;

•   industrial safety, with the assistance of professional bodies such as the GESIP (Groupe d’Étude de Sécurité et Chimiques – Group for Safety Research in the Petroleum and Chemical Industries). These training courses are designed to continually improve the safety of people and facilities at industrial sites in an environmentally friendly manner;

•   road safety, to reduce the risk of road accidents in regions with poor quality road infrastructure and/or generally inadequate driver training (defensive driving) (see section 4.2.3.2.1);

•   the environment and quality (incorporation of ISO standards);

•   verifying systems designed to protect facilities (tank maintenance, training in operating fire-fighting systems, etc.);

•   partnerships with providers, such as the Association for Prevention in the Transport of Petroleum Products (Association pour la prévention dans le transport d’hydrocarbures – APTH), which provides training and assistance to safety advisors, the Association of Training in Fuel Trading (Association de formation dans le négoce des combustibles – Asfoneco), the Red Cross, etc.

RESULTS

This year, the number of training hours increased sharply: 81,151 training hours (+32.7% compared to 2021 and +57.3% compared to 2020) were delivered within the Group in 2022, some of which remotely. The number of employees who received training increased by 9.8% compared to 2021 and by 36.2% compared to 2020. The proportion of employees receiving training was 90.1% at Rubis Énergie (Retail & Marketing and Support & Services activities) and 82.6% within the Rubis Terminal JV.

Notably, these training needs were able to be identified during annual reviews. In 2022, 91.3% of employees had a review meeting with their line Manager. In 2022, the number of training hours per employee trained increased by approximately 21% (20.8 hours/employee trained in 2022 vs 17.2 hours/employee trained in 2021).

NUMBER OF TRAINING SESSIONS DELIVERED AND EMPLOYEE BENEFICIARIES

  2022 2021 2020
  Total
number of
training
hours
Number of
benefi-
ciaries
Percentage
of
employees
trained
Total
number of
training
hours
Number of
benefi-
ciaries
Percentage
of
employees
trained
Total
number of
training
hours
Number of
benefi-
ciaries
Percentage
of
employees
trained
Rubis SCA/Rubis Patrimoine 553 21 84% 190 21 87.5% 201 8 33.3%
Rubis Énergie (Retail & Marketing/ Support & Services) 68,040 3,414 90.1% 48,212 3,036 82.4% 42,683 2,504 68.0%
TOTAL EXCLUDING THE JV 68,593 3,435 90.1% 48,402 3,057 82.4% 42,884 2,512 67.8%
Rubis Terminal JV 12,558 473 82.6% 12,740 502 80.1% 8,694 357 79.6%
TOTAL INCLUDING THE JV 81,151 3,908 89.1% 61,142 3,559 81.7% 51,578 2,869 69.1%

In general, risk prevention efforts continued, with 68% of employees trained in health and safety (54% in 2021 and 40% in 2020).

NUMBER OF EMPLOYEES TRAINED IN HEALTH AND SAFETY

   2022  2021  2020
Rubis Énergie (Retail & Marketing/Support & Services)  2,530  1,845  1,383
Rubis Terminal JV  444  501  276
TOTAL  2,974  2,346  1,659

PERCENTAGE OF EMPLOYEES TRAINED IN CHANGES IN OUR BUSINESS LINES (ENERGY TRANSITION, CSR, ETC.) (RUBIS ÉNERGIE SCOPE)

   2022  2021  2020
Rubis Énergie (Retail & Marketing/Support & Services)  28%  NA  NA

4.4.3 Ensuring health, safety and quality of life at work / NFIS /

4.4.3.1 Health and safety

The Group puts personal health and safety at the very heart of its social policy. These risks affect both employees and staff from outside companies, as well as customers and local residents living near sites operated by Group entities. This subject is addressed in section 4.2.3.2.

4.4.3.2 Quality of life at work

RISKS

The Group is conscious of the importance of offering its employees working conditions that allow them to reach their full potential. This is an essential condition for the motivation, cohesion and stability of the teams. It is a performance lever that helps foster long-term employee commitment.

Moreover, employee commitment is very much dependent on the ability of Senior Managers to help new employees settle in, make their teams understand what the Company expects of them, how their work contributes to the Group’s success, to be respectful and attentive to the needs of each individual and to develop the collective intelligence and mutual listening skills required for any relationship built on trust.

Lastly, social protection cover for employees aims to protect them from the potentially significant financial impacts of illness or accidents.

MEASURES TAKEN

Labour relations

Rubis’ relations with all its employees are based on listening, dialogue and mutual respect. Every subsidiary has open and constructive relations with employee representative bodies where they exist (mainly in companies operating in France). Collective agreements notably cover wages and salaries, the company savings plan, incentives, profit-sharing, gender equality and training (see section 4.4.4).

Collective agreements are entered into with the aim of achieving positive outcomes, including with respect to employees’ working conditions and the Company’s economic performance. High-quality labour relations have a direct effect on the success of developments to be made within the Company in order to adapt to an evolving environment.

In France, all Rubis Énergie and Rubis Terminal JV employees are covered by a collective agreement. The employees of Rubis SCA, the parent company, are not covered by a collective agreement due to the small number of employees and the Company’s status as a holding company.

Moreover, numerous measures are unilaterally taken on health and safety issues in accordance with rules established by the Group and after consultation with employee representative bodies.

Rubis Énergie has set the following targets with the aim of maintaining a working environment that is conducive to the well-being of its employees and employee retention:

•   stabilise headcount and jobs at constant scope;

•   keep its absenteeism rate for non-occupational illnesses at under 2%.

Monitoring psychosocial risks

The Group specifically targets the prevention of psychosocial risks, knowing that doing so improves quality of life at work. During the lockdown periods related to the Covid-19 pandemic, which led many Group employees to work remotely, sometimes for long periods in 2020, increased vigilance was paid to employee well-being. Measures, such as regular newsletters, were put in place, as well as training on working in confined spaces or training on preventive measures against the Covid-19 pandemic.

A psychosocial risk assessment is conducted in certain subsidiaries and is updated on a regular basis in order to better prevent against these situations. In addition, to encourage the detection of potential risks, Group employees and external and temporary employees can securely report any harassment via the whistleblowing line that is being rolled out in the Group’s subsidiaries (Rubis Integrity Line) as well as through traditional reporting channels (line management, HR, employee representatives) (see section 4.5.1.1).

Work commitment

The Group encourages initiatives that promote dialogue and team spirit. These include:

•   the organisation of team-building events to foster employees’ team spirit. For example, within Rubis Énergie, many subsidiaries organise end-of-year meals with all employees, sometimes with their families. Sports activities, seminars, after work events, galettes des rois parties and workshops are also organised:

•   at Galana (Madagascar), in December 2022, an HSSE team-building was organised involving around 20 employees from different departments, in particular the first aid team members. The participants were put to the test through fun and cultural activities related to HSSE aspects,

•   Rubis Energia Portugal organised a day of activities for its staff on 27 May 2022. The Rubis Padel Day event consisted of a padel tournament and other sports activities such as pilates, bootcamp, zumba, etc. This event promoted team spirit and celebrated the opportunity to be together after these long periods of lockdown. Employees also had the opportunity to experience Rubis’ values through a flash mob on the Rubis Gas song,

•   on Réunion Island, SRPP organised its traditional convention, after a two-year break due to Covid. Following lunch at a restaurant, the afternoon was punctuated by an escape game on the Saint-Gilles beach, led by a team of actors;

•   the launch of a digital collaborative platform, Rubis Team, to facilitate interaction among Rubis SCA and Rubis Énergie employees working on different continents. This tool streamlined exchanges and encouraged a sense of belonging to the Group, and really proved its effectiveness during the pandemic, which led to long periods of working from home for a large number of employees;

•   the implementation of artistic projects for employees, helping to establish a culture of well-being, stimulate employees’ creativity and improve their working environment;

•   employee involvement in the artistic projects carried out by Rubis Mécénat, the Group’s endowment fund, on or in connection with the Group’s industrial sites (see section 4.5.2.3);

•   involving employees in the realisation of sustainable sociocultural projects. For example, Rubis Mécénat has involved employees in projects such as “Of Soul and Joy” in South Africa (photography programme aimed at young people in townships), the “InPulse” art project in Jamaica (creative visual arts platform), and “Ndao Hanavao” in Madagascar (social design innovation lab) (see section 4.5.2.3);

•   seeking employees’ assistance with community projects. These types of initiatives are conducted locally in most subsidiaries (sponsorship or fund-raising, support for charitable associations and the organisation of local community events, etc.) (see section 4.5.2.3);

•   highlighting employees’ work (celebrating successes at internal events, etc.).

Social protection cover for employees outside France

Mindful of the role that social protection cover can play in combating inequality and the importance of protecting its employees’ health, the Group strives to offer coverage for employees working in countries where coverage is not mandatory.

As of 31 December 2022, 98.3% of the Group’s employees had health coverage, whether mandatory or not. In countries that do not mandate health insurance cover, the subsidiaries have voluntarily set up plans to cover healthcare costs. In addition, 90% of employees benefit from provident insurance thanks to 214 social security or provident insurance agreements in force.

At Rubis Énergie, contributions to private social protection insurance (provident, healthcare) are made at the employer’s initiative for employees working outside France, except in foreign subsidiaries that had implemented such arrangements prior to being acquired by the Group.

Within the Rubis Terminal JV, employer contributions are made to provident and private health insurance funds for employees working outside France.

Organisation of working hours

Not all of the Group’s activities allow for flexible working hours. As activities are varied, the majority of employees working on our industrial sites hold “shift” jobs, thus carrying out a continuous activity with shifts between teams to ensure production (3x8). Managers, on the other hand, who carry out a more traditional office activity, benefit from more flexible working hours.

In addition, the pandemic that affected us in 2020 has created a profound change in the way we approach work and schedules. In France in particular, agreements on teleworking have been signed for categories of employees with suitable jobs.

Percentage of employees covered by company agreements

Sixty-three collective agreements, company agreements or unilateral decisions were signed at Rubis Énergie in 2022, covering more than 1,200 employees. At the Rubis Terminal JV, 50 collective agreements, company agreements or unilateral employer decisions were signed in 2022, covering 305 employees.

RESULTS

Indicators regarding employee turnover and absenteeism are used to assess changes in the labour relations context and the motivation of employees in subsidiaries.

The monitoring of employee turnover shows that the Group maintained a dynamic recruitment policy in 2022. Net job creations (number of new hires less all departures) totalled 147 (including 22 within the Rubis Terminal JV).

EMPLOYEE TURNOVER IN 2022

  Hires Resignations Dismissals Departure
by mutual agreement
  2022 2021 2020 2022 2021 2020 2022 2021 2020 2022 2021 2020
Rubis SCA/Rubis Patrimoine 1 1 3 0 0 1 0 0 0 0 0 0
Rubis Énergie (Retail & Marketing/ Support & Services) 577 488 530 234 172 109 73 70 85 55 46 50
Rubis Photosol 42 NA NA 8 NA NA 4 NA NA 3 NA NA
TOTAL EXCLUDING THE JV 620 489 533 242 172 110 77 70 85 58 46 50
Rubis Terminal JV 87 67 50 28 25 7 8 7 9 8 5 4
TOTAL INCLUDING THE JV 707 556 583 270 197 117 85 77 94 66 51 54

The rate of absenteeism due to non-occupational illness and the rate of unjustified absences remain relatively stable at a very low level, with the exception of the Rubis Terminal JV, where a large number of employees are on leave for long-term illnesses.

ABSENTEEISM NOT RELATED TO AN OCCUPATIONAL ACCIDENT OR ILLNESS*

  Absences not due to occupational illness Unjustified absences
  2022 2021 2020 2022 2021 2020
Rubis SCA/Rubis Patrimoine 0.56% 0.16% 0.32% 0% 0% 0%
Rubis Énergie
(Retail & Marketing/Support & Services)
2.17% 1.81% 1.84% 0.06% 0.05% 0.03%
Rubis Photosol 1.86% NA NA 1.14% NA NA
TOTAL EXCLUDING THE JV 2.15% 1.80% 1.83% 0.09% 0.05% 0.03%
Rubis Terminal JV 7.10% 5.93% 6.07% 0% 0% 0.05%
TOTAL INCLUDING THE JV 2.71% 2.34% 2.06% 0.08% 0.04% 0.03%

* Days lost as a percentage of total working days per year.

4.4.4 Involving employees in the Group’s value creation / NFIS /

RISKS

Failure to involve employees in the Group’s value creation could impact their commitment to work and hence the Group’s performance. For this reason, Rubis seeks to compensate the active contribution by employees to the Group’s economic and financial performance so that they benefit from this value creation, through its compensation policy and/or capital increases reserved for employees.

MEASURES TAKEN AND RESULTS

Wage increases

Employees receive a basic salary and additional compensation based on individual performance (variable salary, bonuses). Basic salaries and wages are regularly reviewed in light of individual performance and changes in the cost of living. For the most part, decisions on pay are decentralised and are made by each operating subsidiary.

In 2022, 64.2% of employees received a pay rise. Regardless of the category (non-executives, executives or senior executives), the rate of employees receiving a salary increase was uniform overall, with a higher proportion for non-managers (66.2%).

PERCENTAGE OF EMPLOYEES RECEIVING A PAY RISE

  2022 2021 2020
  Non-
executives
Executives Senior executives Non- executives Executives Senior executives Non- executives Executives Senior executives
(In %) M W M W M W M W M W M W M W M W M W
By gender 66.3 65.8 62.4 55.7 46 72.6 51.3 51.3 49.2 53.1 36.7 53.6 49.6 58.0 49.1 46.1 47.8 58.2
By category 66.2 59.8 53.9 51.3 50.7 41.4 51.6 50.2 50.2
TOTAL HEADCOUNT 64.2 51 51

NB: Data incudes the Rubis Terminal JV. Figures excluding the Rubis Terminal JV are presented in the table at the end of this section 4.4.

M = Men.

W = Women.

Profit-sharing and incentive agreements

In accordance with French law, Rubis Énergie and the Rubis Terminal JV have introduced incentive and profit-sharing arrangements. Rubis SCA only has an incentive arrangement. In 2022, employees were able to benefit from these schemes.

Employee savings and shareholding plans

Employee shareholding is one of the pillars of the Group’s compensation policy. It strengthens employees’ sense of belonging to the Group and enables employees to be awarded in line with its performance.

The Group’s French subsidiaries have company savings plans. Rubis SCA has also set up a mutual fund (Rubis Avenir) that invests in Rubis shares, through which employees of the Group’s French companies that are at least 50% owned by the Group (including eligible employees of the Rubis Terminal JV) can subscribe for annual capital increases. As of 31 December 2022, Rubis Avenir held 1.66% of Rubis’ share capital.

In 2022, 48.5% of eligible employees took part in this issue (66.3% in 2021).

Incentive plans

The award of long-term incentivising compensation (performance shares, stock options) aims to acknowledge the positive contributions made by certain high-potential Group executives and Senior Managers around the world to implementing the Group’s strategy and to the Group’s growth. This sort of compensation is a human resources tool that allows Rubis to attract and retain talents. The plans involve only a small portion of the capital and are subject to demanding performance conditions. It is important to note that Rubis SCA’s Managing Partners do not benefit from this type of compensation.

The characteristics of these plans and their performance conditions are described in detail in chapter 6, section 6.5.

4.4.5 Consolidated social data – Group scope

    2022   2021   2020   2021/2022
change
Total headcount   4,498   4,335   4,142   +3.8%
Rubis SCA/Rubis Patrimoine  25  24  24  +4.2%
Rubis Énergie  3,788  3,685  3,669  +2.8%
Rubis Photosol  112  NA  NA  NA
Rubis Terminal JV  573  626  449  -8.5%
Headcount by region                
Africa  1,818  1,763  1,675  +3.1%
Caribbean(1)   1,263   1,242   1,322   +1.7%
Europe (excluding the Rubis Terminal JV)  844  704  696  +19.9%
Total France (including French overseas departments, territories and collectivities)(2)   874   754   753   +15.9%
Europe – Rubis Terminal JV  573  626  449  -8.5%
• of which France – Rubis Terminal JV   305   296   282   +3%
Headcount by gender              
Women  1,167  1,106  1,049  +5.5%
•  of which the Rubis Terminal JV   101   119   80   -15.1%
Men  3,331  3,229  3,093  +3.2%
•  of which the Rubis Terminal JV   472   507   369   +6.9%
Headcount by age(3)                
< 30 years  571  513  551  +11.3%
•  of which the Rubis Terminal JV   63   66   56   -4.5%
30 to 39 years  1,397  1,380  1,399  +1.2%
•  of which the Rubis Terminal JV   144  158  125  -9.2%
40 to 49 years  1,378  1,345  1,239  +2.4%
•  of which the Rubis Terminal JV  187  223  147  -16.4%
≥ 50 years  1,144  1,097  953  +4.3%
•  of which the Rubis Terminal JV  180  179  120  +0.3%
Headcount by job category(3)            
Non-executives  3,475  3,465  3,314  +0.3%
•  of which the Rubis Terminal JV  459  512  347  -10.4%
Executives  732  621  597  +17.9%
•  of which the Rubis Terminal JV  66  64  55  +3.1%
Senior executives  283  249  230  +13.7%
•  of which the Rubis Terminal JV  48  50  45(4)  -4%
Non-permanent employees (vessel crews)  225  84  NA  +167.9%
New hires            
Number of recruitments  707  556  583  +27.1%
•   of which the Rubis Terminal JV  87  67  50  +29.9%
Departures            
Resignations  270  197  117  +37.1%
•  of which the Rubis Terminal JV  28  25  7  +12%
Dismissals  85  77  94  +10.4%
•  of which the Rubis Terminal JV  8  7  9  +14.3%
Departure by mutual agreement  66  51  54  +28.4%
•  of which the Rubis Terminal JV  8  5  4  +60%
Absenteeism rate            
Due to illness (non-occupational)  2.71%  2.34%  2.06%  -
•   of which the Rubis Terminal JV  7.10%  5.93%  6.07%  -
Due to occupational illness  0.01%  0.04%  0%  -
•  of which the Rubis Terminal JV  0.10%  0.2%  0%  -
Due to occupational accidents  0.15%  0.07%  0.09%  -
•  of which the Rubis Terminal JV  0.36%  0.17%  0.22%  -
Unjustified absences  0.08%  0.04%  0.03%  -
•   of which the Rubis Terminal JV  0%  0%  0.05%  -
Workplace health and safety            
Occupational accidents with lost time > 1 day not leading to death  45  35  41  +28.6%
•   of which the Rubis Terminal JV  13  8  9  +62.5%
Occupational accidents leading to death  0  1  0  -100%
•   of which the Rubis Terminal JV  0  0  0  0%
Occupational illnesses  1  2  1  -50%
•   of which the Rubis Terminal JV  0  1  0  -100%
Occupational accident frequency rate per million hours worked  5.8  4.6  5.5  +26.1%
•   of which the Rubis Terminal JV  14.3  9  11.9  +58.8%
Occupational accident frequency rate per 200,000 hours worked  1.2  0.9  1.1  +26.1%
•   of which the Rubis Terminal JV  2.9  1.8  2.38  +58.8%
Working hours(3)            
Full time  4,426  4,275  4,104  +3.5%
•   of which the Rubis Terminal JV  541  595  440  -9.2%
Part time  64  60  38  +6.7%
•   of which the Rubis Terminal JV  32  31  9  +3.2%
Of which shift work  652  725  537  -10.1%
•   of which the Rubis Terminal JV  205  219  125  -6.4%
Training            
Number of training hours  81,151  61,142  51,578  +32.7%
•   of which the Rubis Terminal JV  12,558  12,740  8,694  -1.4%
Number of employee beneficiaries  3,908  3,559  2,869  +9.8%
•   of which the Rubis Terminal JV  473  502  357  -5.8%
Salary increases            
Percentage of total headcount  64.2%  51.0%  51.0%  -
•   of which the Rubis Terminal JV  50.57%  53.6%  62.0%  -
Percentage of employees with salary increases per job category            
Non-executives  66.2%  51.3%  51.6%  -
•   of which the Rubis Terminal JV  50.9%  52.75%  62.6%  -
Executives  59.8%  50.7%  48.0%  -
•   of which the Rubis Terminal JV  51.5%  74.4%  88.3%  -
Senior executives  53.9%  41.4%  50.2%  -
•   of which the Rubis Terminal JV  46.9%  38.0%  26.7%  -
Percentage of employees with salary increases per gender            
Women  63.7%  51.9%  55.6%  -
•   of which the Rubis Terminal JV  52.5%  48.3%  56.9%  -
Men  64.4%  50.2%  51.0%  -
•   of which the Rubis Terminal JV  50.2%  44.5%  51.9%  -
(1) Until 2020, non-permanent employees (vessel crews) were accounted for in the Caribbean zone. In the context of the restructuring of its CSR approach, Rubis decided to put in place differentiated monitoring indicators in order to take the specificities of managing these teams in to account.
(2) Employees in France are included in the headcount of the regions to which they are assigned (Europe, for mainland France, the Caribbean for Guadeloupe, Martinique and French Guiana, and Africa for Réunion Island). The total is therefore higher than the total for Europe.
(3) This indicator is reported on 99.98% of the workforce; four entities, due to a small workforce (three or less employees) representing a total of eight employees, are not included.
(4) Correction of an error in the URD 2020 (45 replacing 31 in 2020).

4.5 Working responsibly and with integrity


Operating its businesses responsibly and with integrity is a core issue for Rubis in terms of fulfilling its commitments and protecting its image, reputation and employees. The Group is built on values that have fashioned its culture and driven its success: integrity, respect for others, professionalism and trust are all principles that the Group aims to apply across all its activities to ensure its sustainability. These internal principles, which are rooted in its strong corporate culture, also encourage employees to become involved in the social and economic fabric surrounding them by adopting responsible and supportive behaviour.

Because the Group is present in over 40 countries in Europe, the Caribbean and Africa, the prevention of corruption is a major issue for the Group (section 4.5.1.1). The Group also endeavours to extend its principles of responsibility to its value chain and to gradually introduce a responsible purchasing policy with the aim of having common standards for leading by example (section 4.5.1.2). Lastly, the Group’s subsidiaries attach great importance to dialoguing with stakeholders and promoting dynamism in the regions where they operate, both in terms of the economy and employment and in terms of culture and community living (section 4.5.2).

4.5.1 Rubis’ ethics policy

The Group considers ethics to be an asset that is key to its reputation and loyalty. Integrity is one of the central pillars of the Group’s approach to ethics (section 4.5.1.1), as is the Group’s commitment to respecting its employees’ fundamental rights (section 4.5.1.2).

4.5.1.1     Fair practices

Personal integrity is key to ensuring exemplary collective behaviour. It is the safeguard against wrongdoing that could harm the Company, employees, business relationships or any other external public or private actor.

Gilles Gobin and Jacques Riou
Managing Partners of the Rubis Group


RUBIS’ CODE OF ETHICS

Collective and individual commitment is indispensable to adopting ethical behaviours that meet the Group’s values. To ensure that the rules of conduct are shared and complied with by all, Rubis has included within in its Code of Ethics a common framework for all its subsidiaries, including the Rubis Terminal JV.

This Code of Ethics (which is accessible to the public through the Group’s website: www.rubis.fr/en) lays down the values that Rubis considers to be fundamental:

•   compliance with applicable laws and regulations wherever the Group operates;

•   fighting against corruption, fraud, misappropriation of funds and money laundering;

•   preventing conflicts of interest;

•   complying with competition, confidentiality and insider trading rules, as well as with specific laws that apply to war and/or embargo zones;

•   respecting individuals, including by observing fundamental rights and human dignity, safeguarding privacy, and fighting against discrimination and harassment;

•   complying with workplace health and safety rules and environmental protection rules;

•   managing relationships with external service providers;

•   reliability, transparency and auditability of accounting and financial information;

•   protecting the Group’s image and reputation.

In each of these areas, the Rubis Code of Ethics details the general principles that employees must observe while performing their duties. The Code of Ethics is furnished to new arrivals. Subsidiaries organise training sessions to explain the Code’s contents and to answer employees’ questions. The Group CSR & Compliance Department is the point of contact for subsidiaries and employees on ethics issues. This Code of Ethics, dating from 2015, is currently being revised to better reflect the development of the Group’s CSR approach and societal challenges. The new version will be published in 2023.

FIGHTING CORRUPTION / NFIS /

Programme measures

In line with its values and applicable legislation, and in particular the law on transparency, fighting corruption and modernising the economy of 9 December 2016 (known as the “Sapin II law”), Rubis is putting into practice its commitment to fight against corruption in all its forms as described in its Code of Ethics, by gradually introducing a comprehensive anti-corruption programme. To date, this programme is made up of the following measures:

•   the anti-corruption guide, which supplements the Code of Ethics.This guide (which is accessible to the public on the Group’s website: www.rubis.fr/en/) aims to help the most exposed senior executives and employees identify at-risk situations and adopt the related practical preventive measures. The guide was updated in 2021 to make it more educational and to take into account the results of corruption risk mapping;

•   third-party assessment guidelines, to help operating staff identify third parties that may present risks, perform appropriate due diligence and implement suitable measures. These guidelines are being updated;

•   corruption risk mapping: this analysis was conducted at the operating entity level by subsidiary Managers based on a unified methodology and meetings involving the subsidiaries’ core functions (purchasing, sales, operations, HR, finance, compliance, etc.). A one-day seminar bringing together all the subsidiaries’ Compliance Advisors was organised in November 2019 to familiarise them with the mapping methodology. Risk hierarchisation resulted in an additional review in 2020. This mapping process resulted in the identification of action plans. Since 2021, the risk mapping of the operational entities is reviewed each year and is fully updated every three years;

•   regular awareness and training campaigns in respect of ethics and anti-corruption rules in all Group subsidiaries aimed at employees in the most sensitive positions and, in some subsidiaries, for all employees. An online training module (e-learning) on preventing and detecting corruption was made available to the Group’s operational entities in the first quarter of 2022. As of 31 December 2022, 61% of Group employees had validated the e-learning “Preventing and detecting corruption”. Lastly, actions to raise awareness of the Group’s employees about the risks of corruption are rolled out each year on the occasion of the Global Anti-corruption Day, celebrated on 9 December each year, in order to remind people of the Group’s commitments in the fight against corruption;

•   a global whistleblowing system, the Rubis Integrity Line, was established in 2018 and has been rolled out in all Group entities. It allows all Group employees and external and occasional employees to securely and confidentially make a report using an outsourced internet platform. These reports can relate to acts of corruption or other ethical issues (environment, security, fraud, personal data, human rights, etc.) and, more generally, to any situation or conduct that may be contrary to the Code of Ethics.The system’s overall architecture was designed to provide a means of filing these reports and processing them internally, while ensuring complete confidentiality. The rules that govern the use of the Integrity Line set out whistleblowers’ rights and responsibilities so that the system can operate smoothly in a climate of trust. In particular, in the rules, the Group reminds users that whistleblowers will be protected against any retaliation. To support the rollout of the Integrity Line, an educational kit was distributed to the Compliance Advisors, and communication initiatives are carried out regularly (Group “Think Compliance” newsletter, subsidiary newsletters, training, etc.). In 2022, the Group received 11 alerts via the system, of which 10 related to human resources issues and one related to a potential conflict of interest. To take into account the changes to the regulations that took place in the fourth quarter of 2022 as part of the transposition of Directive (EU) 2019/1937, the update of the alert procedure is underway;

•   modification of entities’ internal rules or employee handbooks (after informing/consulting staff representative bodies, where appropriate) to include specific language stating that a failure to comply with the Code of Ethics or the anti-corruption handbook may lead to disciplinary sanctions. In 2022, 21 disciplinary actions were taken for fraud or non-compliance with ethics or anti-corruption rules, some of which resulted in dismissals;

•   an internal accounting control framework (see chapter 3, section 3.2);

•   assessing that the programme’s measures are being implemented: the internal control risk management system (described in chapter 3, section 3.2.3) includes checks on the application of the Group’s main ethics and anti-corruption rules. In addition, each subsidiary reports annually to the Group CSR Director & Chief Compliance Officer on the progress of the programme’s deployment. The digital non-financial data collection platform has been used since 2020 for this reporting in order to improve the reliability of the reported information.

Compliance governance

The Group and its management bodies have made the prevention of corruption one of their priorities. Since 2016, the Management Board’ variable compensation includes an ethics criterion that relates to the implementation of the programme across all entities.

The Group’s CSR Roadmap, Think Tomorrow 2022-2025 (which is publicly accessible on the Group’s website at www. rubis.fr/en/) published in 2021, includes compliance within its third pillar, “Contributing to a more virtuous society”. In particular, the Think Tomorrow Roadmap sets the target of having 100% of employees made aware of ethics and anti-corruption by 2023.

In 2022, 90% of employees were covered by an awareness-raising campaign and 90% of the subsidiaries’ General Managers declared they had participated in an internal anti-corruption initiative or event.

COMPLIANCE GOVERNANCE

* Joint control by the Rubis SCA and I Squared Capital.

A specific organisation was put in place to support the roll out and monitoring of the anti-corruption programme:

•   the Group CSR Director & Chief Compliance Officer, who reports to the Rubis Corporate Secretary, and whose main role is to define the Group’s policies and procedures in the area of ethics and compliance and to support, together with the entities, the deployment and implementation of these policies and procedures within the Group. The Group CSR Director & Chief Compliance Officer proposes enhancements to the programme by incorporating strategic challenges, best practices and regulatory developments, and regularly reports on her work to the Management Board and to the Accounts and Risk Monitoring Committee;

•   Rubis Énergie’s and the Rubis Terminal JV’s Compliance Managers, who roll out the programme within their divisions and address operational issues, if necessary, in conjunction with the Group CSR Director and Chief Compliance Officer;

•   the 36 Compliance Advisors, who are appointed within operating entities, ensure that the Code of Ethics and anti-corruption policy are properly understood and applied at a local level. A Compliance Advisor has also been appointed within Rubis Photosol.

Tools have been provided to coordinate this network and to support Compliance Advisors in their work, including practical fact sheets on how to deal with gifts and invitations and manage conflicts of interest and Integrity Line training materials for employees. In addition, a biannual newsletter called Think Compliance has been sent to the operating entities since 2018 in order to strengthen the compliance culture within the Group.

The Group is committed to a continuous improvement approach and supplements its anti-corruption programme in view of changes in legislation and best practices.

FIGHTING FRAUD

The main internal fraud risk lies in the theft or misappropriation of products. Therefore, over several years the Group has established strict measures to verify production volumes (such as the automation of transfer stations to reduce human involvement as much as possible, inventory gap checks, and upgrades of control systems).

Finally, the increase in external fraud attempts (CEO impersonation and hacking, for instance) has prompted the Group to strengthen its information campaign with the aim of raising the awareness of all employees who are likely to be approached (accounting, financial or legal positions) so that this type of fraud can be combatted more effectively.

In terms of IT security, the Group and its subsidiaries are constantly working on innovative cybersecurity solutions, using European tools, following the directives of the ANSSI (French national information systems security agency) but also of these various partners. These actions cover the protection of information systems. The Group trains its employees on detecting fraudulent emails (phishing, for example) and on suspicious activity at workstations. Strong and secure authentication solutions for production resources with constant flow analysis systems are also implemented.

FIGHTING TAX EVASION / NFIS /

The amount of taxes recognised by the Rubis Group (excluding the Rubis Terminal JV) in respect of financial year 2022 amounted to €198 million.

Group companies ensure that tax returns and payments are submitted in accordance with local regulations. They complete the tax returns required in the tax jurisdictions in which the Group operates its businesses. Rubis has opted for tax consolidation in France since 1 st January 2001 (see note 5.2 to the separate financial statements). In accordance with its legal obligations, Rubis carried out its country-by-country reporting by reporting the breakdown of its profits, taxes and activities by tax jurisdiction and established the transfer pricing documentation applicable among Group companies (Transfer Pricing Documentation – Master File).

The Group does not have any subsidiaries that are not underpinned by economic activities (essentially, local commercial operations). In particular, the Group’s presence, via Rubis Énergie, in the Caribbean Islands and the Channel Islands, corresponds to the distribution of petroleum products; Rubis supplies these islands with the energy resources necessary for their operation and manages, for example, the leading automotive fuel distribution network in the Caribbean and Bermuda, and distributes 100,000 m3 of petroleum products per year in the Channel Islands.

RESPECT FOR HUMAN RIGHTS / NFIS /

Respecting human rights is above all about promoting a model of a responsible employer that protects the fundamental rights of all Group employees in all countries where the Group has a presence. In addition to its legal obligations, Rubis advocates for the respect of individuals as a management principle and prohibits harassment and discrimination. These values are enshrined in the Code of Ethics put in place in 2015, which is distributed to employees.

In practical terms, the Group ensures that in all countries where it operates its human resources policy complies with the principles relating to human rights at work as set out in the International Labour Organization’s fundamental conventions in the areas of:

•   freedom of association and collective bargaining;

•   eliminating discrimination in hiring and professional discrimination;

•   eliminating forced or compulsory labour;

•   abolishing child labour.

In 2021, the Group joined the United Nation’s Global Compact in order to reaffirm its commitment to integrating and promoting the principles of protecting human rights, complying with international labour and environmental protection standards and combatting corruption.

In 2020, the Group CSR & Compliance Department, in conjunction with Rubis Énergie’s operational management, conducted an analysis of modern slavery risks in its value chain in order to ensure that adequate preventive measures are in place. This analysis was supplemented in 2022 by a broader mapping of the human rights challenges in the Group’s activities.

Due to the Group’s presence in countries where protection against discrimination based on sexual orientation or religion is not guaranteed by regulations, the Group pays particular attention to these matters. In particular, it will reiterate its principles of non-discrimination against anyone and for any reason whatsoever in its new Code of Ethics, which will be published in 2023.

Challenges related to the health, safety and security of workers and communities are also a subject of particular attention due to the Group’s activities. Significant risk prevention measures have been implemented (see in particular section 4.2 of this document), both in terms of workplace safety and the prevention of industrial and road accidents.

Preventing the risk of forced labour in the shipping business is also a major focus. A crew management manual drawn up by the Rubis subsidiary in charge of managing wholly owned vessels sets detailed standards to be complied with in terms of crew recruitment and working conditions (under a temporary international contract with a Group entity), in line with the principles of the ILO Maritime Labour Convention, which include the rejection of forced labour. Enhanced vigilance is exercised when dealing with crew recruitment agencies. Contracts with these agencies include specific clauses relating to the obligation to comply with international standards, and the ILO Maritime Labour Convention in particular. Annual audits are carried out on these recruitment agencies. For chartered vessels, the services of a leading vetting company are used. Compliance with the Maritime Labour Convention is included in the pre-approval criteria for each vessel.

As regards the working conditions of service station managers, who are not Group employees, an initial assessment has been carried out on two subsidiaries with service station networks in two countries that are particularly exposed, Madagascar and Haiti. No cases of forced or child labour were identified by the commercial inspectors, who regularly inspect service stations, sometimes unannounced. An ethics clause, in which the service station operator undertakes to comply with Rubis’ ethics rules, including compliance with applicable labour laws, the prohibition of forced or child labour, and compliance with employee health and safety rules, is included in certain contracts and must be systematically included when renewing or signing new contracts.

The Group’s whistleblowing line, Rubis Integrity Line, which has been rolled out across all Group entities, is available not only to Rubis employees but also to external and occasional workers and enables them to report non-compliance with rules in a strictly confidential way (see the “Fighting corruption” section on the previous page). The deployment of the line to reach external employees, including the employees of service station managers, must be strengthened.

In addition, the Group ensures that systems for protecting the health and safety of all persons working within in subsidiaries are in place (see section 4.2.3.2.1).

4.5.1.2     Requirements for subcontractors and suppliers / NFIS /

The main suppliers of Rubis’ subsidiaries are equipment suppliers and service providers, mainly in logistics (transport, operations).

RESPONSIBLE PURCHASING POLICY

The Code of Ethics stipulates that employees have an oversight mission and are to ensure within that context that third parties properly apply the Group’s standards when working on Group sites. If the situation so requires, employees must conduct awareness or training actions and, if ethics rules are violated, advise their line managers.

The Code of Ethics also specifies that the Group’s subsidiaries must require that the external service providers with which they work (suppliers, subcontractors, industrial or commercial partners) comply with internal standards related to safety, environmental protection and respect for individuals in particular.

Any finding of a breach of the Group’s ethical standards must be communicated to the line Manager and/or the Management of the subsidiary or facility as quickly as possible.

Rubis’ CSR Roadmap, Think Tomorrow 2022-2025, (accessible on the Group’s website: https://www.rubis.fr/uploads/attachments/Rubis_CSR% 20 roadmap_2022_2025-EN.pdf ), published in 2021, notably provides for a target of adopting a sustainable purchasing charter from 2023, which would make it mandatory to include CSR criteria when selecting suppliers and service providers for capital expenditures and the Company’s most significant projects.

Lastly, the Group has implemented a management policy for detecting potential or proven conflicts of interest to avoid this type of situation, particularly in the context of relationships with service providers and suppliers. These rules are described in the Code of Ethics and the anti-corruption guide and set out in more detail in the dedicated practical sheets.

MEASURES FOR ENGAGEMENT AND CONTROL

The provision of services and supplies used on the Rubis Terminal JV’s industrial sites is governed by the Group’s social and environmental policy (see section 4.2.1).

Rubis’ subsidiaries factor health, safety and environmental issues into the process of selecting solutions from their suppliers when such companies work at their facilities. The subsidiaries therefore favour practices that reduce energy consumption and waste generation, all while guaranteeing optimal security. This is the case in the choice of heating by heat pump that was made for newly constructed buildings for the Rubis Terminal JV.

The Rubis Terminal JV has set itself the target of having all orders fulfilled under terms containing a CSR criterion: all of the joint venture’s service providers whose personnel carry out work on its industrial sites are selected using HSE criteria as a minimum. In addition, the Rubis Terminal JV responded to the Ecovadis questionnaire in 2021 and obtained the Bronze medal. Rubis Énergie, which does not have a centralised Purchasing Department, is considering setting up a target as part of the definition of the Group’s CSR Roadmap. Rubis Énergie also responded to the Ecovadis questionnaire in 2021 and obtained a score of 45/100. The Vitogaz France subsidiary obtained the Gold medal.

Contracts also stipulate that suppliers must comply with applicable labour laws, including the fight against illegal employment and respect of working hours. CSR clauses are also attached to contracts with suppliers and stipulate that they must comply with the Rubis Group’s Code of Ethics, as well as the anti-corruption guide.

Third-party assessment guidelines also provide for ethics risk assessments of their main trading partners, including suppliers and service providers.

The Group ensures that its suppliers, which generally operate nationwide or internationally, are certified whenever possible and that they comply with the stringent regulations liable to be imposed on them (transport of hazardous materials, manufacturing of pressurised equipment, etc.).

A responsible purchasing approach will be launched in 2023 to identify the most at-risk purchasing categories and define an action plan for the priority categories.

4.5.2 Commitment to regional development / NFIS /

Committed to local populations, Rubis’ subsidiaries attach great importance to dialogue with stakeholders and to promoting the dynamism of the regions in which they operate, not only in terms of economics and employment but also in the areas of culture and community living. The Group also commits itself through an active and targeted social engagement policy.

4.5.2.1     Close relationships with stakeholders

The Group’s stakeholders consist of employees and their representatives (union representatives, Health, Safety and Working Conditions Committee (CHSCT), etc.), shareholders, national and local governmental bodies (DREALs, DRIEE, etc.), regulatory agencies, trade unions, associations and other private agencies working on social and environmental issues, customers and suppliers, as well as communities living near subsidiaries’ facilities.

The Group has also consistently taken into account the impacts its facilities and activities have on residents’ lives. Indeed, this is an obligation for Seveso sites, resulting in the signature of technological risk prevention plans (PPRT) that are negotiated with local authorities and the relevant associations (see section 4.2.3, which details the industrial safety measures implemented).

Measures have been taken in favour of residents living near industrial sites. These measures notably aim to avoid or diminish the nuisances associated with truck traffic, through the purchase or leasing of land to create parking areas for tank trucks waiting to be filled and, at certain sites, the creation of a booking system for truck loading.

When the activity conducted locally requires it, site Managers also have regular contact with all government stakeholders at the local, regional and national levels with respect to the enforcement of regulations and for operating permits:

•   in France (Rubis Énergie and the Rubis Terminal JV): DREAL (Regional Directorates of Environment, Planning and Housing), DRIEE Île-de-France (Regional and Interdepartmental Directorate of Environment and Energy), CLIC (Local Information and Consultation Committees), CSS (Site Monitoring Committee), local government, prefectures, SDIS (Fire and Rescue Departments), customs;

•   in the Netherlands and Belgium (Rubis Terminal JV): agencies responsible for buildings or for the verification of regulatory compliance, including facility safety and security, compliance with environmental standards and compliance with customs regulations.

The relevant subsidiaries also play an active role in regional campaigns regarding major industrial hazards to inform local populations about operations carried out on its sites, the products stored there and safety instructions. Some site Managers have visited schools to raise public awareness about such risks. Others have organised tours of the industrial facilities for young people, reporters and elected officials.


What is a PPRT?

Introduced by the law of 30 July 2003 on the prevention of technological and natural risks and on compensation for damage and the implementing decree of 7 September 2005, the purpose of technological risk prevention plans (PPRT) is to regulate more closely future urban development around high-threshold Seveso sites.

The PPRT is a document drawn up by the French government. It maps exposure to risk around any given facility, taking into account the nature and intensity of the technological risks and the preventive measures implemented.

Rubis does not have any extractive activities, however, it is careful to respect the various cultures and traditions of the indigenous peoples in the regions where it operates.

For example, a consultation with indigenous populations was carried out for the CEOG project in French Guiana, in which Rubis is not a majority shareholder.

4.5.2.2     Economic and social involvement in regional communities

Rubis’ subsidiaries are involved in the economic and social life of the communities within which they operate.

Their involvement is notably reflected in their contribution to the dynamism of the local employment market: more than 98% of the Group’s employees are hired locally. Moreover, the sites most often favour business relationships with local suppliers (over 50%).

Within the Support & Services activity (Rubis Énergie), the SARA refinery also significantly contributes to the dynamism of the local job market: the number of direct and indirect jobs is estimated at 700 across the three French overseas departments (Martinique, Guadeloupe and French Guiana).

In the Retail & Marketing activity (Rubis Énergie), the network of small and medium-sized facilities (service stations, small depots) has an appreciable impact on employment, as the Group operates 1,054 service stations, mostly under independent management. The number of jobs (managers, fuel attendants, security guards) generated by these stations’ activities has been estimated at more than 4,000 (i.e., a low average of around four full-time jobs per station). This estimate was made on the basis of ongoing reporting to better identify our contribution to the creation of indirect jobs. It will be gradually refined.

This is also the case in the Storage activity (Rubis Terminal JV), where terminals work primarily with regional service providers who are perfectly familiar with the various facilities and their developments. This means that the promotion of local employment is combined with optimised maintenance and routine upkeep of sites by contractors.

In addition to the direct impacts caused by hiring, the Group’s facilities are a key driver of the local economy, insofar as the Storage, Retail & Marketing, and Support & Services activities satisfy strategic requirements such as the storage of products used in industrial processes, the supply and transport of bitumen to improve the road network, the provision of fuel, etc.

The Rubis Terminal JV’s depots are part of the logistics chain for chemical products, petrochemicals, agrifoods and liquid fertilisers, supplying industries located nearby. Their presence and adaptability are essential for the development of regional industries. For example, the Rubis Terminal JV’s French subsidiary serves the entire Lyon and Grenoble chemical valley.

Finally, this role in regional development is also reflected in the subsidiaries’ involvement in community life in the areas where the Group operates. Subsidiary and site Managers maintain close ties with local communities, and the law on technological risk prevention plans (PPRT) has further promoted dialogue and closer relationships.

For example, the Rubis Terminal JV’s teams are in close contact with the ports with which concessions have been signed (Rotterdam, Antwerp, Rouen, Strasbourg, Dunkirk and Brest). Site managers are encouraged to take on responsibilities within these port organisations. In general, terminals located in industrial areas are actively involved in the projects of local associations, with a view to maintaining economic activity in the area.

More broadly, the subsidiaries’ involvement in regional communities also results in active participation in efforts supporting, promoting or preserving cultural heritage and the volunteer sector. Commitments of this type are in addition to the Group’s social engagement activities.

4.5.2.3     The Group’s social engagement

For over 10 years, the Group has pursued a policy of international social engagement through the implementation of targeted initiatives within local communities in the countries in which the Group operates.

The community investment carried out by the Group and its subsidiaries are driven by two commitments:

 
Education   Health
Provide better access to education
and encourage training and entrepreneurship
  Provide better access to health,
hygiene and care
     
The Rubis Mécénat endowment fund, founded in 2011, is developing around two axes:
     
 
Contemporary creation   Humanitarian and artistic projects
Support emerging contemporary creation
in France
  Develop educational and social projects
for the professional integration of young people
through artistic practice

In 2022, Rubis devoted nearly €2 million to its social engagement actions in around 20 of the Group’s countries.

THE GROUP’S COMMUNITY INVESTMENT: A LOCAL COMMITMENT TO PROMOTE ACCESS TO EDUCATION AND HEALTH

In response to the Group’s desire to be fully integrated in the regions where it operates and to contribute to their development, Rubis supports, with its subsidiaries, associations or associative projects working with the most vulnerable populations for better access to education and health. Each associative project is supported by the local subsidiary and is adapted to the issue on the ground in order to best meet the expectations of populations.

In order to continue and strengthen its proactive approach, the Group has included the following commitment in its CSR Roadmap, Think Tomorrow 2022-2025: by 2025, 100% of the business units will have implemented community investment meeting a local need in connection with one of the two axes: education and health.

Rubis also supports emergency actions to help populations affected by natural disasters and/or humanitarian crises.

Independently of Rubis’ community investment, each subsidiary is involved in local associative projects of its choice, either on an ad hoc or long-term basis.

Community investment in the Caribbean

Education is a priority for our subsidiaries inthe Caribbean: SARA created the ENAG association (Énergie Nouvelle Antilles-Guyane), which invests in projects run by or for young people in Guadeloupe, French Guiana and Martinique.

Community investment in Europe

In France, Rubis SCA is committed over the long term to associations such as L’École à l’Hôpital (School at the hospital). The Rubis Énergie, Vitogaz France and Rubis Terminal JV subsidiaries participate in these actions with a call for associative projects aimed at their employees. In 2022, the K-Dog, Buncoeur-Damoclès and Caneton Club de Beaumont associations benefitted from the Group’s support. The European subsidiaries also support local associations in Spain (Fundación Aladina), Portugal (Por Uma Cause) and Switzerland (Ken Shin Kai), with a particular focus on health and disability.

Community investment in Africa

In Africa, Rubis and its subsidiaries are particularly involved with local associations that seek to encourage education and training for local communities, thereby responding to a need for the reintegration and professionalisation of African youth. Thus, Galana, Vitogaz Madagascar and Easigas Botswana support schools providing education for children from local communities. Eres Togo supports young African entrepreneurs in the energy field and Rubis Energy Kenya runs a scholarship programme for a selection of promising students. In Rwanda and Senegal, the subsidiaries are committed to the social inclusion of vulnerable populations.

Key figures in 2022

•   33 associations and projects supported in the context of the Group’s community investment.

•   Including two exceptional donations to the Fondation de France’s Ukraine Solidarity Fund and the NGO Gift of the Givers following the floods in the Durban region in South Africa.

•   67% of business units committed to the Group’s community investment in Europe, Africa and the Caribbean.

•   3 new countries committed in 2022: Rwanda, Zambia and India.

•   Nearly 700 employees involved with associations supported by subsidiaries: sponsorship activities, fundraising, meetings, etc.

•   Nearly 50,000 beneficiaries(1) of Rubis’ community investment and the commitments of each subsidiary in Europe, Africa and the Caribbean.

(1) Excluding beneficiaries of the exceptional donation to the Fondation de France’s Ukraine Solidarity Fund.
Change in the calculation method in 2022 vs 2021: the number of beneficiaries is calculated pro rata to the amounts paid to each association.

RUBIS MÉCÉNAT: RUBIS GROUP ENDOWMENT FUND FOR COMMITTED ARTISTIC AND SOCIAL PROJECTS

Rubis Mécénat is an endowment fund created by the Rubis Group in 2011. Its purpose is, on the one hand, to support emerging contemporary creation in France through aid for artistic productions and, on the other hand, to develop long-term humanitarian, educational and social projects aimed at the professional integration of young people from underprivileged backgrounds through artistic practice in certain countries where the Group operates.

We affirm our desire to continue to carry out impactful artistic projects that have a social and societal dimension and convey a positive and constructive message.

Lorraine Gobin,
Managing Director
of Rubis Mécénat


Key figures since 2011

•   About 30 aids for artistic production to support emerging artists in France in the creation of new work in collaboration with cultural institutions.

•   3 humanitarian, educational and social programmes with a long-term vocation developed by Rubis Mécénat for the professional integration of young people from disadvantaged backgrounds through artistic practice.

•   More than 150 young adults (15-30 years old) supported in the framework of these humanitarian and educational programmes.

•   Nearly 100 scholarships granted to these young beneficiaries to access higher studies and support them in their professional careers.

2022 in figures

•   Around 50 young adults (15-30 years old) benefited from training and weekly workshops as part of Rubis Mécénat’s three humanitarian programmes in South Africa, Jamaica and Madagascar.

•   Around 10 young beneficiaries of these educational programmes received scholarships to access higher-level training in the arts in Jamaica and South Africa.

•   5 young beneficiaries of the Ndao Hanavao programme in Madagascar were supported in the creation of an eco-responsible company.

•   4 artists received the support of Rubis Mécénat with exhibitions in France in the autumn of 2022: Benjamin Loyauté (Saint-Eustache church, Paris), Hélène Janicot (Saint-Eustache church, Paris), Jabulani Dhlamini and Thembinkosi Hlatshwayo (PhotoSaintGermain festival, Paris).

•   2 books were published: a book of photographs for the 10th anniversary of the Of Soul and Joy project in South Africa and an artist book on the performance of the French artist Benjamin Loyauté presented at the Saint-Eustache church in the autumn of 2022.

•   1 episode of the series Art(ist) was released on the French designer Laureline Galliot.

•   1 documentary film was produced celebrating the 10th anniversary of the Of Soul and Joy project in South Africa.

4.6 Methodology note / NFIS /

This section contains a description of methodology and a cross-reference table designed to facilitate understanding of CSR information. Accordingly, it was decided to present the scope and methods for reporting CSR information and the key definitions contained in the internal standards on reporting labour and environmental information. These clarifications will enable the reader to have a more precise understanding of each information item’s scope and relevance.

4.6.1 CSR scope

The rules relating to an entity’s date of inclusion within and exit from the CSR scope are defined as follows:

•   any acquisition of an entity (external to the Group) is included in the CSR reporting scope starting the first full financial year occurring after the entity is included in the financial scope, at the earliest. This rule allows HR processes, safety standards, Group commitments and the corresponding monitoring indicators to be better integrated. Thus, for the financial year 2022, Rubis Photosol is not included in the NFIS except for data relating to the workforce and some qualitative information on the Group’s climate strategy;

•   unless otherwise indicated, the CSR data of an entity that was sold or liquidated during the financial year is excluded from CSR reporting for the entire financial year in which it was sold or liquidated.

In January 2022, the activities of the Rubis Terminal JV in Turkey were sold. The quantities presented for year Y and the comments on changes include this change in scope. In the tables, the reference quantities for Y-1 remain identical to those reported in 2021 without change of scope.

4.6.1.1    Environmental data

Unless expressly stated otherwise, the reporting scope for environmental information corresponds to the Group’s financial scope of consolidation. Controlled companies are fully consolidated, with the exception of data relating to greenhouse gas emissions (see below).

Environmental data for the Rubis Terminal JV, which is jointly controlled by Rubis SCA and its partner and accounted for using the equity method, are presented both at 100% and in accordance with the percentage of capital held by Rubis SCA (55%).

The exact scope of reporting of environmental data may vary according to the environmental indicators, depending on their relevance and the accounting methods applied.The environmental data is collected at the legal entity level.

Environmental data is published by activity. Figures are published for the activities that have the most significant environmental impacts (Support & Services activities at Rubis Énergie and the activities of the Rubis Terminal JV).

The greenhouse gas emissions from the Group’s activities and the greenhouse gas emissions related to the use by customers of products sold for final use have been evaluated and are published for all the entities in the financial scope of consolidation, with the exception of Rubis SCA/Rubis Patrimoine due to their immaterial impact (25 employees, no operating activity). In accordance with the principles of the GHG Protocol, this data is proportionally consolidated by applying the percentage of the stake held.

4.6.1.2    Social data

Unless expressly stated otherwise, the reporting scope for social information corresponds to the Group’s financial scope of consolidation. Controlled companies are fully consolidated.

Social data regarding the Rubis Terminal JV, which is jointly controlled by Rubis SCA and its partner and accounted for using the equity method, are presented at the rate of 100%.

The information for Rubis SCA/Rubis Patrimoine, Rubis Énergie (Retail & Marketing and Support & Services activities), Rubis Photosol and the Rubis Terminal JV is presented separately and/or by region.

The exact scope of social data reporting may vary according to the social indicators, depending on their relevance and the accounting methods applied. Social data is collected at the legal entity level. The breakdown of the workforce by age, job category and work time covers 99.98% of the workforce; four entities, due to a small workforce (three or less employees) representing a total of eight employees, are not included.

In addition, the shipping activity requires the use of crews hired on temporary contracts (with a Group entity or on an interim basis). These non-permanent employees of the Group (224 individuals in 2022) are not taken into account when monitoring published social indicators.

4.6.1.3    Societal/ethics data

The reporting scope for societal and ethics information corresponds to the Group’s financial scope of consolidation. The applicable reporting method is proportional consolidation (percentage of stake held).The societal/ethics data are collected at the business unit level.

4.6.2 Data reporting methods

The production of CSR information is carried out jointly by the subsidiaries and the Group’s parent company. It is subject to systematic internal audits.

For several years now, the Group has used a risk mapping process to identify significant risks. This identification process and risk management and monitoring arrangements are described in chapters 3 and 4 of this Universal Registration Document.

4.6.2.1    Comparability and reliability of information

Reporting protocols have been designed to ensure the comparability of results between Group entities.

However, environmental performance is only comparable at the level of a given activity.

As the strength of the Group’s business has resulted in significant external growth, the CSR reporting scope also changes on a regular basis, and therefore does not, in the absence of ratios, allow for true comparability of data across several financial years.

A set of reporting standards for environmental and labour-related information was defined by management in partnership with the relevant subsidiaries. These standards provide a precise definition for each data item referred to in the information reporting protocols with the aim of reducing the risk that concepts will be interpreted differently.

4.6.2.2    Control measures

The data collected is checked for consistency at the local level, then by the functional departments of Rubis Énergie or the Rubis Terminal JV and by the Group CSR & Compliance Department. Consistency between the financial scope and that of the social data is ensured by the Group CSR & Compliance Department.

4.6.2.3    Changes in methodology

Unless otherwise provided, the methodology cannot be changed after the information reporting process within Group entities has begun. Changes in methodology are prepared and/or overseen by the Group CSR & Compliance Department after consultation with Rubis Énergie and the Rubis Terminal JV. They take into account, where applicable, comments and observations made by stakeholders on the relevance and quality of the definitions used in the reference system.

4.6.2.4    Methodological limitations

It is important to note that the indicators may have methodological limitations due to:

•   a lack of harmony in national laws, and in particular the specificities of labour laws in certain countries;

•   the heterogeneity of the data managed within the Group’s subsidiaries;

•   changes in definition that may affect their comparability;

•   practical arrangements for collecting data;

•   the availability of source data as of the reporting date.

Some indicators should be interpreted with caution, particularly averages, since they consist of worldwide data that requires a more detailed analysis at the level of the relevant geographical areas, countries and business lines.

4.6.2.5    Data reporting tools

Data are reported by the operating entities within the scope of consolidation via the reporting software implemented by the Group in 2020, unless otherwise specified below.

ENVIRONMENTAL DATA

Because the Group’s various activities have environmental impacts that are specific to such activities (see section 4.2.2), data calculation methods may vary depending on the activity. However, the definitions are standardised at the level of each division, within a “standard for reporting environmental data” that has been incorporated into the Group’s CSR data reporting software.

Rubis Énergie’s data is reported by the entities in the reporting software, with the exception of (i) data from SARA (refinery), which is the subject of a specific report issued by SARA’s HSE teams, and (ii) data relating to the number of Seveso sites, which are submitted by headquarters on a consolidated basis.

Data from entities within the scope of the Rubis Terminal JV are reported on a consolidated basis by the Rubis Terminal JV’s Operations Department for inclusion in the Group’s reporting software.

SOCIAL DATA

For all entities, the social data reporting protocols include similar information based on standardised definitions set out in the “standard for reporting social data” that has been incorporated into the Group’s CSR data reporting software.

SOCIETAL/ETHICS DATA

Societal/ethics data are reported using the reporting software on the basis of standardised definitions that apply to all entities and that are partly produced by Rubis SCA (Group ethics policy). Regarding social engagement initiatives, as well as dialogue with stakeholders and commitment to local areas, the information collected may come from public communications by subsidiaries and/or a societal information reporting protocol for the Rubis Terminal JV.

4.6.3 Definitions

Concepts
(in alphabetical order)
  Definitions
1) Environmental information
Energy consumption  

There is no mandatory legal definition for this issue.

Rubis Énergie

The Retail & Marketing activities are for the most part not energy intense. They are not therefore such as to justify that an overall measuring system be set up at the division level. In the refining activity, the refinery uses part of the crude oil it stores to produce energy (electricity and steam). An internal database monitors the site’s real-time power generation and consumption.
Rubis Terminal JV

The data represent the sum of the quantities of automotive or heating fuels or electricity purchased, converted into GJ, with the exception of fuel used by administrative staff (headquarters and site management) for transport.

Greenhouse gases (emissions)   Only carbon dioxide (CO2) is assessed, as according to our estimates, Group activities do not involve other greenhouse gases, including methane (Annex II of Directive 2003/87/EC). The CO2 emissions led to a carbon footprint assessment audit being conducted, the scope of which is detailed in the definitions of “Scope 1”, “Scope 2” and “Scope 3”.
Hazardous waste  

Rubis Énergie

Most Retail & Marketing activities do not produce hazardous waste. The activities are not of a nature that justifies that an overall measuring system be set up at the division level.

In the refining activity, waste amounts to the values reported during the financial year (time lag of one year).

Rubis Terminal JV

Waste amounts to the values reported during the financial year (one-year lag) for all sites.

Industrial sites  

Rubis Énergie

The following are considered to be industrial sites: the refinery; any storage sites (depots) for liquefied gas, petroleum products, or bitumen with a storage capacity > 50 tonnes of liquefied gas and/or 500 m3 of petroleum   products/bitumen; any liquefied gas cylinder filling plant with a storage capacity > 50 tonnes.

Rubis Terminal JV

Storage sites for fuels and combustibles, chemical products, bitumen, food products and liquid fertilisers.

Nitrogen oxides (NOx)  

Rubis Énergie

In the refining activity, NOx emissions are assessed by the refinery’s Production Technical Office using a spreadsheet. This is an estimate based on the emission factor of each fuel and the operating time of DeNOx from combustion turbines. This calculation is audited annually by a qualified independent body.

Rubis Terminal JV

NOx is calculated based on consumption of combustibles or fuels (excluding electricity) over the financial year. The fuel used by administrative staff (headquarters and site management) when travelling is not taken into account. Concentrations of NOx in fumes are considered in the calculation as being equal to the highest permitted level of emissions or, in the absence of a limit, 150, 200, 300 or 550 mg/Nm3 for boilers, depending on the fuel used, or 2 g/kWh for engines, in the absence of representative measurements.

Scope 1   Direct emissions from fixed and mobile facilities within the organisational scope, i.e., emissions from sources held or controlled by the organisation, such as combustion generated by owned industrial facilities or trucks, industrial processes, etc.
Scope 2   Indirect emissions linked to the generation of electricity, heat or steam purchased for the organisation’s activities. These emissions are calculated using the location-based methodology, i.e., by taking the country’s emissions factor into account.
Scope 3  

Other emissions indirectly caused by the organisation’s activities that are not accounted for under scope 2 but are linked to the entire value chain, for example, the purchase of raw materials, services or other products, employee travel, upstream and downstream transport of merchandise, management of waste generated by the organisation’s activities, use and end of life of products and services sold, capitalisation of goods and production equipment, etc.

The following items are included in scope 3 of Rubis’ carbon footprint assessment: purchases of goods and   services, fixed assets, upstream energy, upstream and downstream transport of merchandise, waste generated, use of products sold. For purchases of goods and services for capital expenditures, the Rubis Terminal JV has counted the annual depreciation of this value in 2020 and not the values purchased. Certain items were excluded from Rubis’ carbon footprint assessment, as these emissions represent less than 5% of scope 3 GHG emissions and are therefore not material to the Group. The emissions principally relate to depreciation of trucks and buildings.

Scope 3A   All indirect emissions induced upstream as a result of the Company’s activities for its production and marketing of products (e.g., employee travel, logistics, end-of-life of products, etc.), excluding products sold (see definition of scope 3B).
Scope 3B   Indirect emissions induced downstream by the products and/or services sold by the Company when they are   used by customers (category 11).
Sulphur dioxide (SO2)   SO2emissions are assessed in the refining activity. These emissions are evaluated by the refinery’s ProductionTechnical Office using a spreadsheet. The flow of SO2 is calculated based on the fuel supply (based on the reconciled materials balance) and the sulphur content of the fuels analysed by the refinery’s laboratory. SO2 concentration is deduced on the basis of the gas volume calculated using the net calorific value (NCV) of each fuel. This calculation method is audited annually by a qualified independent body.
Suspended solids  

These are particles that are suspended in water, the nature of which depends on the activities carried out on the polluted site.

Rubis Énergie

Regular Retail & Marketing activities generate little water pollution. In the refining activity, suspended solids are analysed and evaluated by the refinery’s laboratory and then audited by a qualified independent body.  

Rubis Terminal JV
Given the very broad scope of particles that may fall within the definition of suspended solids, the Rubis Terminal JV retains only the compounds that are the most representative of the pollution that may be produced by its main activities. Values from the French sites are the only values reported to authorities; in other places, the values are those established for Group reporting.

Volatile organic
compounds (VOC)
 

Rubis Énergie

Consolidated VOC emissions correspond to the values reported during the financial year (with a one-year lag) with respect to all French sites that are subject to reporting obligations under applicable regulations. In the refining activity, measurements of VOC emissions are the subject of a biennial sniffing campaign conducted by an accredited independent body.

Rubis Terminal JV

Consolidated VOC emissions correspond to the values reported during the financial year (one-year lag) for all sites.

Water used  

This is standing water (e.g., reservoirs and lakes) or running water (e.g., rivers) located above ground, sea water, rainwater, underground water and water from the distribution network that was used in the activities of the Group entity. Discharged water is abstracted water, plus some rainwater.

Rubis Énergie

Most of the Retail & Marketing operations do not require recurrent use of large quantities of water as part of an industrial process. In the refining activity, water consumption is measured based on meter readings. The volume of water discharged corresponds to the value recorded by the meter at wastewater treatment exits.

Rubis Terminal JV

The quantities of water withdrawn or discharged are the values declared during the financial year (one-year lag) for all sites.

2) Social information
Absenteeism rate   Percentage of days of absence (absences due to non-occupational illness or occupational illness or occupational   accidents or unjustified absences) in relation to the total number of days worked per year.
Apprenticeship contract
or occupational training
contract
  A contract between a person pursuing an academic training course (at university or in a training centre) and a Group entity (in principle, for a fixed term of six months or more (except where an exception is provided for in the applicable legislation)) that entitles such person to call themselves an employee of the signatory company.
Crews   Persons employed under temporary contracts to work onboard vessels owned by the Group. The social indicators relating to permanent employees do not include these non-permanent workers, for which separate monitoring is more relevant.
Departure by mutual  
agreement
  The departure of an employee of a Group entity (including those on trial periods) that results from an amicable   agreement between the two parties and that was not imposed by one of the parties on the other. Accordingly,   departures by mutual agreement are not considered as dismissals or resignations under the applicable legislation.
Employees  

This category includes:

  full-time or part-time contracts, whether or not the work is performed in shifts;

   apprenticeship contracts and occupational training contracts (in countries where this legislation applies).

This category does not include:

   internship contracts;

   external service providers working for Group entities that have not signed an employment contract with the entity in question;

   temporary staff who are the employees of an external service provider (temporary staffing company) notwithstanding the fact that they work on a Group entity’s site.

Expatriate employees, seconded employees and employees who are part of an intra-group mobility programme should be accounted for in the entity for which they effectively and usually work.

Executives  

To enable global harmonisation of reporting, employees were distinguished as follows:

Non-executives:

non-executive and non-senior executive employees.

Executives: employees:

   with managerial duties and responsibilities, without being part of the General Management or a member of the Management Committee, or being a site Manager; or

   with the status of cadre under French law.

Senior executives: senior executives are executives belonging to the General Management or members of the Rubis Énergie or Rubis Terminal JV Management Committee, Directors of subsidiaries and site Managers and the executives that report directly to them.

Management
Committee
  A Management Committee is a Committee composed of the main Directors or Managers of a Group entity who meet regularly to make strategic decisions and monitor the entity’s results.
Number of days  
worked per year
  The total number of days worked per year, which is used as the basis for calculating absenteeism rates, results   from the conversion of an average number of hours worked each day that may vary slightly from one subsidiary   to another, taking into account applicable laws and the nature of the activities carried out locally.
Number of hours
worked per year
  The number of hours worked per year may be calculated based on a daily average established under prevailing law.
Occupational accidents   An accident affecting an employee of a Group entity, where a medical certificate or investigative findings establish that the accident was directly caused by the employee’s work at the entity at issue and which leads to medical leave (total or partial).
Unilateral decision   A decision taken unilaterally by the Management of the Group entity in question after discussion with the employee representatives (as applicable).

4.6.4 Cross-reference table

The information contained in this chapter was compiled in order to respond to the provisions of European Directive 2014/95/ EU on the disclosure of social and environmental information transposed in Articles L. 225-102-1, R. 225-105 and R. 225-105-1 of the French Commercial Code.

The indicators presented in this chapter have been addressed and included in view of their relevance to the Group’s businesses.

Topics   Chapters or section    
Business model   1    
Overview of the main non-financial risks relating to the Company’s activity   4.1.2.2    

Description of policies and results

   environment (general policy, pollution, circular economy, safety)

   social (employment, equal treatment,
work organisation, training, health
and safety, social dialogue)


4.2

4.4

   
Respect for human rights   4.5.1.1    
Fighting corruption   4.5.1.1    
Fighting tax evasion   4.5.1.1    
Climate change, use of goods and services   4.3    

Societal commitments

   sustainable development

   circular economy

   food waste

   fighting food insecurity

   respect for animal welfare

   responsible, fair and sustainable food

   actions aimed at promoting the practice of physical and athletic activities

   collective agreements and impacts

   fighting against discrimination and promoting diversity

   measures to support disabled people


4.5.2

4.2.2.3

Not included

Not included

Not included

Not included

Not included

4.4.3.2

4.4.1

4.4.1.4

Given the nature of its activities, Rubis does not believe that these topics constitute a material risk and that there is any need to expand on them in this document

Specific information (Article L. 225-102-2 of the French Commercial Code)

   technological accident risk prevention policy implemented by the Company

   ability of the Company to cover its civil liability in respect of property and persons due to the operation of such facilities

   means provided by the Company to manage the compensation of victims in the event of a technological accident involving its liability


3.1.2.1 and 4.2.3 3.3.1.2


3.3.1.2

   
Methodology note   4.6    
Report of the independent third party on the information presented in the NFIS   4.7    

4.7 Report of one of the Statutory Auditors, appointed as independent third party, on the verification of the consolidated non-financial statement

This is a free English translation of the report by one of the Statutory Auditors issued in French and is provided solely for the convenience of English-speaking readers. This report should be read in conjunction with, and construed in accordance with, French law and professional standards applicable in France.

In our capacity as Statutory Auditor of the company RUBIS (hereinafter the “Entity”)], appointed as independent third party (“third party”) and accredited by the French Accreditation Committee (Cofrac), (Cofrac Inspection Accreditation, n° 3-1862,scope available at www.cofrac.fr)), we have undertaken a limited assurance engagement on the historical information (observed or extrapolated) in the consolidated non-financial statement, prepared in accordance with the Entity’s procedures (hereinafter the “Guidelines”), for the year ended December 31, 2022 (hereinafter the “Information” and the “Statement”, respectively), presented in the group management report pursuant to the legal and regulatory provisions of Articles L. 225-102-1, R. 225-105 and R. 225-105-1 of the French Commercial Code (code de commerce).

Conclusion

Based on the procedures we have performed as described under the “Nature and scope of procedures” and the evidence we have obtained, nothing has come to our attention that cause us to believe that the consolidated non-financial statement is not prepared in accordance with the applicable regulatory provisions and that the Information, taken as a whole, is not presented fairly in accordance with the Guidelines.

Comments

Without calling into question the conclusion expressed above and in accordance with the provisions of Article A. 225-3 of the Commercial Code, we make the following comments:

•   hazardous waste, consolidated VOC emissions, quantities of water used and treated as well as discharges into water from the Rubis Terminal JV are published at intervals of one year: the published values correspond to the financial year 2021, on all French sites, Antwerp and Rotterdam;

•   the information presented with respect to Responsible Purchasing risk is limited to challenges that do not allow a sufficiently precise assessment of the policies specific to the entity’s context. On the other hand, the results presented for this risk do not identify any key performance indicator.

Preparation of the non-financial performance statement

The absence of a commonly used generally accepted reporting framework or a significant body of established practice on which to draw to evaluate and measure the Information allows for different, but acceptable, measurement techniques that can affect comparability between entities and over time.

Consequently, the Information needs to be read and understood together with the Guidelines, the significant elements of which are available on request from head office.

Inherent Limitations in preparing the Information

As stated in the Statement, the Information may be subject to uncertainty inherent to the state of scientific and economic knowledge and the quality of external data used. Some information is sensitive to the choice of methodology and the assumptions or estimates used for its preparation and presented in the Statement.

Responsibility of the Entity

Management is responsible for:

•   selecting or establishing suitable criteria for preparing the Information;

•   preparing a Statement pursuant to legal and regulatory provisions, including a presentation of the business model, a description of the main non-financial risks, a presentation of the policies implemented considering those risks and the outcomes of said policies, including key performance indicators and the information set-out in Article 8 of Regulation (EU) 2020/852 (Green taxonomy);

•   preparing the Statement by applying the Entity’s “Guidelines” as referred above; and

•   implementing internal control over information relevant to the preparation of the Information that is free from material misstatement, whether due to fraud or error.

The Statement has been prepared by the Managing Directors.

Responsibility of the Statutory Auditor appointed as independent third party

Based on our work, our responsibility is to express a limited assurance conclusion on:

•   the compliance of the Statement with the requirements of Article R. 225-105 of the French Commercial Code;

•   the fairness of the information provided pursuant to part 3 of sections I and II of Article R. 225-105 of the French Commercial Code, i.e., the outcomes of policies, including key performance indicators, and measures relating to the main risks, hereinafter the “Information.”

As we are engaged to form an independent conclusion on the Information as prepared by management, we are not permitted to be involved in the preparation of the Information as doing so may compromise our independence.

It is not our responsibility to report on:

•   the Entity’s compliance with other applicable legal and regulatory provisions (particularly with regard to the information set-out in Article 8 of Regulation (EU) 2020/852 (Green taxonomy), the French duty of vigilance law and against corruption and tax evasion);

•   the fairness of information set-out in Article 8 of Regulation (EU) 2020/852 (Green taxonomy);

•   the compliance of products and services with the applicable regulations.

Applicable regulatory provisions and professional guidance

We performed the work described below in accordance with Articles A. 225-1 et seq. of the French Commercial Code, the professional guidance issued by the French Institute of Statutory Auditors (Compagnie Nationale des Commissaires aux Comptes) applicable to such engagement, in particular the professional guidance issued by the Compagnie Nationale des Commissaires aux Comptes, Intervention du commissaire aux comptes – Intervention de l’OTI – déclaration de performance extra-financière, and acting as the verification programme and with the international standard ISAE 3000 (revised) -Assurance engagements other than audits or reviews of historical financial information.

Independence and quality control

Our independence is defined by the provisions of Article L. 822-11 of the French Commercial Code and French Code of Ethics for Statutory Auditors (Code de déontologie) of our profession. In addition, we have implemented a system of quality control including documented policies and procedures aimed at ensuring compliance with applicable legal and regulatory requirements, ethical requirements and the professional guidance issued by the French Institute of Statutory Auditors (Compagnie Nationale des Commissaires aux Comptes) relating to this engagement.

Means and resources

Our work engaged the skills of 7 people between December 2022 and April 2023 and took a total of 8 weeks.

We were assisted in our work by our specialists in sustainable development and corporate social responsibility. We conducted ~10 interviews with people responsible for preparing the Statement, representing in particular CSR direction, risk management, compliance, human resources, health and safety, environmental.

Nature and scope of procedures

We are required to plan and perform our work to address the areas where we have identified that a material misstatement of the Information is likely to arise.

The procedures we performed were based on our professional judgment. In carrying out our limited assurance engagement on the Information, we:

•   obtained an understanding of all the consolidated entities’ activities and the description of the main risks associated;

•   assessed the suitability of the criteria of the Guidelines with respect to their relevance, completeness, eliability, neutrality and understandability, taking into account, where appropriate, best practices within the sector;

•   verified that the Statement includes each category of social and environmental information set out in article L. 225 102 1 III as well as information regarding compliance with human rights and anti corruption and tax avoidance legislation;

•   verified that the Statement provides the information required under Article R.225-105 II of the French Commercial Code where relevant with respect to the main risks, and includes, where applicable, an explanation for the absence of the information required under Article L.225-102-1 III, paragraph 2 of the French Commercial Code;

•   verified that the Statement presents the business model and a description of the main risks associated with of all the consolidated entities’ activities, including where relevant and proportionate, the risks associated with its business relationships, its products or services, as well as its policies, measures and the outcomes thereof, including key performance indicators associated to the main risks;

•   referred to documentary sources and conducted interviews to:

•   assess the process used to identify and confirm the main risks as well as the consistency of the outcomes, including the key performance indicators used, with respect to the main risks and the policies presented, and

•   corroborate the qualitative information (measures and outcomes) that we considered to be the most important presented in Appendix 1; concerning social and societal risks, our work was carried out on the consolidating entity, for other risks, our work was carried out on the consolidating entity and on a selection of sites: SARA, Vitogaz France, Vitogaz Switzerland, Rubis Portugal, Société Réunionnaise des produits pétroliers, Easigas South Africa and Rubis Terminal;

•   verified that the Statement covers the consolidated scope, i.e. all the entities within the consolidation scope in accordance with Article L. 233-16 of the French Commercial Code within the limitations set out in the Statement;

•   obtained an understanding of internal control and risk management procedures the Entity has implemented and assessed the data collection process aimed at ensuring the completeness and fairness of the Information;

•   for the key performance indicators and other quantitative outcomes that we considered to be the most important presented in Appendix, implemented

•   analytical procedures to verify the proper consolidation of the data collected and the consistency of any changes in those data,

•   tests of details, using sampling techniques, in order to verify the proper application of definitions and procedures and reconcile the data with supporting documents. This work was carried out on a selection of contributing sites : SARA, Vitogaz France, Vitogaz Switzerland, Rubis Portugal, Société Réunionnaise des produits pétroliers, Easigas South Africa and Rubis Terminal and covers between 23% and 100% of the consolidated data relating to the key performance indicators and outcomes selected for these tests;

•   assessed the overall consistency of the Statement in relation to our knowledge of all the consolidated entities.

The procedures performed in a limited assurance review are less in extent than for a reasonable assurance opinion in accordance with the professional guidelines of the French National Institute of Statutory Auditors (Compagnie Nationale des Commissaires aux Comptes); a higher level of assurance would have required us to carry out more extensive procedures.


Neuilly-sur-Seine, 24 April 2023

 One of the Statutory Auditors,

PricewaterhouseCoopers Audit


Cédric Le Gal

 Partner

Sylvain Lambert

 Partner within the Sustainability Department


Annex : List of outcomes that we considered to be the most important

Key performance indicators and other quantitative results:

Social :

•   Total workforce at the end of the period, breakdown by gender;

•   Number of departures and arrivals in the workforce, breakdown by gender;

•   Number of training hours, including safety-related training;

•   Rate of employees trained in the changes of the business lines (energy transition, CSR, etc.);

•   Number of occupational accidents;

•   Number of days lost due to occupational accidents.

Environnement :

•   Energy consumption;

•   CO2 emissions (scopes 1, 2, and 3);

•   SO2 and NOx emissions (SARA scope only);

•   VOC emissions (SARA scope only);

•   Number of accidental spills reaching the environment > 200 liters.

Anti-corruption :

•   Number of employees who received the Gifts and invitations procedure;

•   Number of employees who received the conflict of interest prevention procedure;

•   Number of employees notified of ethics and anti-corruption rules during the year;

•   Number of employees with access to the anti-corruption system;

•   Number of employees trained in ethics and anti-corruption rules during the year.

Selected qualitative information (actions and results):

•   Total Photosol workforce;

•   Rubis ESG Corporate Rating ISS ESG;

•   Ruby MSCI ESG Ratings;

•   Rubis risk mapping;

•   HSE Charter;

•   Code of Ethics 2017;

•   CSR roadmap 2022-2025;

•   HSSEQI SARA 2022 report;

•   Rubis group human rights risk register (June 2022);

•   Guide to applying the anti-corruption policy;

•   Rubis Societal actions;

•   Sponsorship agreement;

•   Membership of the United Nations Global Compact.

5. REPORT of the SUPERVISORY BOARD on CORPORATE GOVERNANCE

This report on corporate governance was prepared by the Supervisory Board in accordance with Article L. 22-10-78 of the French Commercial Code. The Supervisory Board approved this report at its meeting held on 16 March 2023. This report is attached to the management report.

When drafting this report, the Supervisory Board referred to information and documents obtained from the Accounts and Risk Monitoring Committee and the Compensation and Appointments Committee, discussions with Rubis SCA’s Management Board and its Finance, Legal, Consolidation and Accounting Departments, and support from Rubis’ Secretary to the Board.


5.1 Corporate Governance Code

The Company refers to the Corporate Governance Code for listed companies published by the Afep and the Medef (hereinafter the “Afep-Medef Code”). This Code (updated in December 2022) is available on the websites of the Company (www.rubis.fr/en/), Afep (www.afep.com) and Medef (www.medef.com).

The Company has always strived to comply with the Afep-Medef Code’s recommendations within the limits of the particularities stemming from its legal form as a Partnership Limited by Shares and the resulting by-laws’ provisions.

The applicable recommendations that were not fully implemented in 2022 and the explanations provided by the Company are set out in the table below.

Afep-Medef Code recommendations set aside   Explanation
It is recommended that at least one meeting [of the Supervisory Board] be held each year without the presence of executive corporate officers.
(recommendation 12.3)
 

By law, the mission of a Supervisory Board resulting from the form in which the Company is incorporated differs from that of a Board of Directors of a public limited company (société anonyme). Article L. 226-9 of the French Commercial Code provides that the Supervisory Board of a Partnership Limited by Shares is in charge of the continuous oversight of the Company’s management. Unlike the Board of Directors of a public limited company (société anonyme), the Supervisory Board may not intervene in the Company’s management and administration.

The Company therefore considered that, due to its form as a Partnership Limited by Shares, it was more appropriate that this recommendation be complied with at the level of the Accounts and Risk Monitoring Committee.


However, from the financial year 2023, one meeting of the Supervisory Board will be organised each year without the presence of the executive corporate officers (the first meeting took place on 16 March 2023).

At least two-thirds of the members of the Audit Committee must be independent and the Committee must not have any executive corporate officer as a member.
(recommendation 17.1)
  The Accounts and Risk Monitoring Committee does not have any executive corporate officer as a member. While only 60% of its members are independent, the Committee’s Chairmanship must be independent. On 16 March 2023, the Supervisory Board reiterated its objective of improving this independence rate over the course of future movements within this Committee.

[The Committee responsible for appointments] must not have any executive corporate officer as a member and the majority of its members must be independent Directors.

[The Committee responsible for compensation] must not have any executive corporate officer as a member and the majority of its members must be independent Directors.
(recommendations 18.1 and 19.1)

  The Compensation and Appointments Committee does not have any executive corporate officer as a member. While only 50% of its members are independent, the Committee’s Chairmanship must be independent.
The Appointments Committee (…) draws up a succession plan for executive corporate officers (…).
(recommendation 18.2.2)
 

The Compensation and Appointments Committee does not draw up a succession plan for the Management Board, since this responsibility falls to the General Partners in a Partnership Limited by Shares.


However, the General Partners regularly inform the Supervisory Board and the Compensation and Appointments Committee of the status of the succession plan.


5.2 Management of the Company

5.2.1 General Management: the Management Board

Composition

The Company is managed by the Management Board, which is composed of four Managing Partners: Gilles Gobin, and the companies Sorgema, Agena and GR Partenaires. All Managing Partners other than Agena are General Partners and as such have unlimited joint and several liability from their personal assets for Rubis’ debts. This feature, which results from the legal form of Partnership Limited by Shares under which the Company is constituted, provides shareholders with the guarantee of extreme care in the management and administration of the Company (particularly with regard to risk management).

Gilles Gobin is Statutory Managing Partner. Sorgema, Agena and GR Partenaires are non-Statutory Managing Partners. Jacques Riou is the legal representative of Agena.

As of 31 December 2022, the Managing Partners, in their direct and indirect capacity as General Partners, held 2,352,337 shares of the Company (representing approximately 2.28% of the share capital) due to the General Partners’ commitment to block half of their dividends in the form of shares for three years.

Profile and list of offices and positions of the Managing Partners (as of 31 December 2022)


Gilles Gobin
Experience and expertise
Founder of the Group in 1990.
Gilles Gobin is an Essec graduate with a doctorate in Economics. He started his career at Crédit Commercial de France in 1977 and joined the Executive Committee in 1986 as head of Corporate Finance. He left the bank in 1989 and founded Rubis in 1990.

Born on 11 June 1950


Professional address
Rubis
46, rue Boissière
75116 Paris – France


Number of Rubis shares
held as of 31/12/2022
177,782

Office within Rubis
Statutory Managing Partner and General Partner since the creation of Rubis.

Other key offices within the Group

•   Manager of Sorgema;

•    Chairman of Magerco and Manager of Thornton.

Other offices and positions held outside the Group

None

     
Sorgema

Limited liability company
with share capital of €15,487.50


Shareholders
Gobin family group


Manager
Gilles Gobin


Registered office
34, avenue des Champs-Élysées
75008 Paris – France


Number of Rubis shares
held as of 31/12/2022
1,231,609

Office within Rubis
Managing Partner company and General Partner since 30 June 1992.
Other key offices within the Group
None
Other offices and positions held outside the Group
None
     
Agena
Experience and expertise
Jacques Riou graduated from HEC business school and has a degree in economics. Before joining Gilles Gobin to set up Rubis in 1990, he held several roles at BNP Paribas, Banque Vernes et Commerciale de Paris, and at the investment management company Euris.

Simplified limited company
(SAS) with capital of €10,148


Shareholders
Riou family group


Chairman
Jacques Riou


Registered office
20, avenue du Château
92190 Meudon – France


Number of Rubis shares
held as of 31/12/2022
942,946

Office within Rubis
Managing Partner company since 30 November 1992.

Other key offices within the Group
None

Other offices and positions held outside the Group
None

     
GR Partenaires

Limited Partnership
with capital of €4,500


Shareholders

•    General Partners: companies of the Gobin family group and Jacques Riou

•    Limited Partner: Agena and the Riou family group


Managing Partners

•    Magerco, represented by Gilles Gobin

•    Agena, represented by Jacques Riou


Registered office
46, rue Boissière
75116 Paris – France


Number of Rubis shares
held as of 31/12/2022
0

Office within Rubis
General Partner company since 20 June 1997 and Managing Partner since 10 March 2005.

Other key offices within the Group
None

Other offices and positions held outside the Group
None

Powers of the Management Board

The Managing Partners have the broadest powers to run and manage the Company. In accordance with legal provisions, they manage the Company by taking into consideration the social and environmental challenges connected to the Company’s business.

The Managing Partners represent and bind the Company in its relationships with third parties within the limits set by its corporate purpose and subject to the duties assigned by law to the Supervisory Board and Shareholders’ Meetings.

Thus, the Rubis SCA Managing Partners make the following decisions for the Company and/or its wholly-owned division head subsidiaries (Rubis Énergie and Rubis Renouvelables):

•   strategy development;

•   steering of development;

•   risk management;

•   closing of the consolidated and separate financial statements of the Group;

•   setting, along with the subsidiaries’ General Managements, the key management decisions resulting therefrom and oversight of their implementation both at the parent company and subsidiary level.

In exercising their management authority, the Managing Partners are supported by the Senior Managers and executives of Rubis SCA, as well as those of the subsidiaries that head the divisions and their operating subsidiaries.

In addition, jointly with Cube Storage Europe HoldCo Ltd (I Squared Capital), the Managing Partners are responsible for the management of their joint subsidiary, RT Invest (55%-owned by Rubis SCA), with the support of RT Invest’s General Managers and the heads of RT Invest’s operating subsidiaries.

Management Board meetings and work in 2022

In 2022, the Management Board met 17 times. Meetings focused primarily on the following topics:

•   closing of the annual and half-year consolidated and separate financial statements;

•   calling of the Shareholders’ Meeting of 9 June 2022 and determination of the meeting agenda;

•   implementation of a performance share plan;

•   implementation of a capital increase reserved for Group employees;

•   acknowledgement of capital increases resulting from employee subscriptions to capital increases reserved for them, the creation of preferred shares and the conversion of preferred shares into ordinary share;s

•   review of the performance condition governing the conversion of preferred shares into ordinary shares and calculation of the conversion coefficient;

•   buyback of preferred shares not converted into ordinary shares and acknowledgement of the capital reduction following the cancellation of the preferred shares bought back;

•   cancellation of the preferred share plan of 17 December 2019.

Succession plan

As the Management Board is composed of four members, three of whom are legal entities, the continuity of the General Management is ensured.

In addition, Articles 20 and 21 of the Company’s by-laws provide that the appointment of any new Managing Partner is the responsibility of the General Partners. If he/she is not a General Partner, his/her appointment requires the approval of the Shareholders’ Meeting.

In this context, the General Partners have for several years organised a succession plan for the Management Board that respects the entrepreneurial and family nature of the Company. In order to ensure a succession under optimal conditions, measures have been put in place to enable future executives to acquire a thorough knowledge of the Group, its activities and its environment within the subsidiaries.

Thus, after having spent more than 10 years holding various operational roles within the Group, Clarisse Gobin-Swiecznik was appointed Managing Director in charge of New Energies, CSR and Communication at the end of 2020. As part of her duties, she structured the Company’s CSR approach and accompanied the Group’s transition to renewable energies, with the acquisition of Photosol and the creation of a division dedicated to Renewable Electricity Production (Rubis Renouvelables). Clarisse Gobin-Swiecznik will join the Management Board on 1 July 2023 as Co-Manager of Sorgema.

The Supervisory Board and the Compensation and Appointments Committee are regularly kept informed of the Management Board succession plan implemented by the General Partners.

5.2.2 Group Management Committee

The Group Management Committee, which is led by Gilles Gobin and Jacques Riou, is made up of the Chief Financial Officer, Bruno Krief, the Managing Director in charge of New Energies, CSR and Communication, Clarisse Gobin-Swiecznik, the Group Corporate Secretary, Maura Tartaglia, and the Director of Accounting and Consolidation, Anne Zentar.

The Committee assists the Management Board with the performance of its general duties: it formalises and coordinates the Management Board’s various initiatives and policies in connection with the subsidiaries (subsidiaries’ Management Committees). The Committee also encourages discussions on topical issues for the Group (particularly in the areas of financial reporting, CSR, compliance and governance).

The Committee generally meets twice per month. In 2022, meetings focused on the creation of the Rubis Renouvelables subsidiary, the integration of the Photosol entities, topics related to HDF Energy (the development of the various projects, in particular), the Group’s decarbonisation projects, the activities of the subsidiaries, the Group’s positioning and communication, the agenda of the Company’s Shareholders’ Meeting, analysis of investors’ feedback, acquisition projects, and matters relating to the preparation of the financial statements and the annual and half-year results as well as quarterly publications.

5.2.3 Gender balance within the governing bodies

To comply with the provisions of Article L. 22-10-10 of the French Commercial Code and investors’ expectations, the Management Board has set a target for 2025 of keeping the proportion of representatives of each gender at least at 30% of the Group Management Committee.

At 16 March 2023, 50% of the members of the Group Management Committee were women.

Rubis Énergie has committed to achieving an average of 30% of women on its Management Committees by 2025. Rubis Photosol plans to set a gender diversity target for its governing bodies in 2023

In addition, as of 31 December 2022, within the Group, 29.7% of positions with the highest responsibility (senior executives) and 35.5% of positions of high responsibility (senior executives and executives) were held by women, whereas women accounted for 25.9% of the total payroll. Excluding Rubis Renouvelables, 29.3% of positions with the highest responsibility (senior executives) and 35.5% of positions of high responsibility (senior executives and managers) were held by women (compared to 27.7% and 34.9%, respectively, as of 31 December 2021, and 23.6% and 33.1%, respectively, as of 31 December 2020), whereas women accounted for 25.7% of payroll (compared to 25.5% as of 31 December 2021 and 25.3% as of 31 December 2020).

5.3 Supervisory Board

5.3.1 Presentation

Composition

Supervisory Board members are appointed for a term of no more than three years by the Shareholders’ Meeting. The General Partners are not allowed to take part in these appointments. The General Partners and the Managing Partners are not allowed to be members of the Supervisory Board. No member of the Supervisory Board holds or has held an executive position within the Group. As the thresholds set out in Article L. 225-79-2 of the French Commercial Code have not been met, the Supervisory Board does not have any employee representative member.

The Supervisory Board appoints its Chairperson from among its members. The Chairperson prepares, organises, and leads the work of the Supervisory Board.

The by-laws set the age limit for Supervisory Board members at 75 years. If the number of members of the Supervisory Board over 70 years old exceeds one third of the members, the member aged 75 is deemed to have resigned at the end of the next Shareholders’ Meeting (in its ordinary form).

The by-laws provide that each member of the Supervisory Board must hold a minimum of 100 shares of the Company. The Supervisory Board’s internal rules supplement this provision by specifying that each member of the Supervisory Board must allocate half of the compensation he/she receives to the acquisition of Rubis shares until he/she holds 250 shares. As of 31 December 2022, the members of the Supervisory Board held 142,868 shares of the Company (representing approximately 0.14% of the share capital).

During the financial year ended, the renewal of the terms of office of Carole Fiquemont, Chantal Mazzacurati and Marc-Olivier Laurent and the appointments of Cécile Maisonneuve, Carine Vinardi and Alberto Pedrosa were approved by the Shareholders’ Meeting of 9 June 2022.

As of 16 March 2023, the Supervisory Board was composed of 11 members, including five women (45%), seven independent members (64%), and two members of foreign nationality (18%).

SUMMARY PRESENTATION OF THE COMPOSITION OF THE SUPERVISORY BOARD AND ITS COMMITTEES (AS OF 16 MARCH 2023)

Nom                     Age     Gender Date
of first ap-
pointment
Expiry of current
term of office
Seniority
on the Board
Independence Participation
in the Accounts
and Risk
Monitoring
Committee
Participation
in the Com-
pensation and
Appointments
Committee
Olivier Heckenroth (Chairman of the Supervisory Board) 71 years M 15/06/1995 2023 AGM 27 years  
Nils Christian Bergene 68 years M 10/06/2021 2024 AGM 2 years Chairman
Hervé Claquin 73 years M 14/06/2007 2024 AGM 15 years      
Carole Fiquemont 57 years W 11/06/2019 2025 AGM 4 years  
Laure Grimonpret-Tahon 41 years W 05/06/2015 2024 AGM 7 years   Chairwoman
Marc-Olivier Laurent 71 years M 11/06/2019 2025 AGM 4 years    
Cécile Maisonneuve 51 years W 09/06/2022 2025 AGM 1 year    
Chantal Mazzacurati 72 years W 10/06/2010 2025 AGM 12 years    
Alberto Pedrosa 68 years M 09/06/2022 2025 AGM 1 year  
Erik Pointillart 70 years M 24/03/2003 2024 AGM 19 years    
Carine Vinardi 50 years W 09/06/2022 2025 AGM 1 year    
  Average
age: 63
45% W
55% M
    Average
seniority:
8 years
Independence
rate:
64%
Independence
rate:
60%
Independence
rate:
50%

Renewal of the term of office expiring in 2023

As the term of office of Olivier Heckenroth as member of the Supervisory Board expires at the end of the 2023 Shareholders’ Meeting, the Supervisory Board decided, on the proposal of the Compensation and Appointments Committee, to present his renewal. Thus, at the end of the 2023 Shareholders’ Meeting, subject to the renewal of the term of office of Olivier Heckenroth as member of the Supervisory Board, the Supervisory Board would remain composed of 11 members, including five women (45%), seven independent members (64%) and two members of foreign nationality (18%). Olivier Heckenroth would remain Chairman of the Supervisory Board.

In 2021 and 2022, the Supervisory Board considered that the objective of changing its composition, which resulted in the election of four new members, should take precedence over the sequencing of terms of office in order to comply with independence rates and the diversity policy. In March 2023, the Compensation and Appointments Committee started to examine how best to ensure the balanced sequencing of terms of office over the coming financial years in order to meet the expectations expressed by certain investors.

CHANGES IN THE COMPOSITION OF THE SUPERVISORY BOARD BETWEEN THE SHAREHOLDERS’ MEETINGS OF 9 JUNE 2022 AND 8 JUNE 2023

(Subject to the renewal of the term of office of Olivier Heckenroth)

  At the end of the
Shareholders’
Meeting of
Departure Appointment Renewal
Supervisory
Board
9 June 2022 Marie-Hélène Dessailly(1)
Aurélie Goulart-Lechevalier
Cécile Maisonneuve(1)
Carine Vinardi(1)
Alberto Pedrosa(1)
Carole Fiquemont(1)
Chantal Mazzacurati(2)
Marc-Olivier Laurent(3)
8 June 2023 - - Olivier Heckenroth
(1) Independent member of the Supervisory Board.
(2) Member having lost her independence qualification at the end of the 9 June 2022 Shareholders’ Meeting due to her length of service on the Supervisory Board.
(3) Member qualified as non-independent for the Shareholders’ Meeting of 9 June 2022 and independent for the Shareholders’ Meeting of 8 June 2023.


Profile and list of offices and positions of the members of the Supervisory Board (as of 31 December 2022)

Olivier Heckenroth
Experience and expertise
With a master’s degree in law and political science, and a bachelor’s degree in history, Olivier Heckenroth began his career in 1977 with the Société Commerciale d’Affrètement et de Combustibles (SCAC). He was subsequently technical advisor first to the Information and Communications Unit of the French Prime Minister (1980-1981), and then to the French Ministry of Defence (1981- 1987). He is also a former auditor of the Institut des Hautes Études de Défense Nationale. In 1987, he was appointed Chairman and CEO of HV International before becoming Chairman (2002-2004), and then Chairman and CEO (2004-2007) of HR Gestion. Since 2004, Olivier Heckenroth has been Managing Partner of SFHR, a licensed Bank in 2006, then Banque Hottinguer in 2012. He was a Management Board member and CEO of Banque Hottinguer from 2013 to 2019. In 2021, he founded Heckol Ltd, whose main purpose is to provide services relating to the definition of investment strategies and risk analyses in the finance, security and digital business sectors.

Chairman of the Supervisory Board


Member of the Accounts and Risk Monitoring Committee


Member of the Compensation and Appointments Committee


Non-independent member


Born on 10 December 1951


French nationality


Current main position
Chairman of Heckol Ltd


Professional address
c/o Rubis
46, rue Boissière
75116 Paris – France


Number of Rubis shares
held as of 31/12/2022
8,000

Term of office on Rubis Supervisory Board
Date of first appointment: 15 June 1995
Date of last renewal: 11 June 2020
End of term of office: 2023 Shareholders’ Meeting convened to approve the 2022 financial statements
List of offices held outside the Group in the last five years

Current terms of office


In France
Listed companies
None


Unlisted companies

•    Director of Sicav HR Monétaire, Larcouest Investissements and Ariel.


Abroad
None

Terms of office that have expired during the last five years

•   Director of HR Courtage, MM. Hottinguer & Cie Gestion Privée (a company controlled by Banque Hottinguer) and Bolux (Sicav listed in Luxembourg);

•   Representative of Banque Hottinguer on the Board of Directors of Sicav Stema, of HR Patrimoine Monde and HR Patrimoine Europe;

•   Chairman of the Audit Committee of Banque Hottinguer;

•   Member of the Supervisory Board of Banque Hottinguer.

     
Nils Christian Bergene
Experience and expertise
A graduate of Science Po Paris and Insead, Nils Christian Bergene began his career in 1979 at BRS in Paris as a maritime charter broker before returning to Norway to head various maritime companies within the Kvaerner industrial group for eight years. Since 1993, Mr Bergen has worked as an independent maritime charter broker through his own company, Nitrogas.

Chairman of the Accounts and Risk Monitoring Committee


Member of the Compensation and Appointments Committee


Independent member


Born on 24 July 1954


Norwegian nationality


Current main position
Maritime transport broker


Professional address
Nitrogas
Grimelundshaugen 11
0374 Oslo

Norway


Number of Rubis shares
held as of 31/12/2022
1,969

Term of office on Rubis Supervisory Board

Date of first appointment: 10 June 2021

Date of last renewal: -
(previously, member of the Supervisory Board (appointed by the 6 June 2000 Shareholders’ Meeting – term expired at the end of the 5 June 2015 Shareholders’ Meeting))
End of term of office: 2024 Shareholders’ Meeting convened to approve the 2023 financial statements

List of offices held outside the Group in the last five years

Current terms of office


In France

None


Abroad

None

Terms of office that have expired during the ast five years

•    Lorentzen & Stemoco AS;

•    Skipsreder Jørgen J. Lorentzens fund (foundation)


Hervé Claquin
Experience and expertise
After graduating from HEC business school, Hervé Claquin began his career as a financial analyst with Crédit Lyonnais in 1974 before joining ABN AMRO Group in 1976. In 1992, he created ABN AMRO Capital France to develop the private equity business focusing on mid-market companies. In 2008, ABN AMRO Capital France became independent and was renamed Abénex Capital, which he chaired until 2017.

Non-independent member


Born on 24 March 1949


French nationality


Current main position
Director of Abénex Capital


Professional address
Abénex Capital
9, avenue Percier
75008 Paris – France


Number of Rubis shares
held as of 31/12/2022
62,984 (directly)
and 33,663 (via Stefreba SAS,
a holding company wholly
owned by Hervé Claquin)

Term of office on Rubis Supervisory Board
Date of first appointment: 14 June 2007
Date of last renewal: 10 June 2021
End of term of office: 2024 Shareholders’ Meeting convened to approve the 2023 financial statements
List of offices held outside the Group in the last five years

Current terms of office


In France

Listed companies

None


Unlisted companies

•   Chairman of Stefreba (SAS);

•   Director of Abénex Capital (SAS);
Director of Andromède (SAS);

•    Chief Executive Officer of CVM Investissement (SAS) (Abénex Group);

•    Member of the Board of Directors of Premista SAS.


Abroad

None

Terms of office that have expired during the last five years

•    Director of Holding des Centres Point Vision (SAS) (Point Vision Group); Director of Ibénex Lux SA (Abénex Group) (Luxembourg);
Director of Sicav de Neuflize Europe Expansion and of Neuflize France;

•    Chairman of the Strategy Committee of Dolski (SAS) (Outinord Group);

•    Chairman of the Board of Directors of Œneo SA (listed company);

•    Chief Executive Officer of Gd F Immo Holding (SAS) (Abénex Group);

•    Chairman of SPPICAV Fresh Invest Real Estate (Abénex Group)

•    Manager of Stefreba (SARL);

•    Member of the Supervisory Board of Buffalo Grill (SA with a Management Board), Rossini Holding SAS (Buffalo Grill Group), Onduline (SA with a Management Board), RG Holding (SAS) and Ibénex OPCI;

•    Member of the Strategy Committee of Rossini Holding SAS (Buffalo Grill Group);

•    Chairman and member of the Management Committee of Financière OFIC SAS (Onduline Group);

•    Non-voting member of the Board of Directors of Premista SAS.

     
Alberto Ferreira Pedrosa Neto
Experience and expertise
A graduate of Instituto Tecnologico de Aeronautica, with specialisations earned from FGV and Insead/Cedep, Alberto Pedrosa began his career in Brazil with the Rhône-Poulenc Group in 1976. Based in France starting in 1985, Mr Pedrosa held General Management positions carrying international responsibilities at Rhône-Poulenc, Rhodia, Alstom and Renault. Upon returning to Brazil in 2013, he headed Tereos’s local subsidiary and other sugar companies. He is currently a company Director and consultant.

Member of the Accounts and
Risk Monitoring Committee


Independent member


Born on 1 June 1954


Italian and Brazilian nationalities


Current main position
Companies’ Director


Professional address
Rua Dr Melo Alves 717
01417-010 São Paulo

Brazil


Number of Rubis shares
held as of 31/12/2022
300

Term of office on Rubis Supervisory Board
Date of first appointment: 9 June 2022
Date of last renewal: -
End of term of office: 2025 Shareholders’ Meeting convened to approve the 2024 financial statements 
List of offices held outside the Group in the last five years

Current terms of office


In France
Listed companies

•    Member of the Americas Advisory Board of Cie Plastic Omnium SE.


Unlisted companies

•   Member of the International Advisory Board of EDHEC Business School.


Abroad
Listed companies
None


Unlisted companies

•   Vice-Chairman of the Advisory Board of HPE Automotores do Brasil Ltda;

•   Member of the Board of Directors of SNEF Latam Engenharia e Tecnologia SA.

Terms of office that have expired during the last five years
None


Carole Fiquemont
Experience and expertise
Carole Fiquemont holds a degree in accounting. After several years’ experience in accounting and auditing, she joined Groupe Industriel Marcel Dassault (holding company of the Dassault Group) in 1998, where she currently serves as Corporate Secretary. In this capacity, she is in charge of and responsible for matters concerning accounting and consolidated financial statements, taxation, corporate matters, and the negotiation of investment and divestment transactions.

Member of the Accounts and Risk Monitoring Committee


Independent member


Born on 3 June 1965


French nationality


Current main position
Corporate Secretary of GIMD


Professional address
GIMD
9, rond-point
des Champs-Élysées –
Marcel Dassault
75008 Paris – France


Number of Rubis shares
held as of 31/12/2022
1,375

Term of office on Rubis Supervisory Board
Date of first appointment: 11 June 2019
Date of last renewal: 9 June 2022
End of term of office: 2025 Shareholders’ Meeting convened to approve the 2024 financial statements
List of offices held outside the Group in the last five years

Current terms of office


In France
Listed companies

•   Member of the Management Board of Immobilière Dassault SA.


Unlisted companies

•   Director of Artcurial SA, CPPJ SA and Figaro Classifieds SA;

•   Member of the Supervisory Board of Les Maisons du Voyage SA, Marco Vasco SA, Dassault Real Estate SAS and Financière Dassault SAS.


Abroad

Listed companies

None


Unlisted companies

•   Director of Dasnimmo SA (Switzerland), Sitam SA (Switzerland), Sitam Ventures (Switzerland) and Sitam Luxembourg;

•   Manager of DRE Trebol de Diagonal (Spain);

•   Director of 275 Sacramento Street LLC (USA);

•   Director/Secretary of Sitam America (USA).

Terms of office that have expired during the last five years

•   Director of SABCA (Belgium) (listed company) and Terramaris International (Switzerland);

•   Secretary of Marcel Dassault Trading Corporation (USA).


Laure Grimonpret-Tahon
Experience and expertise
With a DEA (postgraduate degree) in international and European business law and litigation and a master’s degree in law and management from Essec, Laure Grimonpret-Tahon began her career in 2006 as counsel in Dassault Systèmes’ company and contracts departments before moving to Accenture Paris (2007-2014) as Legal Officer in charge of corporate matters, compliance and contracts. In 2014, she joined the Legal Department of CGI (an independent IT and business management services company). She is currently Legal Director for Western and Southern Europe, in charge of internal affairs, customer contracts and labour relations.

Chairwoman of the Compensation and Appointments Committee


Independent member


Born on 26 July 1981


French nationality


Current main position
General Counsel of CGI


Professional address
CGI
17, place des Reflets
Immeuble CB16
92097 Paris-La-Défense Cedex
– France


Number of Rubis shares
held as of 31/12/2022
433

Term of office on Rubis Supervisory Board
Date of first appointment: 5 June 2015
Date of last renewal: 10 June 2021
End of term of office: 2024 Shareholders’ Meeting convened to approve the 2023 financial statements
List of offices held outside the Group in the last five years

Current terms of office


In France

None


Abroad

None

Terms of office that have expired during the last five years

•    Member of the Board of Directors of Umanis SA.

 
Marc-Olivier Laurent
Experience and expertise
Marc-Olivier Laurent is a graduate of HEC and holds a PhD in African social anthropology from Paris-Sorbonne University. Between 1978 and 1984, he was responsible for investments at Institut de Développement Industriel (IDI). From 1984 to 1993, he headed the M&A, Corporate Finance and Equity division of Crédit Commercial de France. He joined Rothschild & Co. in 1993 as Managing Director, and then Partner. Until 2022, he was Managing Partner de Rothschild & Co Gestion and Executive Chairman de Rothschild & Co Merchant Banking. He is currently Chairman of the Supervisory Board of Rothschild & Co and Managing Partner of the Five Arrows Long Term fund.

Independent member


Born on 4 March 1952


French nationality


Current main position

Chairman of the Supervisory
Board of Rothschild & Co
Managing Partner of the Five
Arrows Long Term fund


Professional address

Rothschild & Co Five Arrows

Managers

23 bis, avenue Messina

75008 Paris – France


Number of Rubis shares
held as of 31/12/2022
23,868

Term of office on Rubis Supervisory Board
Date of first appointment: 11 June 2019
Date of last renewal: 9 June 2022
End of term of office: 2025 Shareholders’ Meeting convened to approve the 2024 financial statements
List of offices held outside the Group in the last five years

Current terms of office


In France
Listed companies
None


Unlisted companies

Vice-Chairman and member of the Supervisory Board of Caravelle.


Abroad
None


Terms of office that have expired during the last five years

•   Managing Partner of Rothschild & Co Gestion SAS (RCOG);

•    Executive Chairman of Rothschild & Co. Merchant Banking;

•   Member of the Supervisory Board of Arcole Industries;

•   Chairman and Member of the Board of Directors of Institut Catholique de Paris (ICP).


Cécile Maisonneuve
Experience and expertise
A graduate of École Normale Supérieure, Sciences Po Paris, and Université Paris IV-Sorbonne (Master), Cécile Maisonneuve began her career in 1997 at the French National Assembly as a civil servant, holding positions for 10 years successively within the Defence, Laws and Foreign Affairs Committees. She moved to the Areva Group, where she was responsible for their prospective and international public affairs before becoming the head of the Energy-Climate Centre of the Institut Français des Relations Internationales in 2013. She joined the Vinci Group in 2015, and headed their innovation and prospective lab, La Fabrique de la Cité, for six years. Ms Maisonneuve currently heads Decysive, a research, advisory and know-how transmittal firm focusing on energy, environmental and geopolitical issues. Ms Maisonneuve monitors these issues as a Senior Fellow of Institut Montaigne and as an advisor to the Energy-Climate Centre of the Institut Français des Relations Internationales. She also writes on these subjects in bi-monthly columns for L’Express and lectures at Sciences Po Paris.

Independent member


Born on 23 July 1971


French nationality


Current main position
Manager of Decysive


Professional address
Decysive
13, rue de Thorigny
75003 Paris – France


Number of Rubis shares
held as of 31/12/2022
100

Term of office on Rubis Supervisory Board
Date of first appointment: 9 June 2022
Date of last renewal: -
End of term of office: 2025 Shareholders’ Meeting convened to approve the 2024 financial statements
List of offices held outside the Group in the last five years

Current terms of office


In France
None


Abroad
None

Terms of office that have expired during the last five years

•    Member of the Board of Directors of La Française de l’Énergie (listed company);

•    Member of the Supervisory Board of Global Climate Initiatives.

 
Chantal Mazzacurati
Experience and expertise
Chantal Mazzacurati is a graduate of HEC business school. She spent her entire career with BNP and then BNP Paribas, where she held a variety of roles in finance, first in the Finance Department, then as Director of Financial Affairs and Industrial Investments, and finally as Head of the Global Equities business line.

Member of the Accounts and
Risk Monitoring Committee


Non-independent member


Born on 12 May 1950


French nationality


Current main position
Chief Executive Officer
of Groupe Milan SAS


Professional address
Groupe Milan
36, rue de Varenne
75007 Paris – France


Number of Rubis shares
held as of 31/12/2022
8,075

Term of office on Rubis Supervisory Board
Date of first appointment: 10 June 2010
Date of last renewal: 9 June 2022
End of term of office: 2025 Shareholders’ Meeting convened to approve the 2024 financial statements
List of offices held outside the Group in the last five years

Current terms of office


In France
Listed companies
None


Unlisted companies

•   Chief Executive Officer of Groupe Milan SAS.


Abroad
None

Terms of office that have expired during the last five years

•   Member of the Management Board of Groupe Milan;

•    Member of the Supervisory Board of BNP Paribas Securities Services (and member of the Risk Management and Appointments Committee).


Erik Pointillart
Experience and expertise
A graduate of the Institut d’Études Politiques in Paris, Erik Pointillart has 36 years’ experience in the French and European financial sector. He began his career in 1974 in BNP’s Finance Department. He joined Caisse des Dépôts in 1984, and became Chief Executive Officer of CDC Gestion in 1990. In 1994, he joined Écureuil Gestion as Director of Bond and Monetary Management, and in October 1999 became Director of Development and Chairman of the Company’s Management Board.

Member of the Compensation and Appointments Committee


Non-independent member


Born on 7 May 1952


French nationality


Current main position
Vice-Chairman of IEFP


Professional address
c/o Rubis
46, rue Boissière
75116 Paris – France


Number of Rubis shares
held as of 31/12/2022
1,851

Term of office on Rubis Supervisory Board
Date of first appointment: 24 March 2003
Date of last renewal: 10 June 2021
End of term of office: 2024 Shareholders’ Meeting convened to approve the 2023 financial statements
List of offices held outside the Group in the last five years

Current terms of office


In France

Listed companies

None


Unlisted companies

•   Vice-Chairman of IEFP.


Abroad


None

Terms of office that have expired during the last five years

•   Partner at Nostrum Conseil.


Carine Vinardi
Experience and expertise
An Itech Lyon engineer, Carine Vinardi holds a PhD in Industrial Engineering from UTC Compiègne-Sorbonne University. She began her career in 1997. Having worked in industry, Ms Vinardi has experience in operational management and managing cross-functional positions in different international companies and along the entire value chain. She is currently head of R&D and Operations at the Tarkett Group, which specialises in floor coverings and sports surfaces.

Independent member


Born on 13 February 1973


French nationality


Current main position
R&D and Operations EVP of Tarkett


Professional address
Tarkett
1 terrasse Bellini
Tour Initiale
92919 Paris La Défense – France


Number of Rubis shares
held as of 31/12/2022
250

Term of office on Rubis Supervisory Board
Date of first appointment: 9 June 2022
Date of last renewal: -
End of term of office: 2025 Shareholders’ Meeting convened to approve the 2024 financial statements
List of offices held outside the Group in the last five years

Current terms of office


In France
Listed companies
None


Unlisted companies

•   Independent Director, member of the Supervisory Board of Forlam SAS.


Abroad
None

Terms of office that have expired during the last five years
None


Role of the Supervisory Board

As the Company is incorporated under the legal form of a Partnership Limited by Shares, by law, the Supervisory Board is responsible for continuous oversight of the Company’s management. For this purpose, the Supervisory Board enjoys the same powers as the Statutory Auditors. As such, unlike the Board of Directors of a public limited company (société anonyme), the Supervisory Board may not intervene in the management and administration of the Company.

The Supervisory Board is assisted by its Committees, namely the Accounts and Risk Monitoring Committee and the Compensation and Appointments Committee.

The Supervisory Board’s recurring duties are notably specified in its internal rules (updated on 10 March 2022). They consist mainly of the following:

•   reviewing the accounts, ensuring the consistency of the accounting policies used to prepare the Company’s consolidated and separate financial statements and ensuring the quality, completeness and fairness of the financial statements;

•   monitoring the Group’s activity;

•   making a proposal on the principal Statutory Auditors in view of their appointment by the Shareholders’ Meeting and verifying their independence;

•   reviewing the independence of its (future) members;

•   establishing specialised Committees to assist it with the performance of its duties and appointing their members;

•   conducting a self-assessment;

•   providing an advisory opinion on the compensation policy applicable to the Managing Partners in accordance with the provisions of Article L. 22-10-76 of the French Commercial Code;

•   confirming that the compensation of the Managing Partners to be paid or awarded in respect of the past financial year complies with the compensation policy previously approved by the shareholders at the Shareholders’ Meeting and with the by-laws’ provisions;

•   confirming that the compensation of the Chairman of the Supervisory Board to be paid or awarded in respect of the past financial year complies with the policy previously approved by the shareholders at the Shareholders’ Meeting;

•   setting the compensation policy applicable to its members;

•   breakdown of the aggregate amount of compensation to be granted to members of the Supervisory Board, including a portion based on attendance and any Chairmanship and/or participation in Committees;

•   verifying compliance of the General Partners’ rights to profits;

•   granting authorisation prior to the conclusion of related-party agreements;

•   assessing the efficiency of the procedure for evaluating agreements relating to ordinary course transactions entered into on arm’s length terms and improving such procedure as appropriate;

•   preparing the report on corporate governance (which is attached to the management report) pursuant to Article L. 22-10-78 of the French Commercial Code;

•   preparing the report on its continuous management oversight mission;

•   deliberating on the professional and wage equality policy;

•   reviewing the quality of information provided to shareholders and to the market;

•   monitoring the exchanges the Company has with its shareholders and the market;

•   monitoring the corporate social responsibility (CSR) projects being implemented.

To enable the Supervisory Board to perform its duties, the internal regulations provide that it must be informed by the Management Board of matters such as:

•   trends in each division and future prospects within the framework of the strategy set by the Management Board;

•   acquisitions and/or disposals of businesses or subsidiaries, equity interests and, more generally, any major investment;

•   changes in bank debt and financial structure within the framework of the financial policy set by the Management Board;

•   internal control procedures defined and developed by companies of the Group, under the authority of the Management Board, which is responsible for overseeing the implementation of those procedures;

•   draft agendas for Shareholders’ Meetings;

•   any major acquisition that is not part of the defined strategy prior to its completion;

•   CSR projects;

•   compliance matters;

•   status of the Management Board succession plan implemented by the General Partners.

Corporate bodies in charge of monitoring CSR

The bodies involved in defining the CSR policy within the Group, the actions carried out and the control of their implementation are described in the NFIS (see chapter 4, section 4.1.1.3).

Thus, the Supervisory Board is informed of the strategy implemented by the Group (excluding the Rubis Terminal JV) concerning CSR issues and, in particular, climate-related challenges.

The Supervisory Board receives reports on the work carried out by the Accounts and Risk Monitoring Committee, which notably monitors:

•   the CSR Roadmap, including climate objectives and commitments;

•   the significant regulatory changes (e.g., CSRD, European Green Taxonomy, duty of vigilance) and their challenges for the Group; and

•   the Group’s main ethics, social and environmental risks

  In addition, the Supervisory Board receives the report on the work carried out by the Compensation and Appointments Committee, which examines:

•   the non-financial performance criteria (related to workplace safety, climate and, more broadly, the Group’s CSR policy) proposed by the General Partners as part of a Management Board’s compensation policy aligned with the Group’s strategy; and

•   specific skills, in particular CSR and climate-related challenges, which could enrich the Board’s work and serve as a basis for the selection of new candidates.

Diversity policy applied to the Supervisory Board and selection process for its members

The composition of the Supervisory Board is designed to ensure that it is able to fulfil all of its duties.

When examining and giving an opinion on its current and future composition, the Supervisory Board relies on the work of its Compensation and Appointments Committee, on the responses to a questionnaire sent annually to each of its members, and on the results of the three-yearly formalised assessment of its functioning carried out by a specialised firm at end-2022. On the advice of the Compensation and Appointments Committee, the Supervisory Board ensures that its members have complementary skills (based notably on education and professional experience) and are diverse from a personal point of view (based in particular on nationality, gender and age). Other factors are also taken into account (independence, compliance with the rules on multiple directorships and the person’s ability to fit in with the Supervisory Board’s culture).

The selection of new candidates and the renewal of the terms of office of current members is examined by the Compensation and Appointments Committee and then by the Supervisory Board in the light of the above-mentioned factors, with a view to enriching the work of the Supervisory Board.

The selection of any new candidates is carried out by the Compensation and Appointments Committee, which may use a specialised firm (as was the case in 2021-2022). The candidates, selected on the basis of precise criteria (profiles and skills) set by the Supervisory Board on the advice of the Compensation and Appointments Committee, are interviewed by the Compensation and Appointments Committee, which forwards its opinion to the Supervisory Board. The latter selects the candidates proposed to the future Shareholders’ Meeting.

At its meeting of 16 March 2023, the Supervisory Board noted, in light of the work carried out by the Compensation and Appointments Committee, that, with the election of four new members in the last two years, its current composition fully meets the requirements of the diversity policy that it had set for itself and, consequently, set the following objectives for the next three years: maintain international experience and CSR skills in more than half and more than one-third of its members, respectively, select at least one new member with expertise in the Company’s business sectors, and achieve an independence rate of at least 70% on the Accounts and Risk Monitoring Committee by 2026.

TABLE SUMMARISING THE DIVERSITY OF SKILLS OF THE SUPERVISORY BOARD (AS OF 16 MARCH 2023)*

                  Management
of large industrial
or banking groups
International
experience
Finance
and audit
 Legal   M&A  Compliance Insurance  HR    CSR  Security
Olivier Heckenroth  
Nils Christian Bergene      
Hervé Claquin              
Carole Fiquemont          
Laure Grimonpret-Tahon        
Marc-Olivier Laurent            
Cécile Maisonneuve                
Chantal Mazzacurati            
Alberto Pedrosa          
Erik Pointillart              
Carine Vinardi          
TOTAL 7
(64%)
8
(73%)
8
(73%)
4
(36%)
6
(54%)
4
(36%)
3
(27%)
4
(36%)
5
(45%)
4
(36%)


* Based on the statements of the members of the Supervisory Board.

Independence

Each year, the Supervisory Board assesses the independence of its members and of potential candidates. It relies on the work carried out and the advice issued by the Compensation and Appointments Committee. The Supervisory Board has chosen to comply with the definition of independence set out in the Afep-Medef Code and considers that a member is independent when he/she has no relationship of any kind whatsoever with the Company, its Group or its Management that may compromise the exercise of his/her freedom of judgement. Therefore, to be qualified as independent, a member of the Supervisory Board must meet all the following criteria:

•   not be, or have been during the previous five years, an employee or executive corporate officer (dirigeant mandataire social exécutif) of the Company, or an employee, executive corporate officer or Director of one of the Company’s consolidated companies;

•   not be an executive corporate officer of a company in which the Company holds a direct or indirect position as a Director, or in which an employee designated in such capacity or an executive corporate officer of the Company (currently or who has been so within the past five years) holds a directorship;

•   not be a customer, supplier, investment banker, finance banker or consultant:

•   that is significant to the Company or its Group, or

•   for which the Company or its Group represent a significant share of business;

•   not have close family ties with a corporate officer;

•   not have close family ties with a corporate officer;

•   not have been a Statutory Auditor of the Company during the previous five years;

•   not have been a member of the Supervisory Board for more than 12 years, since a member can no longer be classified as independent as of the anniversary date of their 12 years of service;

•   the Chairman of the Supervisory Board cannot be considered independent if he/she receives variable compensation in cash or securities or any compensation linked to the performance of the Company or the Group;

•   not represent a significant shareholder (> 10% of share capital and/or voting rights) that exercises control over the Company.

In accordance with the recommendations of the Afep-Medef Code, the Supervisory Board is free to determine that one of its members cannot be qualified as independent even though he/she fulfils the independence criteria listed above.

After examining the situation of each of its members in the light of the work and opinion of the Compensation and Appointments Committee, the Supervisory Board, at its meeting of 16 March 2023, considered that Carole Fiquemont, Laure Grimonpret-Tahon, Cécile Maisonneuve, Carine Vinardi, Nils Christian Bergene, Marc-Olivier Laurent and Alberto Pedrosa met the independence criteria set by the Company and should therefore be qualified as independent. In particular, the Compensation and Appointments Committee carried out an in-depth examination of the situation of Marc-Olivier Laurent and considered that, to the extent that, as his position as an executive (Managing Partner) of Rothschild & Co Gestion had ended at the end of 2022, he could now be qualified as independent. The Supervisory Board, having taken note of the work and the opinion of the Compensation and Appointments Committee, confirmed that Marc-Olivier Laurent met the independence criteria set by the Company and should therefore be qualified as independent. Finally, the Supervisory Board considered that Chantal Mazzacurati, Olivier Heckenroth, Hervé Claquin and Erik Pointillart could not be qualified as independent due to their length of service on the Board.

TABLE SUMMARISING THE INDEPENDENCE OF MEMBERS OF THE SUPERVISORY BOARD (AS OF 16 MARCH 2023)

        Independence criteria        
  Not an
employee or
corporate
officer
during
the last
five years
Absence of
“reciprocal
offices”
No
significant
business
relationship
No close
family
ties with
a corporate
officer
Not a
Statutory
Auditor
in the last
five years
Seniority
on the Board
≤ 12 years
No variable or
performance
related
compensation
Share
capital and
voting rights
≤ 10%
Indepen-
dence
Olivier Heckenroth  
Nils Christian Bergene
Hervé Claquin    
Carole Fiquemont
Laure Grimonpret-Tahon
Marc-Olivier Laurent
Cécile Maisonneuve
Chantal Mazzacurati  
Alberto Pedrosa
Erik Pointillart    
Carine Vinardi
Independence rate                 64%

As of 16 March 2023, the independence rate of the Supervisory Board was 64% (which complies with the provisions of its internal rules and the recommendations of the Afep-Medef Code).

At the end of the 2023 Shareholders’ Meeting, subject to the renewal of the term of office of Olivier Heckenroth, the independence rate of the Supervisory Board would remain at 64%.


5.3.2 Conditions for preparing and organising the work of the Supervisory Board


Training of Supervisory Board members

At the time of his or her appointment, any new member of the Supervisory Board is welcomed by the General Partners and is given a file presenting the history of the Group, its activities, its legal and financial specificities, and the various aspects of the role of a member of the Supervisory Board in a Partnership Limited by Shares listed on a regulated market.

In addition, members of the Supervisory Board may, in any circumstances, freely contact the Finance Department and Rubis’ Corporate Secretary for any explanations or additional information they may require to perform their duties.

Furthermore, visits to the Group’s sites are regularly organised for any new member and on request for any other member.

Thus, the Supervisory Board will visit Rubis Énergie’s facilities in Switzerland and will meet several of its Senior Managers and employees in June 2023.

In addition, the members of the Supervisory Board may, if they wish, benefit from the training which they deem necessary for the performance of their duties.

Ethics of Supervisory Board members

The Supervisory Board’s internal regulations describe the rights and duties of its members. In particular, members must demonstrate loyalty, integrity and independence of judgement and keep confidential non-public information acquired in the course of their duties. In addition, Supervisory Board members must report any conflict of interest, even potential conflicts, in view of the Supervisory Board’s work. In such a situation, they must abstain from participating in the discussions and voting on the corresponding decisions.

Activities of the Supervisory Board

The procedures for preparing and organising the Supervisory Board’s work are set out in its internal regulations.

Under the terms of those regulations, the Supervisory Board meets as often as the interests of the Company require, and, in any event, at least three times per year, at the time of the review of the half-year and annual consolidated and separate financial statements and at a meeting that is mainly dedicated to monitoring various issues relating to CSR and governance. This minimum frequency is considered sufficient, in view of the fact that, unlike the Board of Directors of a public limited company (société anonyme), the Supervisory Board must not take part in the Company’s management and administration.

The Supervisory Board met three times during the year under review (four times in the previous financial year).

The Supervisory Board relies on the in-depth work carried out by the Committees it has formed. The reports that the Chairmanship of each Committee submits to the Supervisory Board and the quality of the documents provided to it, within a reasonable timeframe prior to the meeting, enable the Supervisory Board to acquire specific and up-to-date knowledge about the various subject areas that fall within the scope of its duties. In addition, the Management Board, the Chief Financial Officer, the Managing Director in charge of New Energies, CSR, and Communication, the Corporate Secretary and, for topics relating to their areas of competence, the Statutory Auditors, provide all clarifications that are necessary for a proper understanding of the issues on the agenda.

During the year under review, in addition to addressing recurring matters, the Supervisory Board notably:

•   analysed future changes in its composition with regard, in particular, to independence, the diversity policy, the results of its three-yearly assessment conducted in early 2020 and market expectations;

•   validated, after the Compensation and Appointments Committee’s positive opinion, the three new candidates for the office of Supervisory Board members proposed to the 2022 Shareholders’ Meeting;

•   monitored the market for Rubis’ shares, investors’ specific expectations with respect to the French market, and the dialogue with analysts, ratings agencies and proxy advisors put in place by the Company;

•   reviewed the draft resolutions the Management Board wished to submit to the 2022 Shareholders’ Meeting;

•   analysed the voting results of the 2022 Shareholders’ Meeting and shareholders’ feedback;

•   was kept informed of the CSR approach (in particular the climate strategy) implemented and the monitoring of the objectives of the CSR Roadmap Think Tomorrow 2022-2025, in June 2022;

•   was kept informed of changes related to the European Green Taxonomy;

•   monitored the Group’s development with an extension to renewable energies (in particular via the strategic acquisition of the Photosol entities);

•   set up a formalised three-yearly assessment, beginning in the last quarter of 2022, of its functioning and that of its Committees by a specialised firm;

•   was kept informed of the Management Board succession plan implemented by the General Partners.

•   monitored the procedure for selecting a new principal Statutory Auditor and chose a candidate to propose to the 2022 Shareholders’ Meeting (as a replacement for Mazars and Monnot & Associés);

•   adopted a new version of its internal charter on related-party agreements and the procedure for assessing agreements relating to ordinary course transactions entered into on arm’s length terms;

•   reviewed and approved the new version of its internal rules and those of the Accounts and Risk Monitoring Committee.

During the financial year under review, the attendance rate was 97% (100% in the previous year).

An annual executive session implemented as from financial year 2023

Starting in financial year 2023, an annual meeting of the Supervisory Board without the presence of the Management Board and members of the Company’s functional departments has been set up, in order, notably, to discuss any subjects related to its duties. The first executive session took place at the end of the Supervisory Board meeting of 16 March 2023.

Supervisory Board Committees

The Supervisory Board appoints the Accounts and Risk Monitoring Committee members and the Compensation and Appointments Committee members and defines their organisation, operation and missions. These Committees are composed exclusively of members of the Supervisory Board and assist the Supervisory Board with the performance of its duties. Both Committees must be chaired by an independent member.

ACCOUNTS AND RISK MONITORING COMMITTEE

In accordance with its internal regulations (which were updated on 10 March 2022), the Accounts and Risk Monitoring Committee assists the Supervisory Board with its continuous oversight of the Company’s management. In particular, it is responsible for examining the following matters:

•   the process for preparing financial information;

•   the monitoring of accounting and financial control systems, as well as financial and non-financial risk management systems;

•   the procedure for the selection of new principal Statutory Auditors of the Company (or their renewal of the terms of office) and recommendation to the Supervisory Board; the monitoring of the Statutory Auditors’ work and verifying the compliance of their working procedures;

•   the rules for approval, delegation and monitoring of services other than the certification of financial statements performed by the Statutory Auditors;

•   following-up on subjects related to CSR;

•   the monitoring of compliance issues.

The Committee is specifically responsible for monitoring:

•   the CSR Roadmap, including climate objectives and commitments;

•   the significant regulatory changes (e.g., CSRD, European Green Taxonomy, duty of vigilance) and their challenges for the Group; and

•   the Group’s main ethics, social and environmental risks.

The Committee regularly reports to the Supervisory Board on the performance of its duties and on the results of the audit certification process, how this process contributed to the integrity of the financial information and the role the Committee played in that process. The Committee must inform the Supervisory Board without delay of any difficulty encountered.

In accordance with its internal rules, the Committee’s members are selected in particular for their expertise and skills in the areas of accounting, finance and risks, due in particular to their training, their experience in General Management of commercial or insurance companies and/ or their positions in banking institutions. The Committee is chaired by an independent member. The Chairman of the Supervisory Board is an ex officio member of the Committee.

All current members are financial experts and one of them has specific CSR skills.

As of 16 March 2023, the Accounts and Risk Monitoring Committee had five members: Nils Christian Bergene (Chairman), Carole Fiquemont, Olivier Heckenroth, Chantal Mazzacurati and Alberto Pedrosa. At that date, three members (including the Chairman) out of five were independent (rate of independence of 60%).

At the end of the 2023 Shareholders’ Meeting, subject to the renewal of the term of office of Olivier Heckenroth, the composition of this Committee would be unchanged, with an independence rate maintained at 60%.


CHANGES IN THE COMPOSITION OF THE ACCOUNTS AND RISK MONITORING COMMITTEE BETWEEN THE SHAREHOLDERS’ MEETINGS OF 9 JUNE 2022 AND 8 JUNE 2023

(subject to the renewal of the term of office of Olivier Heckenroth)

  At the end of the
Shareholders’ Meeting of
Departure Appointment Composition
Accounts and
Risk Monitoring
Committee
9 June 2022 Marie-Hélène Dessailly(1)
Marc-Olivier Laurent
Carole Fiquemont(1)
Alberto Pedrosa(1)

Nils Christian Bergene (Chairman)(1)
Carole Fiquemont(1)
Olivier Heckenroth
Chantal Mazzacurati(2)
Alberto Pedrosa(1)

8 June 2023 - -
(1) Independent member of the Supervisory Board.
(2) Member having lost her independence qualification at the end of the 9 June 2022 Shareholders’ Meeting due to her length of service on the Supervisory Board.

The Accounts and Risk Monitoring Committee meets at least once every six months to review the annual and half-yearly consolidated and separate financial statements and to analyse, monitor and manage risks and CSR and compliance issues.

During the financial year under review, the Accounts and Risk Monitoring Committee met three times (twice in the previous year).

In accordance with its internal regulations, the members of the Accounts and Risk Monitoring Committee are given a reasonable amount of time (at least two days) to review the financial statements and other accompanying documents before the Committee meets. They also receive a summary of work carried out by the Statutory Auditors. The Management Board, the Statutory Auditors, the Chief Financial Officer, the Managing Director in charge of New Energies, CSR and Communication, the Director of Accounting and Consolidation, the Corporate Secretary and any other person whose presence is deemed necessary participate in the meetings of the Accounts and Risk Monitoring Committee. However, at the end of the meeting, the members of the Committee meet alone with the Statutory Auditors, without the presence of the Management Board and members of Rubis’s functional departments, to review the consolidated and separate financial statements, risks and the findings submitted to them by the Statutory Auditors following their work.

During the year under review, the Accounts and Risk Monitoring Committee reviewed the following topics, among others:

•   review of the consolidated and separate financial statements, both annual and half-year;

•   procedure for selecting a new principal Statutory Auditor (oral interview of candidates and recommendation to the Supervisory Board after verification that independence conditions were met);

•   presentation of consolidated risk maps;

•   review of disputes, major events (including changes in scope) and indications of impairment;

•   presentation on the Group’s climate challenges (carbon footprint assessment, Group strategy);

•   presentation of the Group’s work on the European Green taxonomy for sustainable activities;

•   presentation of the Group’s work on CSR matters, including monitoring the objectives of the CSR Roadmap, Think Tomorrow 2022-2025, in June 2022;

•   presentation by Rubis Énergie’s Control and Internal Audit Department on the assignments carried out in 2021 and the audit plan for 2022;

•   annual review of the implementation of the corruption prevention system;

•   update on cybersecurity challenges;

•   update on the challenges related to the increase in petroleum product prices.

All the documents submitted, the presentation made by the Management Board and the answers provided to the questions asked, reassured the Committee as to the proper management of risks within the Group.

During the financial year under review, the attendance rate was 100% (as in the previous year).

COMPENSATION AND APPOINTMENTS COMMITTEE

In accordance with its internal rules (updated on 22 June 2021), the Compensation and Appointments Committee assists the Supervisory Board with governance issues. In particular, it is responsible for examining the following matters:

•   the formulation of any proposal for renewal of the terms of office or appointment to the Supervisory Board and its Committees, in accordance with the diversity policy;

•   the independence of (future) members of the Supervisory Board with regard to the criteria of the Afep-Medef Code;

•   the organisation of the three-yearly assessment of the functioning of the Supervisory Board;

•   the compensation policy applicable to the Management Board;

•   the determination of the components of compensation to be paid or awarded in respect of the past financial year to the Management Board in accordance with the policy approved by the Shareholders’ Meeting and with the by-laws’ provisions, and report on its work to the Supervisory Board;

•   the determination of the components of compensation to be paid or awarded in respect of the past financial year to the Chairman of the Supervisory Board in accordance with the policy approved by the Shareholders’ Meeting, and report on its work to the Supervisory Board;

•   the proposal to the Supervisory Board of a draft compensation policy applicable to the Supervisory Board;

•   the formulation of a proposal on the total amount of compensation to be granted to the members of the Supervisory Board and the Committees, as well as the allocation of such compensation, including a portion based on attendance and any Chairmanship and/or participation in Committees;

•   the draft report of the Supervisory Board on corporate governance.

As part of its thinking on changes in the composition of the Supervisory Board and its Committees and in accordance with the Group’s diversity policy, the Compensation and Appointments Committee discusses the succession plan in respect of the Chairmanship of the Supervisory Board. However, it does not participate in preparing the succession plan for executive corporate officers (dirigeants mandataires sociaux), as this is the sole responsibility of the General Partners. The Compensation and Appointments Committee, like the Supervisory Board, is nevertheless regularly kept informed of the status of the succession plan for the Management Board implemented by the General Partners.

The Committee regularly reports to the Supervisory Board on the performance of its duties.

In accordance with its internal regulations, this Committee is chaired by an independent member.

Three of the current members have specific CSR skills.

As of 16 March 2023, the Compensation and Appointments Committee had four members: Laure Grimonpret-Tahon (Chairwoman), Nils Christian Bergene, Olivier Heckenroth and Erik Pointillart. At such date, two members (including the Chairwoman) out of four were independent (independence rate of 50%).

At the end of the 2023 Shareholders’ Meeting, subject to the renewal of the term of office of Olivier Heckenroth, the composition of this Committee would be unchanged, with an independence rate maintained at 50%.

CHANGES IN THE COMPOSITION OF THE COMPENSATION AND APPOINTMENTS COMMITTEE BETWEEN THE SHAREHOLDERS’ MEETINGS OF 9 JUNE 2022 AND 8 JUNE 2023

(subject to the renewal of the term of office of Olivier Heckenroth)


At the end of the

Shareholders’ Meeting of

Departure Appointment Composition
Compensation and Appointments Committee 9 June 2022 Chantal Mazzacurati(1) Nils Christian Bergene(2) Laure Grimonpret-Tahon (Chairwoman)(2)
Nils Christian Bergene(2)
Olivier Heckenroth
Erik Pointillart
8 June 2023 - -
(1) Member having lost her independent qualification at the end of the 9 June 2022 Shareholders’ Meeting due to her length of service on the Supervisory Board.
(2) Independent member of the Supervisory Board.

In view of the growing number of issues relating to compensation and appointments and the resulting increase in workload, at its meeting of 11 March 2021, the Supervisory Board decided to schedule a second annual meeting of this Committee. Thus, the Compensation and Appointments Committee met twice during the financial year under review (as in the previous financial year).

In accordance with its internal regulations, Committee members are given a reasonable amount of time (at least two days) to review the documents before the Committee meets. The Company’s Corporate Secretary, as well as Jacques Riou, Chairman of Agena, a co-Managing Partner (non-General Partner) of the Company, and the Managing Director in charge of New Energies, CSR and Communication, attend the meetings.

During the financial year ended, the Compensation and Appointments Committee reviewed the following topics, among others:

•   the determination of the components of the Management Board’s compensation in respect of financial year 2021;

•   the compensation policy applicable to the Management Board in respect of financial year 2022;

•   the determination of the components of compensation of the Chairman of the Supervisory Board in respect of financial year 2021;

•   the proposed breakdown of compensation to members of the Supervisory Board in respect of financial year 2021;

•   the proposed compensation policy applicable to members of the Supervisory Board in respect of financial year 2022;

•   information on the compensation policy applicable to the Group’s main executives (dirigeants non mandataires sociaux);

•   the analysis of the current composition of the Supervisory Board and its Committees and future changes, particularly in light of independence, the diversity policy, the results of the three-yearly assessment carried out in early 2020 and market expectations;

•   interview of new candidates for the office of Supervisory Board member selected among those presented by the specialised firm and opinion on these candidacies sent to the Supervisory Board;

•   implementation of a formalised three-yearly assessment, by a specialised firm, of the functioning of the Supervisory Board and its Committees, starting in the last quarter of 2022;

•   status of the Management Board succession plan implemented by the General Partners.

During the financial year under review, the attendance rate was 100% (as in the previous year).

Assessment of the Supervisory Board and consideration of points of attention

Each year, the Supervisory Board informally discusses its composition, organisation and functioning, as well as those of its Committees in order to improve their effectiveness.

A formalised, in-depth assessment is carried out every three years on the basis of a detailed, anonymous and updated questionnaire given to members of the Supervisory Board.

The last formalised three-yearly assessment, which began in the last quarter of 2022, was entrusted to a specialised firm. It issued a report on the basis of the questionnaires collected and an interview conducted with each member of the Supervisory Board. This assessment focused in particular on the following points:

•   the composition, organisation and functioning of the Supervisory Board and its Committees;

•   knowledge of the Group (through the following topics: the Group business lines and environment, risk management and control procedures and CSR (including compliance and ethics));

•   the relationship of the Supervisory Board and the Committees with the Management Board and/or the Statutory Auditors (quality of information provided and of dialogue as well as clarity of the role and responsibilities of each one);

•   areas and means of improvement;

•   the contribution of the members to the work of the Supervisory Board and that of the Committees, assessed during an individual interview with the specialised firm.

A report on this assessment was made in March 2023 to the Compensation and Appointments Committee and the Supervisory Board by the specialised firm that conducted it. In the light of the information thus presented and discussion between the members of the Supervisory Board during the executive session following the meeting of 16 March 2023, it emerged that:

•   the composition, size, diversity and independence of the Supervisory Board and its Committees were adapted to their duties;

•   the functioning of the Supervisory Board and its Committees was satisfactory, as was the documentation made available to them;

•   ways to improve the Supervisory Board’s contributions to the Management Board have been expressed and measures will be put in place by the Supervisory Board during the financial year 2023 and set out in the 2023 Universal Registration Document.

Attendance of Supervisory Board members and Committee members at meetings

The table below sets out the attendance of each member at meetings of the Supervisory Board and of the specialised Committees in financial year 2022.


SUMMARY TABLE OF MEMBERS’ ATTENDANCE AT THE MEETINGS OF THE SUPERVISORY BOARD AND THE COMMITTEES IN 2022

Members of the Supervisory Board   Supervisory
Board(1)
          Accounts and
Risk Monitoring
Committee(2)
          Compensation
and Appointments
Committee(3)
Olivier Heckenroth   100%   100%   100%
Nils Christian Bergene(4)   100%   100%   100%
Hervé Claquin   100%        
Carole Fiquemont(5)   100%   100%    
Laure Grimonpret-Tahon   100%       100%
Marc-Olivier Laurent(6)   66.67%   100%    
Chantal Mazzacurati(7)   100%   100%   100%
Cécile Maisonneuve(8)   100%        
Alberto Pedrosa(9)   100%   100%    
Erik Pointillart   100%       100%
Carine Vinardi(8)   100%        
Marie-Hélène Dessailly(6)(10)   100%   100%    
Aurélie Goulart-Lechevalier(10)   100%        
ATTENDANCE RATE   96.88%   100%   100%
(1) The Supervisory Board met three times in financial year 2022.
(2) The Accounts and Risk Monitoring Committee met three times in financial year 2022.
(3) The Compensation and Appointments Committee met twice in financial year 2022.
(4) Member of the Compensation and Appointments Committee from the Shareholders’ Meeting of 9 June 2022 and who was therefore only invited to the second meeting of this Committee in 2022.
(5) Member of the Accounts and Risk Monitoring Committee from the Shareholders’ Meeting of 9 June 2022 and who was therefore only invited to the third meeting of this Committee in 2022.
(6) Member of the Accounts and Risk Monitoring Committee until the Shareholders’ Meeting of 9 June 2022 and who was therefore only invited to the first two meetings of this Committee in 2022.
(7) Member of the Compensation and Appointments Committee until the Shareholders’ Meeting of 9 June 2022 and who was therefore only invited to the first meeting of this Committee in 2022.
(8) Member of the Supervisory Board appointed by the 9 June 2022 Shareholders’ Meeting and who was therefore only invited to the two meetings of the Supervisory Board held after that Meeting.
(9) Member of the Supervisory Board appointed by the 9 June 2022 Shareholders’ Meeting and of the Accounts and Risk Monitoring Committee, from that same Shareholders’ Meeting, and who was therefore only invited to meetings of the Supervisory Board and of the Accounts and Risk Monitoring Committee held after that Meeting.
(10) Member of the Supervisory Board until the Shareholders’ Meeting of 9 June 2022 and who was therefore only invited to the first meeting of the Supervisory Board in 2022.

5.4 Corporate officer compensation


5.4.1 Principles of the compensation policy applicable to corporate officers


Decision-making process followed for the determination, review and implementation of the compensation policy

Pursuant to Article L. 22-10-76(I) of the French Commercial Code, in Partnerships Limited by Shares whose shares are admitted to trading on a regulated market:

•   the policy applicable to the Management Board’s compensation is set by the General Partners (deciding unanimously, unless otherwise provided in the by-laws) after receiving an advisory opinion from the Supervisory Board and taking into account, as applicable, the principles and conditions provided for in the by-laws;

•   the compensation policy applicable to members of the Supervisory Board is established by the Supervisory Board.

In addition, under the terms of the internal regulations of the Company’s Supervisory Board and of the Compensation and Appointments Committee:

•   the advisory opinion on the General Partners’ proposal concerning the compensation policy applicable to the Management Board is issued by the Supervisory Board each year in the light of the work previously carried out by the Compensation and Appointments Committee;

•   each year, the Compensation and Appointments Committee submits to the Supervisory Board a draft compensation policy applicable to Supervisory Board members.

The compensation policies applicable to the Management Board and to the members of the Supervisory Board are submitted each year (and at the time of each significant change) for the approval of the Shareholders’ Meeting (in its ordinary form).

The compensation policy applicable to the Company’s corporate officers is designed to ensure stability. Nevertheless, the components of the compensation policy applicable to the Management Board (other than those relating to statutory fixed compensation) may be revised by a decision of the General Partners taken after receiving an advisory opinion from the Supervisory Board and subject to the approval of the Shareholders’ Meeting. Similarly, the compensation policy applicable to members of the Supervisory Board may be revised by a decision of the Supervisory Board and subject to the approval of the Shareholders’ Meeting.

In the event of shareholders not approving a resolution relating to a compensation policy, the compensation policy previously approved by the shareholders continues to apply and a draft resolution presenting a revised compensation policy must be submitted for approval at the next Ordinary Shareholders’ Meeting.

Each year, the Shareholders’ Meeting and the General Partners vote on the components (fixed, variable and exceptional) comprising the total compensation and benefits of any kind paid during or awarded in respect of the past financial year via separate resolutions for each Managing Partner (except when no compensation of any kind is paid to it during or awarded in respect of this financial year) and for the Chairman of the Supervisory Board.

If the compensation policy approved by the Shareholders’ Meeting is not complied with, no compensation of any kind whatsoever may be determined, awarded or paid by the Company, under penalty of being null and void.

Prior to the shareholders’ vote, in accordance with its internal regulations, the Company’s Compensation and Appointments Committee:

•   determines the components of compensation to be paid or awarded in respect of the past financial year to the Management Board in accordance with the policy approved by the Shareholders’ Meeting held during this financial year. The Supervisory Board verifies that these items comply with such policy;

•   determines the components of compensation to be paid or awarded in respect of the past financial year to the Chairman of the Supervisory Board in accordance with the policy approved by the Shareholders’ Meeting held during this financial year. The Supervisory Board verifies that these items comply with such policy;

•   proposes an allocation of the aggregate amount to be granted to the members of the Supervisory Board in respect of the past financial year. The Supervisory Board verifies that such amount and breakdown comply with the policy it established for the past financial year and which was approved by shareholders during this financial year.

Lastly, with the approval of the General Partners, the Shareholders’ Meeting votes on a single draft resolution concerning information on the fixed, variable and exceptional compensation paid during or awarded in respect of the past financial year to all corporate officers.

Compensation policy in line with the corporate interest, sales strategy and the sustainability of the Company

On the advice of the Supervisory Board, the General Partners ensure that the compensation policy applicable to the Management Board complies with the Company’s corporate interest, is in line with its business strategy and contributes to the Company’s sustainability.

Thus, the compensation policy applicable to the Management Board is in line with the Company’s interests to the extent that (i) its overall amount is measured against that paid to executive corporate officers of companies with equivalent market capitalisation (the Company conducts in-house studies or commissions studies from external firms to ensure this on a regular basis), (ii) the conditions governing employee compensation are taken into account since the fixed compensation is updated according to the indexed change in the hourly salary rates of employees (which in the meantime guarantees that any change in the fixed compensation is moderate), (iii) the annual variable compensation is capped, and (iv) no exceptional compensation of any kind is authorised. The General Partners and the Supervisory Board are also kept informed of the equity ratios and changes in those ratios in relation to the compensation of corporate officers and employees and the Company’s performance.

The compensation policy applicable to the Management Board notably forms part of the Group’s commercial strategy and thus contributes to the sustainability of the Company insofar as the criteria attached to annual variable compensation are based on regular growth in earnings, the solidity of the balance sheet, progressive improvement in employee’s employment conditions through the setting of objectives in the field of health/safety, progressive improvement in CO2 emissions and taking into account CSR challenges as a whole.

Similarly, the Supervisory Board ensures that the compensation policy that applies to its members is consistent with the Company’s corporate interest and contributes to its sustainability. Thus, the maximum annual compensation envelope for the Supervisory Board is measured, compared to the budgets for non-executive corporate officers of companies with equivalent market capitalisation (the Company conducts in-house studies or commissions studies from external firms to ensure this on a regular basis). In addition, this compensation is related in part to each member’s responsibilities (chairing and/or membership of Committees) and to his/her attendance.

Lastly, the comments and votes expressed by shareholders on compensation issues at Shareholders’ Meetings are analysed by the General Partners, the Supervisory Board and the Compensation and Appointments Committee (over 98.5% support for all resolutions relating to compensation issues at the 9 June 2022 Shareholders’ Meeting).

Application procedures for new corporate officers

The compensation policy applicable to the Management Board described below would apply (prorata temporis in the year in which he/she takes office) to any new Managing Partner.

The compensation policy applicable to the Supervisory Board described below would apply (depending on the number of meetings attended) to any new member of the Supervisory Board.

5.4.2 Compensation policy applicable to the Management Board in respect of financial year 2023

The Chairwoman of the Compensation and Appointments Committee presented her report on the compensation policy applicable to the Management Board in respect of financial year 2023, prepared by the General Partners, to the Supervisory Board meeting held on 16 March 2023. The latter was also provided with all the documents that had been given to the members of the Compensation and Appointments Committee.

At this meeting, the Supervisory Board issued a favourable opinion on the Management Board’s compensation policy for financial year 2023.

The General Partners met after the Supervisory Board meeting of 16 March 2023 to approve the Management Board’s compensation policy for financial year 2023, after having taken note of the Supervisory Board’s favourable opinion and account of the principles and conditions provided for in the by-laws.

Fixed compensation

In accordance with the changes to Article 54 of the by-laws and in line with the compensation policy applicable to the Management Board in respect of financial year 2022 approved by the 2022 Shareholders’ Meeting, the Management Board’s annual fixed compensation in respect of a given financial year has, since financial year 2022, been equal to the product of its annual fixed compensation paid in respect of the previous financial year and the rate of change over the financial year in question in the Insee index of the hourly wage rates for workers in the electricity, gas, steam and air conditioning production and distribution industry.

As was previously the case, the annual change in this reference index can only be calculated after the publication by Insee of the index for the fourth quarter of a given financial year (Y), at the end of March of the subsequent financial year (Y+1). The fixed compensation in respect of financial year Y is consequently paid in several stages:

•   in the first quarter of financial year Y, an initial payment based on the last known final compensation (Y-2);

•   after publication of the reference index for the fourth quarter of financial year Y-1 (end of March, Y), making it possible to calculate the definitive compensation for Y-1, an adjustment is made to the first quarter payment and interim payments are made based on this definitive Y-1 compensation;

•   after the reference index for the fourth quarter of financial year Y (end of March, Y+1) is published, the final balance of the compensation for Y is paid.

The rate of change in this Insee index will be published, and the Management Board’s final fixed compensation for financial year 2023 will therefore be known, after the end of financial year 2023, in March 2024. Pending this publication in March 2024, as described above, the fixed compensation for financial year 2023 will be paid in interim payments based on the amount of the last fixed compensation definitively determined and known, after validation by the Compensation and Appointments Committee and the Supervisory Board, i.e., that paid in respect of financial year 2022 (€2,437,946).

The determination in March 2024 of the final amount of the Management Board’s fixed compensation in respect of financial year 2023 will result in the payment of an adjustment balance.

The fixed compensation is freely awarded among the Managing Partners.

If the compensation policy for financial year 2023 were to be rejected by the 2023 Shareholders’ Meeting, the interim payments would be made on the basis of the last fixed compensation awarded, i.e., that awarded in respect of financial year 2022.

Annual variable compensation

The Management Board’s annual variable compensation is capped at 50% of the annual fixed compensation. No floor has been defined.

Consequently, the fixed portion and the maximum variable portion represent 67% and 33% of the maximum total annual compensation, respectively.

The Managing Partners’ compensation policy provides that the annual variable compensation is based entirely on annual criteria (consisting of objective indicators to measure their achievement at the end of the financial year in question) aligned with the Company’s strategy.

It is freely awarded among the Managing Partners.

The recent change in the Company’s strategy, which resulted in particular in the acquisition in April 2022 of the Photosol entities and the creation of a division dedicated to Renewable Electricity Production (Rubis Renouvelables), led the General Partners to review the policy applicable to the annual variable compensation of the Management Board from financial year 2023.

The Rubis Renouvelables division’s business model is based on financial objectives that are assessed over a longer term than those of the Group’s historical activity.

The removal as from the financial year 2023, of the triggering condition makes it possible to assess the achievement rate of performance criteria, financial (for 75%) and non-financial (for 25%), which remain stringent (as demonstrated by the variability of this rate in previous years, i.e., 67.5%, 20% and 45% for the financial years 2022, 2021 and 2020, respectively). These criteria all reflect major challenges for the Group’s development, particularly in terms of CSR.

For the financial year 2023, the financial criteria used reflect the quality of the Company’s management, with sustained TSR and EBITDA performance. The stringency of the earnings per share performance criterion has also been strengthened compared to previous years. Thus, in the absence of a performance higher than 102% of the FactSet consensus, no compensation based on this criterion will be due, contrary to the provisions of the policy applicable in previous financial years.

The weight of non-financial criteria has been increased compared to previous years. The removal, from the financial year 2023, of the criterion based on the quality of the balance sheet (regularly achieved in previous years) makes it possible to reinforce the weight of two of the three non-financial performance criteria previously selected (CO2 emissions and safety at work) which reflect majors challenges for the Group. In addition, the integration of the Rubis Photosol entities into the Group in 2022 results in their inclusion in the criterion based on safety at work for 2023 as well as a specific criterion based on their CSR approach.

The achievement rate of the quantitative and qualitative criteria will be assessed at the end of the financial year 2023 and will be disclosed in the 2023 Universal Registration Document.

The policy does not provide for the possibility of requesting the return of any variable compensation that may have been paid.

PROPOSED PERFORMANCE CRITERIA FOR VARIABLE COMPENSATION FOR FINANCIAL YEAR 2023

Financial criteria (75%) Achievement rate Weighting

Global performance of Rubis share
compared to its reference index (SBF 120)(1)

Superior to +2 percentage points = 100%
Between -2 percentage points and +2 percentage points = 50%
Inferior to -2 percentage points = 0%

25%

EBITDA performance
compared to the analysts’ consensus(2)

Superior to +2% = 100%
Between -2% and +2% = 50%
Lower than -2% = 0%

25%

Earnings per share (EPS) performance
compared to the analysts’ consensus(2)

Superior to +2% = 100%
Equal to or lower than +2% = 0%

25%
Non-financial criteria (25%) Achievement rate Weighting

Workplace safety: Frequency rate of occupational accidents with lost time > 1 day (excluding commuting accidents)(3) at Rubis SCA, Rubis Patrimoine, Rubis Énergie and Rubis Photosol in 2023 stable or lower than in 2022; in the event of the death of an employee, the criterion is considered not met

2023 rate 2022 rate = 100%
2023 rate > 2022 rate = 0%
or
Employee fatality = 0%

10%

Climate: CO2 emissions in 2023 (scopes 1 and 2) lower than in 2022 at Rubis Énergie(4)

2023 ratio < 2022 ratio = 100%
2023 ratio = 2022 ratio = 50%
2023 ratio > 2022 ratio = 0%

10%
CSR policy: setting of a CSR Roadmap at Rubis Photosol

CSR Roadmap set = 100%
CSR Roadmap not set = 0%

5%
(1) The relative global performance corresponds to the annual change in share price plus the dividend and detached rights.
(2) The Compensation and Appointments Committee refers to the analysts’ consensus published by FactSet. The forward-looking data (or analysts’ consensus) for the current financial year (Y) are the most recent known in the month following the publication of the annual financial statements of year Y-1. Therefore, for the variable compensation in respect of financial year 2023, the analysts’ consensus taken into account is that published during the month following the publication of the 2022 results (on 16 March 2023).
(3) Calculation of the rate: number of accidents with lost time in excess of 1 day (excluding commuting accidents) per million hours worked. It should be noted that travel carried out in connection with an employee’s activity during their working hours remains included in the accounting for occupational accidents (employees who travel on business, drivers, etc.). As a reference, for the scope used for 2023, this rate was 4.75 in 2022.
(4) Scope 1 corresponds to the direct emissions from our activities and scope 2 corresponds to the indirect emissions from the energy used by our activities. Scope 3 emissions are not included. They consist of all other indirect emissions (suppliers, use of sold finished products, etc.). Calculation of the ratio: volume of scopes 1 and 2 emissions over EBITDA. The volume of Rubis Énergie scopes 1 and 2 CO2 emissions compared to EBITDA makes it possible to assess the carbon intensity of operations. As a reference, this rate was 0.360 in 2022.

Benefits in kind

The Management Board’s compensation policy provides that the only benefit in kind from which the Managing Partners may benefit is a company car.

Multi-year variable compensation

No multi-year variable compensation is provided for in the Management Board’s compensation policy.

Exceptional compensation

No exceptional compensation is provided for in the Management Board’s compensation policy.

Long-term variable compensation

No long-term variable compensation is provided for in the Management Board’s compensation policy.

Components of compensation, allowances or benefits related to taking office

No compensation, allowances or benefits related to taking a corporate office are provided for in the Management Board’s compensation policy.

Components of compensation, allowances or benefits upon the end of the corporate office

No compensation, allowances or benefits upon the end of the corporate office are provided for in the Management Board’s compensation policy. As a result, the Managing Partners are not entitled to any severance payments or compensation for non-compete agreement.

Supplementary pension schemes

The policy does not provide for a supplementary pension scheme.


5.4.3 Supervisory Board compensation policy for financial year 2023

Supervisory Board member compensation consists exclusively of a fixed portion (40%) and a variable portion (60%) linked to the attendance rate at meetings. A share is also paid to the Chairmanships of the Supervisory Board and its Committees. No other component of compensation is paid or awarded to members of the Supervisory Board.

Any member newly appointed at the Shareholders’ Meeting receives, in the year of his/her appointment, 50% of the amount of the annual fixed portion and a variable portion calculated according to the number of meetings that he/ she actually attended.

In accordance with the Supervisory Board’s internal regulations, each member must reinvest half of the compensation he/she receives in Rubis securities until he/ she hold at least 250 shares. This does not apply to members who represent a company that is already a shareholder.

The maximum annual compensation envelope for the members of the Supervisory Board is set by shareholders at the Shareholders’ Meeting. In accordance with the 17th resolution adopted by the Shareholders’ Meeting of 10 June 2021, it currently amounts to €240,000. In a separate resolution, the 2023 Shareholders’ Meeting is asked to increase this amount to €300,000.

Subject to the approval by the 2023 Shareholders’ Meeting of this new maximum annual envelope, the compensation policy for its members set by the Supervisory Board on 16 March 2023, on the proposal of the Compensation and Appointments Committee of 15 March 2023, for the financial year 2023, would be the following:

•   annual compensation for a member of the Supervisory Board: €17,000 (including a variable portion of 60%);

•   annual compensation for a member of the Accounts and Risk Monitoring Committee: €10,000 (including a variable portion of 60%);

•   annual compensation for a member of the Compensation and Appointments Committee: €7,000 (including a variable portion of 60%);

•   Chairmanship of the Supervisory Board: €18,000;

•   Chairmanship of the Accounts and Risk Monitoring Committee: €10,000;

•   Chairmanship of the Compensation and Appointments Committee: €6,000.

If this new maximum annual budget is not approved by the 2023 Shareholders’ Meeting, the current annual envelope will remain in force and the compensation policy adopted by the Shareholders’ Meeting of 9 June 2022 would continue to apply, as follows:

•   annual compensation for a member of the Supervisory Board: €12,000 (including a variable portion of 60%);

•   annual compensation for a member of the Accounts and Risk Monitoring Committee: €9,000 (including a variable portion of 60%);

•   annual compensation for a member of the Compensation and Appointments Committee: €6,000 (including a variable portion of 60%);

•   Chairmanship of the Supervisory Board: €18,000;

•   Chairmanship of the Accounts and Risk Monitoring Committee: €9,000;

•   Chairmanship of the Compensation and Appointments Committee: €4,500.

5.4.4 Components of compensation paid during or awarded in respect of financial year 2022 to corporate officers

This section (i) presents the equity ratios and the annual progression of the Company’s compensation and performance and (ii) describes the components of compensation paid during or awarded in respect of financial year 2022 to each corporate officer, namely:

•   the Managing Partners: Gilles Gobin, Sorgema, Agena (represented by Jacques Riou), and GR Partenaires. Fixed compensation and annual variable compensation are freely awarded among the Managing Partners. Thus, Gilles Gobin and Sorgema receive 70% of the annual fixed and variable compensation, while Agena (represented by Jacques Riou) receives the remaining 30%. GR Partenaires receives no compensation

•   the Chairman of the Supervisory Board;

•   the other members of the Supervisory Board.

Equity ratio

In accordance with the provisions of Article L. 22-10-9, I., paragraphs 6 and 7 of the French Commercial Code, the Company presents equity ratios allowing the compensation of the Management Board and of the Chairman of the Supervisory Board to be compared to the average and median compensation of the Company’s employees on a full-time equivalent basis (excluding the Management Board and the Chairman of the Supervisory Board).

In addition, in accordance with recommendation 26.2 of the Afep-Medef Code and the guidelines published by Afep in February 2021, the Company presents additional equity ratios over an expanded scope, allowing the compensation of the Management Board and of the Chairman of the Supervisory Board to be compared to the average and median compensation of the Company’s employees in France on a full-time equivalent basis (excluding the Management Board and the Chairman of the Supervisory Board) and those of the French subsidiaries over which it has exclusive control within the meaning of Article L. 233-16(II) of the French Commercial Code (i.e., until 2019, Rubis Terminal and Rubis Énergie, then, from financial year 2020, Rubis Énergie and its exclusively-controlled French subsidiaries, and then, from financial year 2022, Rubis Énergie and Rubis Photosol and their exclusively controlled French subsidiaries).

To be able to provide information on an expanded scope, the Company has chosen to establish these ratios on the basis of compensation and benefits of all kinds paid during or awarded in respect of the year in question.

The elements taken into consideration for the Management Board and the Chairman of the Supervisory Board are set by the Afep guidelines (and, for financial years 2020 and 2021, are presented hereafter) and established on a gross basis. The elements taken into consideration for employees are also set by the Afep guidelines and established on a gross basis. They do not include any termination, non-compete or supplementary pension scheme benefits. The Management Board’s compensation policy does not provide for any multi-year variable compensation. Conversely, the employees of the Company and of the subsidiaries that are included in the expanded scope may benefit from such multi-year variable compensation. Thus, the increase in the average compensation of the Company’s employees and, to a lesser extent, that of the employees of the subsidiaries included in the expanded scope, is explained by the allocation of a higher number of performance shares to employees during financial year 2022 than the allocations of performance shares and stock options made during financial year 2021.

No table concerning GR Partenaires is presented as it does not receive any compensation in respect of its office as Managing Partner.

In addition, the Company believes that net income, Group share and consolidated Group EBITDA reflect the Group’s performance.

These ratios, as well as the annual change in such ratios, in the compensation of each Managing Partner and of the Chairman of the Supervisory Board, in the Group’s performance and in the average and median full-time equivalent compensation of employees are shown in the tables below. In preparing these tables, the Company referred to the Afep guidelines updated in February 2021.

COMPANY PERFORMANCE

Criteria  2022  2021  2020  2019  2018
Consolidated Group EBITDA (in thousands of euros)  669,494  532,297  505,587  523,996  500,349
Change compared to the previous financial year  +25.8%  +5.3%  -3.5%  +4.7%  +0.9%
Net income, Group share (in thousands of euros)  262,896  292,569  280,333  307,227  254,070
Change compared to the previous year  -10.1%  +4.4%  -9%  +21%  -4%
EQUITY RATIOS - MANAGEMENT BOARD               
Sorgema and Gilles Gobin (Managing Partners)  2022  2021  2020  2019  2018
Change in the compensation of Sorgema and Gilles Gobin  0.0%  +0.9%  +1.0%  -31.4%  +5.2%
Information on the scope of the listed company               
Change in the average compensation of employees  +159.5%  -63.1%  +6.6%  +78.3%  +16.4%
Ratio compared to average employee compensation  4.0  10.3  3.8  4.0  10.4
Change in the ratio compared to the previous financial year  -61%  +171%  -5%  -62%  -10%
Change in the median compensation of employees  +13.2%  +5.4%  -26.4%  +43.5%  +23.1%
Ratio compared to median employee compensation  12.3  14.0  14.6  10.6  22.3
Change in the ratio compared to the previous financial year  -12%  -4%  +38%  -52%  -14%
Additional information on the expanded scope               
Change in the average compensation of employees  +42.7%  -17.9%  +13.0%  +15.5%  -2.7%
Ratio compared to average employee compensation  16.0  22.9  18.6  20.8  35.1
Change in the ratio compared to the previous financial year  -30%  +23%  -10%  -41%  +9%
Change in the median compensation of employees  +8.6%  -6.8%  +16.0%  +1.7%  +0.2%
Ratio compared to median employee compensation  24.3  26.4  24.4  28.0  41.5
Change in the ratio compared to the previous financial year  -8%  +8%  -13%  -33%  +5%
Agena (Managing Partner) and its Chairman (Jacques Riou)  2022  2021  2020  2019  2018
Change in the compensation of Agena and its Chairman (Jacques Riou)  +4.2%  +3.2%  -1.1%  -24.1%  +4.2%
Information on the scope of the listed company               
Change in the average compensation of employees  +159.5%  -63.1%  +6.6%  +78.3%  +16.4%
Ratio compared to average employee compensation  2.5  6.3  2.3  2.4  5.7
Change in the ratio compared to the previous financial year  -60%  +174%  -4%  -58%  -10%
Change in the median compensation of employees  +13.2%  +5.4%  -26.4%  +43.5%  +23.1%
Ratio compared to median employee compensation  7.9  8.6  8.7  6.5  12.3
Change in the ratio compared to the previous financial year  +8%  -1%  +34%  -47%  -15%
Additional information on the expanded scope               
Change in the average compensation of employees  +42.7%  -17.9%  +13.0%  +15.5%  -2.7%
Ratio compared to average employee compensation  10.2  14.0  11.2  12.7  19.4
Change in the ratio compared to the previous financial year  -27%  +25%  -12%  -35%  +7%
Change in the median compensation of employees  +8.6%  -6.8%  +16.0%  +1.7%  +0.2%
Ratio compared to median employee compensation  15.5  16.2  14.6  17.1  23.0
Change in the ratio compared to the previous financial year  +4%  +11%  -15%  -26%  +4%

EQUITY RATIOS – CHAIRMANSHIP OF THE SUPERVISORY BOARD

   2022  2021  2020  2019  2018
Change in the compensation of the Chairman of the Supervisory Board (Olivier Heckenroth)  0.0%  +16.9%  0.0%  +27.2%  +12.4%
Information on the scope of the listed company               
Change in the average compensation of employees  +159.5%  -63.1%  +6.6%  +78.3%  +16.4%
Ratio compared to average employee compensation  0.1  0.3  0.1  0.1  0.1
Change in the ratio compared to the previous financial year  -67%  +200%  0%  0%  0%
Change in the median compensation of employees  +13.2%  +54%  -26.4%  +43.5%  +23.1%
Ratio compared to median employee compensation  0.3  0.4  0.3  0.2  0.3
Change in the ratio compared to the previous financial year  -25%  +33%  +50%  -33%  0%
Additional information on the expanded scope               
Change in the average compensation of employees  +42.7%  -17.9%  +13.0%  +15.5%  -2.7%
Ratio compared to average employee compensation  0.4  0.6  0.4  0.5  0.4
Change in the ratio compared to the previous financial year  -33%  +50%  -20%  +25%  0%
Change in the median compensation of employees  +8.6%  -6.8%  +16.0%  +1.7%  +0.2%
Ratio compared to median employee compensation  0.6  0.7  0.6  0.6  0.5
Change in the ratio compared to the previous financial year  -14%  +17%  0%  +20%  0%

Compensation paid during or awarded in respect of financial year 2022 to the Management Board

At its meeting of 15 March 2023, the Compensation and Appointments Committee determined the components of compensation to be paid or awarded in respect of financial year 2022 to the Management Board in accordance with the compensation policy approved by the Shareholders’ Meeting of 9 June 2022 and the rules set in the by-laws, and provided a report on its work to the Supervisory Board meeting of 16 March 2023. The Supervisory Board confirmed that these components comply with the Management Board’s compensation policy approved by the Shareholders’ Meeting of 9 June 2022.

To assess the achievement rate of the criteria attached to the annual variable compensation, the Compensation and Appointments Committee meeting of 15 March 2023 was able to benefit from the report provided by one of its members on the meeting of the Accounts and Risk Monitoring Committee held on 14 March 2023, which he chairs. The documents made available to the Accounts and Risk Monitoring Committee (including the 2022 consolidated and separate financial statements and the risk maps) and this report enabled the Compensation and Appointments Committee to determine the achievement rate of the criteria.

DETERMINATION OF FIXED COMPENSATION IN RESPECT OF FINANCIAL YEAR 2022

As the reference index for the fourth quarter of financial year 2022 was only published at the end of March 2023, the fixed compensation in respect of financial year 2022 was provisionally set by the Supervisory Board at the final amount paid in respect of financial year 2021, i.e., €2,391,465 (compared to €2,375,196 and €2,349,204 in respect of financial years 2020 and 2019, respectively). Following the publication of the index at the end of March 2023, this provisional compensation was automatically readjusted by the rate of change during the financial year 2022 of the Insee index of hourly wage rates for workers in the electricity, gas, steam and air conditioning production and distribution industry (rate of 1.0194).

The amount of the final fixed compensation awarded to the Management Board in respect of financial year 2022 was therefore set at €2,437,946 and immediately disclosed to the members of the Compensation and Appointments Committee. It will be included on the agenda of the next Supervisory Board meeting scheduled in June 2023.

DETERMINATION OF VARIABLE COMPENSATION IN RESPECT OF FINANCIAL YEAR 2022

At its meeting of 16 March 2023, the Supervisory Board noted that the net income, Group share for 2022 had not increased by at least 5% compared to 2021. As a result, since the triggering condition was not met (as was the case in respect of financial year 2021), the Supervisory Board concluded that no variable compensation was due in respect of financial year 2022.

In order to maintain a high disclosure and to monitor the achievement of the performance criteria attached to the annual variable compensation over several years, the Supervisory Board nevertheless examined their achievement in financial year 2022. Thus, it was established that the overall achievement rate of the quantitative and qualitative criteria reached 67.5% in respect of financial year 2022 (compared to 20% and 45% in respect of financial years 2021 and 2020, respectively). As in respect of financial years 2021 and 2020, no compensation was however paid since the triggering condition was not met.

ACHIEVEMENT RATE OF THE TRIGGERING CONDITION AND CRITERIA ATTACHED TO THE MANAGEMENT BOARD’S ANNUAL VARIABLE COMPENSATION IN RESPECT OF FINANCIAL YEAR 2022

Triggering condition for annual variable compensation: increase in net income, Group share in 2022 compared to 2021 ≥ 5%

Objectives 2022 2021 Change Achievement/
non-achievement
If net income, Group share in 2022 < 105% of net income, Group share in 2021
→ No trigger
€262,896k €292,569k -10.14% Condition not met
 →No trigger
→No annual variable
compensation due
If net income, Group share in 2022 ≥ 105% of net income, Group share in 2021
→Trigger
Performance criteria            
Quantitative criteria (75%) Weigh-
ting
Objectives 2022 Rubis
perfor-
mance
2022
reference
perfor-
 mance
2022
achieve-
ment rate
2022
amount due

Global performance of Rubis share

compared to its reference index (SBF 120)(1)

25%

  Superior to +2 percentage points = 100%

  Between -2 percentage points and +2 percentage points = 50%

  Inferior to -2 percentage points = 0%

-2.69% -8.53% 100% Not applicable as triggering condition not met  
EBITDA performance
compared to the analysts’ consensus(2)
25%

  Superior to +2% = 100%

  Between -2% and +2% = 50%

  Lower than -2% = 0%

€669m €563.9m 100%  
Earnings per share (EPS) FONT STYLE="color: #00002B">performance
compared to the analysts’ consensus(2)
25%

  Superior to +2% = 100%

  Between -2% and +2% = 50%

  Lower than -2% = 0%

€2.55 €2.84 0%  
Qualitative criteria (25%) Weigh-
ting
Objectives 2022 Rubis
performance
2022
achieve-
ment rate
2022
amount due
Balance sheet quality:
ratio of net financial debt to EBITDA
5% Ratio ≤ 2 = 100%
2 < Ratio ≤ 3 = 50%
Ratio > 3 = 0%
2 100%  
Workplace safety: frequency rate of occupational accidents with lost time > 1 day (excluding commuting accidents) per million hours worked in 2022 at Rubis SCA, Rubis Patrimoine and Rubis Énergie ≤ 2021 rate and no employee fatalities 7.5% 2022 rate ≤ 2021 rate = 100%
2022 rate > 2021 rate
or employee fatalities = 0%
2022 rate (4.7) >
2021 rate (3.4)(3)
and absence of
employee fatalities
0% Not applicable as triggering condition not met
Climate: CO2 emissionsin 2022 (scopes 1 and 2)lower than in 2021at Rubis Énergie(4) 7.5% 2022 ratio < 2021 ratio = 100%
2022 ratio = 2021 ratio = 50%
2022 ratio > 2021 ratio = 0%
2022 emission
volumes (0.360)
< 2021 emission
volumes (0.375)(5)
100%  
CSR Policy:
Definition of an internal carbon price at Rubis Énergie
5% Definition = 100%   
No definition = 0%
Internal carbon price set at Rubis Énergie 100%  
Overall achievement rate of performance criteria       67.5%  
VARIABLE COMPENSATION OF THE THE MANAGEMENT BOARD IN RESPECT OF FINANCIAL YEAR 2022 €0
(1) The relative global performance corresponds to the annual change in share price plus the dividend and detached rights.
(2) The Compensation and Appointments Committee refers to the analysts’ consensus published by FactSet. For the current financial year (Y), this is the consensus known in the month following the publication of the annual financial statements for year Y-1. Therefore, for the variable compensation for the financial year 2022, the analysts’ consensus taken into account is that published during the month following the publication of the 2021 results (on 10 March 2022).
(3) The rate of 3.55 communicated as a reference in the 2021 Universal Registration Document was a provisional rate.
(4) Scope 1 corresponds to the direct emissions from our activities and scope 2 corresponds to the indirect emissions from the energy used by our activities. Scope 3 emissions are not included. They consist of all other indirect emissions (suppliers, use of sold finished products, etc.). Calculation of the ratio: volume of scope 1 and 2 emissions over EBITDA.
(5) The rate of 0.39 communicated as a reference in the 2021 Universal Registration Document was a provisional rate.

BENEFITS IN KIND

As of 31 December 2022, the benefit in kind related to Gilles Gobin’s company car was valued at €13,679.

Compensation paid during or awarded in respect of financial year 2022 to Sorgema (of which Gilles Gobin is Manager)

Components of compensation
paid during or awarded in respect
of the financial year ended
  Amounts awarded
in respect of
financial year 2022
  Amounts paid
during financial
year 2022
  Presentation
Fixed compensation   €1,706,562   €1,685,413   Following the publication of the Insee index for financial year 2022 at the end of March 2023, the Management Board’s total fixed compensation was set by the Supervisory Board at €2,437,946 for the period, reflecting an increase of 1.94% compared to financial year 2021 (€2,391,465). The difference between the amount awarded in respect of financial year 2022 and that paid during the same financial year is due to the adjustment of the fixed compensation in respect of financial year 2021 that was carried out following the publication at the end of March 2022 of the Insee reference index for financial year 2021, which resulted in a payment during financial year 2022. This lag, which is specifically caused by the publication of the Insee index for year Y in March of year Y+1, will occur every year.
Sorgema received 70% of this total fixed compensation.
For more information, please refer to the above section on Determination of fixed compensation in respect of financial year 2022.
Annual variable compensation   €0   €0   Capped at 50% of the annual fixed compensation and fully subject to performance criteria.
The triggering condition was not met because the change in 2022 net income, Group share (€262,896k) compared to 2021 net income, Group share (€292,569k) < 105%. Therefore, no annual variable compensation is due in respect of financial year 2022.
For more information, please refer to the above table presenting the achievement level of the triggering condition and the performance criteria attached to the Management Board’s annual variable compensation in respect of financial year 2022.
Multi-year variable compensation   Not applicable   Not applicable   The policy does not provide for multi-year variable compensation.
Exceptional compensation   Not applicable   Not applicable   The policy does not provide for exceptional compensation.
Stock options, performance shares or any other long-term compensation   Not applicable   Not applicable   The policy does not provide for the allocation of stock options, performance shares or any other long-term compensation.
Benefits in kind   €0   €0   No benefits in kind were awarded.
Compensation, allowances or benefits related to taking on a corporate office   Not applicable   Not applicable   The policy does not provide for compensation, allowances or benefits related to taking on a corporate office.
Severance payments   Not applicable   Not applicable   The policy does not provide for severance payments.
Consideration for a non-compete agreement   Not applicable   Not applicable   The policy does not include a non-compete agreement.
Supplementary pension schemes   Not applicable   Not applicable   The policy does not provide for a supplementary pension scheme.

Compensation paid during or awarded in respect of financial year 2022 to Gilles Gobin

Gilles Gobin has a company car, a benefit estimated at €13,679 as of 31 December 2022 (€17,681 as of 31 December 2021). As in previous financial years, no other compensation of any kind was paid during or awarded to him in respect of financial year 2022. Accordingly, the Company has decided not to reproduce the entire table required by the Afep-Medef Code handbook.

Compensation paid during or awarded in respect of financial year 2022 to Agena (of which Jacques Riou is Chairman)

Components of compensation
paid during or awarded
in respect of the financial
year ended
  Amounts awarded
in respect
of financial
year 2022
  Amounts paid
during financial
year 2022
  Presentation
Fixed compensation   €731,384   €722,320  

Following the publication of the Insee index for financial year 2022 at the end of March 2023, the Management Board’s total fixed compensation was set by the Supervisory board at €2,437,946 for the period, reflecting an increase of 1.94% compared to financial year 2021 (€2,391,465).

The difference between the amount awarded in respect of financial year 2022 and that paid during the same financial year is due to the adjustment of the fixed compensation in respect of financial year 2021 that was carried out following the publication at the end of March 2022 of the Insee reference index for financial year 2021, which resulted in a payment during financial year 2022. This lag, which is specifically caused by the publication of the Insee index for year Y in March of year Y+1, will occur every year.

Agena received 30% of this total fixed compensation.
For more information, please refer to the above section on Determination of fixed compensation in respect of financial year 2022.

Annual variable compensation   €0   €0  

Capped at 50% of the annual fixed compensation and fully subject to performance criteria.
The triggering condition was not met because the change in 2022 net income, Group share (€262,896k) compared to 2021 net income, Group share (€292,569k) < 105%. Therefore, no annual variable compensation is due in respect of financial year 2022.

For more information, please refer to the above table presenting the achievement level of the triggering condition and the performance criteria attached to the Management Board’s annual variable compensation in respect of financial year 2022.

Multi-year variable compensation   Not applicable   Not applicable   The policy does not provide for multi-year variable compensation.
Exceptional compensation   Not applicable   Not applicable   The policy does not provide for exceptional compensation.
Stock options, performance shares or any other long-term compensation   Not applicable   Not applicable   The policy does not provide for the allocation of stock options,performance shares or any other long-term compensation.
Benefits in kind   €0   €0   No benefits in kind were awarded.
Compensation or benefits paid or awarded by companies included in the scope of consolidation   €361,647   €361,647   Compensation or benefits paid or awarded in a personal capacity to Jacques Riou (Chairman of Agena), by companies included in the scope of consolidation for the offices he held in them in 2022 (Chairman of Rubis Énergie SAS and Managing Partner of Rubis Patrimoine SARL).
Compensation, allowances or benefits related to taking on a corporate office   Not applicable   Not applicable   The policy does not provide for compensation, allowances or benefits related to taking on a corporate office.
Severance payments   Not applicable   Not applicable   The policy does not provide for severance payments.
Consideration for a non-compete-undertaking   Not applicable   Not applicable   The policy does not include a non-compete agreement.
Supplementary pension schemes   Not applicable   Not applicable   The policy does not provide for a supplementary pension scheme.

Compensation paid during or awarded in respect of financial year 2022 to GR Partenaires

As in previous years, no compensation of any kind was paid during or awarded in respect of financial year 2022 to GR Partenaires for its role as Managing Partner of Rubis SCA. Accordingly, the Company has decided not to reproduce the entire table required by the Afep-Medef Code handbook, or to submit a resolution concerning the compensation paid during or awarded in respect of financial year 2022 to GR Partenaires to the 2023 Shareholders’ Meeting.

Compensation paid during or awarded in respect of financial year 2022 to the Supervisory Board

COMPENSATION PAID DURING OR AWARDED IN RESPECT OF FINANCIAL YEAR 2022 TO THE CHAIRMAN OF THE SUPERVISORY BOARD

At its meeting of 15 March 2023, the Compensation and Appointments Committee determined the components of compensation to be paid or awarded in respect of financial year 2022 to the Chairman of the Supervisory Board in accordance with the compensation policy approved by the Shareholders’ Meeting of 9 June 2022. The Committee reported to the Supervisory Board on its work on 16 March 2023. The Supervisory Board confirmed that the components relating to the Chairman of the Supervisory Board complied with the compensation policy approved by the Shareholders’ Meeting of 9 June 2022.

The compensation paid during or awarded in respect of financial year 2022 to Olivier Heckenroth, Chairman of the Supervisory Board, is presented in the table below. This compensation is related to his term of office as member of the Supervisory Board, his Chairmanship of the Supervisory Board and his participation in its Committees. No other compensation of any kind was paid during or awarded in respect of financial year 2022 to Olivier Heckenroth.

As a reminder, Olivier Heckenroth’s attendance rate at Supervisory Board and Committee meetings was 100% in 2022 (as in 2021 and 2020).

   Amounts awarded in respect
of financial year 2022
(in euros)
  Amounts paid during
financial year 2022
(in euros)
Olivier Heckenroth      
Chairman of the Supervisory Board      
  portion as Chairmanship of the Supervisory Board  18,000  18,000
  fixed portion (40%)  4,800  4,800
  variable portion based on attendance (60%)  7,200  7,200
Member of the Accounts and Risk Monitoring Committee      
  fixed portion (40%)  3,600  3,600
  variable portion based on attendance (60%)  5,400  5,400
Member of the Compensation and Appointments Committee      
  fixed portion (40%)  2,400  2,400
  variable portion based on attendance (60%)  3,600  3,600
TOTAL  45,000  45,000

COMPENSATION PAID DURING OR AWARDED IN RESPECT OF FINANCIAL YEAR 2022 TO THE SUPERVISORY BOARD MEMBERS

At its meeting of 16 March 2023, the Supervisory Board, upon the favourable opinion of the Compensation and Appointments Committee and in accordance with the remuneration policy approved by the 9 June 2022 Shareholders’ Meeting, awarded the amount to be paid to its members in respect of financial year 2022.

The compensation awarded to the members of the Supervisory Board in respect of financial year 2022 is shown in the table below. For each member, the compensation is linked to his/her corporate office and attendance as well as whether he/she chairs a Committee, and his/her Committee membership. No other compensation of any kind was paid during or awarded in respect of financial year 2022 to the members of the Supervisory Board.

TABLE 3 (AFEP-MEDEF CODE AND AMF NOMENCLATURE) – TABLE OF COMPENSATION PAID TO NON-EXECUTIVE CORPORATE OFFICERS

   Financial year 2022  Financial year 2021
   Amounts awarded
in respect of the
financial year
(in euros)
  Amounts paid
during the
financial year
(in euros)
  Amounts awarded
in respect of the
financial year

(in euros)
  Amounts paid
during the
financial year
(in euros)(1)
Olivier Heckenroth
Chairman of the Supervisory Board
               
  portion as Chairmanship of the Supervisory Board  18,000  18,000  18,000  0
  fixed portion (40%)  4,800  4,800  4,800  0
  variable portion based on attendance (60%)  7,200  7,200  7,200  0
Member of the Accounts and Risk Monitoring Committee            
  fixed portion (40%)  3,600  3,600  3,600  0
  variable portion based on attendance (60%)  5,400  5,400  5,400  0
Member of the Compensation and Appointments Committee            
  fixed portion (40%)  2,400  2,400  2,400  0
  variable portion based on attendance (60%)  3,600  3,600  3,600  0
Hervé Claquin(2)
Member of the Supervisory Board
               
  fixed portion (40%)  4,800  4,800  4,800  0
  variable portion based on attendance (60%)  7,200  7,200  7,200  0
Member of the Accounts and Risk Monitoring Committee            
  fixed portion (40%)  -  1,800  1,800  0
  variable portion based on attendance (60%)  -  2,700  2,700  0
Nils Christian Bergene(3)
Member of the Supervisory Board
               
  fixed portion (40%)  4,800  2,400  2,400  0
  variable portion based on attendance (60%)  7,200  3,600  3,600  0
Chairman of the Accounts and Risk Monitoring Committee            
  Chairman of the Accounts and Risk Monitoring Committee  3,000  0  -  -
  fixed portion (40%)  3,600  1,800  1,800  0
  variable portion based on attendance (60%)  5,400  2,700  2,700  0
Member of the Compensation and Appointments Committee            
  fixed portion (40%)  1,200  0  -  -
  variable portion based on attendance (60%)  1,800  0  -  -
Marie-Hélène Dessailly(4)
Member of the Supervisory Board
               
  fixed portion (40%)  2,400  4,800  4,800  0
  variable portion based on attendance (60%)  2,400  7,200  7,200  0
Member of the Accounts and Risk Monitoring Committee            
  fixed portion (40%)  1,800  3,600  3,600  0
  variable portion based on attendance (60%)  3,600  5,400  5,400  0
Carole Fiquemont(5)
Member of the Supervisory Board
               
  fixed portion (40%)  4,800  4,800  4,800  0
  variable portion based on attendance (60%)  7,200  7,200  7,200  0
Member of the Accounts and Risk Monitoring Committee            
  fixed portion (40%)  1,800  0  -  -
  variable portion based on attendance (60%)  1,800  0  -  -
Aurélie Goulart-Lechevalier(6)
Member of the Supervisory Board
               
  fixed portion (40%)  2,400  4,800  4,800  0
  variable portion based on attendance (60%)  2,400  7,200  7,200  0
Laure Grimonpret-Tahon(7)
Member of the Supervisory Board
               
  fixed portion (40%)  4,800  4,800  4,800  0
  variable portion based on attendance (60%)  7,200  7,200  7,200  0
Chairwoman of the Compensation and Appointments Committee            
  portion as Chairmanship of the Compensation and Appointments Committee  2,250  0  -  -
  fixed portion (40%)  2,400  2,400  2,400  0
  variable portion based on attendance (60%)  3,600  3,600  3,600  0
Marc-Olivier Laurent(8)
Member of the Supervisory Board
               
  fixed portion (40%)  4,800  4,800  4,800  0
  variable portion based on attendance (60%)  4,800  7,200  7,200  300
Member of the Accounts and Risk Monitoring Committee            
  fixed portion (40%)  1,800  3,600  3,600  0
  variable portion based on attendance (60%)  3,600  5,400  5,400  0
Cécile Maisonneuve(9)
Member of the Supervisory Board
               
  fixed portion (40%)  2,400  0  -  -
  variable portion based on attendance (60%)  4,800  0  -  -
Chantal Mazzacurati(10)
Member of the Supervisory Board
               
  fixed portion (40%)  4,800  4,800  4,800  0
  variable portion based on attendance (60%)  7,200  6,200  5,200  0
Chairwoman of the Accounts and Risk Monitoring Committee            
  Chairmanship of the Accounts and Risk Monitoring Committee    6,000    9,000    9,000    0
  fixed portion (40%)  3,600  3,600  3,600  0
  variable portion based on attendance (60%)  5,400  5,400  5,400  0
Chairwoman of the Compensation and Appointments Committee            
  Chairmanship of the Compensation and Appointments Committee  2,250  4,500  4,500  0
  fixed portion (40%)  1,200  2,400  2,400  0
  variable portion based on attendance (60%)  1,800  3,600  3,600  0
Erik Pointillart
Member of the Supervisory Board
               
  fixed portion (40%)  4,800  4,800  4,800  0
  variable portion based on attendance (60%)  7,200  7,200  7,200  0
Member of the Compensation and Appointments Committee            
  fixed portion (40%)  2,400  2,400  2,400  0
  variable portion based on attendance (60%)  3,600  3,600  3,600  0
Alberto Pedrosa(5)(9)
Member of the Supervisory Board
               
  fixed portion (40%)  2,400  0  -  -
  variable portion based on attendance (60%)  4,800  0  -  -
Member of the Accounts and Risk Monitoring Committee            
  fixed portion (40%)  1,800  0  -  -
  variable portion based on attendance (60%)  1,800  0  -  -
Carine Vinardi(9)
Member of the Supervisory Board
               
  fixed portion (40%)  2,400  0  -  -
  variable portion based on attendance (60%)  4,800  0  -  -
TOTAL AMOUNT  225,300  214,500  214,500  300
(1) No amount was paid in financial year 2021 (with the exception of a balancing payment made to Marc-Olivier Laurent in March 2021), as, from that financial year, the amounts awarded in respect of a financial year are paid in the following financial year.
(2) Member of the Accounts and Risk Monitoring Committee until the 10 June 2021 Shareholders’ Meeting, 50% of the compensation related to this appointment was paid in 2022 in respect of financial year 2021.
(3) Appointed as member of the Supervisory Board by the 10 June 2021 Shareholders’ Meeting, 50% of the compensation related to this appointment was paid in 2022 in respect of financial year 2021. Member of the Accounts and Risk Monitoring Committee from the 10 June 2021 Shareholders’ Meeting, 50% of the compensation related to this appointment was paid in 2022 in respect of financial year 2021. Chair of the Accounts and Risk Monitoring Committee from the 9 June 2022 Shareholders’ Meeting, 1/3 of the compensation related to this Chairmanship was awarded in respect of financial year 2022. Member of the Compensation and Appointments Committee from the 9 June 2022 Shareholders’ Meeting, 50% of the compensation related to this appointment was awarded to him in respect of financial year 2022.
(4) Member of the Supervisory Board until the 9 June 2022 Shareholders’ Meeting, 50% of the fixed compensation and 1/3 of the amount of the variable compensation related to this office were awarded in respect of financial year 2022. Member of the Accounts and Risk Monitoring Committee until the 9 June 2022 Shareholders’ Meeting, 50% of the amount of the fixed compensation and 2/3 of the amount of the variable compensation related to this office were awarded in respect of financial year 2022.
(5) Member of the Accounts and Risk Monitoring Committee from the 9 June 2022 Shareholders’ Meeting, 50% of the amount of the fixed compensation and 1/3 of the amount of the variable compensation related to this office were awarded in respect of financial year 2022.
(6) Member of the Supervisory Board until the 9 June 2022 Shareholders’ Meeting, 50% of the fixed compensation and 1/3 of the amount of the variable compensation related to this office were awarded in respect of financial year 2022.
(7) Chairwoman of the Compensation and Appointments Committee from the 9 June 2022 Shareholders’ Meeting, 50% of the amount of the compensation related to this Chairmanship was awarded in respect of financial year 2022.
(8) Absent from one of the meetings of the Supervisory Board held in 2022. Member of the Accounts and Risk Monitoring Committee until the 9 June 2022 Shareholders’ Meeting, 50% of the amount of the fixed compensation and 2/3 of the amount of the variable compensation related to this office were awarded in respect of financial year 2022.
(9) Appointed as member of the Supervisory Board by the 9 June 2022 Shareholders’ Meeting, 50% of the amount of the fixed compensation and 2/3 of the variable compensation related to this office were awarded in respect of financial year 2022.
(10) Chairwoman of the Accounts and Risk Monitoring Committee until the 9 June 2022 Shareholders’ Meeting, 2/3 of the amount of the compensation related to this Chairmanship was awarded in respect of financial year 2022. Member and Chairwoman of the Compensation and Appointments Committee until the 9 June 2022 Shareholders’ Meeting, 50% of the amount of the compensation related to this appointment and to this Chairmanship were awarded in respect of financial year 2022.


Tables relating to the compensation of executive corporate officers

(based on the recommendations of the Afep-Medef Code and AMF position-recommendation – doc-2021-02)

The Managing Partners of the Company are Gilles Gobin, Sorgema (of which Gilles Gobin is Manager), Agena (of which Jacques Riou is Chairman) and GR Partenaires. GR Partenaires does not receive any compensation or benefits of any kind in its capacity as Managing Partner. Consequently, no table will be presented concerning GR Partenaires.

COMPENSATION OF GILLES GOBIN

TABLE 1 (AFEP-MEDEF CODE AND AMF NOMENCLATURE) – SUMMARY TABLE OF COMPENSATION AND OPTIONS AND SHARES GRANTED TO EACH MANAGING PARTNER

Gilles Gobin, Managing Partner  Financial
year 2022

(in euros)
  Financial
year 2021

(in euros)
Compensation awarded in respect of the financial year (see table 2)  13,679  17,681
Valuation of options awarded during the financial year  NA  NA
Valuation of performance shares awarded during the financial year  NA  NA
Valuation of other long-term compensation plans  NA  NA
TOTAL  13,679  17,681

NA: not applicable.

TABLE 2 (AFEP-MEDEF CODE AND AMF NOMENCLATURE) – SUMMARY TABLE OF THE COMPENSATION OF EACH MANAGING PARTNER

   Financial year 2022  Financial year 2021
Gilles Gobin, Managing Partner  Amounts
awarded

(in euros)
  Amounts
paid

(in euros)
  Amounts
awarded

(in euros)
  Amounts
paid

(in euros)
Fixed compensation  0  0  0  0
Annual variable compensation  0  0  0  0
Exceptional compensation  NA  NA  NA  NA
Compensation awarded in respect of the office of Supervisory Board member  NA  NA  NA  NA
Benefits in kind (car)  13,679  13,679  17,681  17,681
TOTAL  13,679  13,679  17,681  17,681

NA: not applicable.

TABLES 4 TO 11 (AFEP-MEDEF CODE AND AMF NOMENCLATURE)

Gilles Gobin does not benefit from any stock option plans, performance or preferred share plans or multi-year variable compensation. In addition, Gilles Gobin does not benefit from an employment contract, supplementary pension scheme, severance payment or compensation for a non-compete agreement.

COMPENSATION OF SORGEMA

TABLE 1 (AFEP-MEDEF CODE AND AMF NOMENCLATURE) – SUMMARY TABLE OF COMPENSATION AND OPTIONS AND SHARES GRANTED TO EACH MANAGING PARTNER

Sorgema, Managing Partner  Financial
year 2022

(in euros)
  Financial
year 2021

(in euros)
Compensation awarded in respect of the financial year (see table 2)  1,706,562  1,674,025
Valuation of options awarded during the financial year  NA  NA
Valuation of performance shares awarded during the financial year  NA  NA
Valuation of other long-term compensation plans  NA  NA
TOTAL  1,706,562  1,674,025

NA: not applicable.

TABLE 2 (AFEP-MEDEF CODE AND AMF NOMENCLATURE) – SUMMARY TABLE OF THE COMPENSATION OF EACH MANAGING PARTNER

   Financial year 2022  Financial year 2021
Sorgema, Managing Partner  Amounts
awarded

(in euros)
  Amounts
paid

(in euros)
  Amounts
awarded

(in euros)
  Amounts
paid

(in euros)
Fixed compensation*  1,706,562  1,685,413  1,674,025  1,680,832
Annual variable compensation  0  0  0  0
Exceptional compensation  NA  NA  NA  NA
Compensation awarded in respect of the office of Supervisory Board member  NA  NA  NA  NA
Benefits in kind  NA  NA  NA  NA
TOTAL  1,706,562  1,685,413  1,674,025  1,680,832

NA: not applicable.

* The difference between the amounts of fixed compensation awarded in respect of year Y and those paid during year Y is explained by the fact that the fixed compensation awarded in respect of Y is definitively known in March of Y+1 (i.e., on the date Insee publishes its indexes for the fourth quarter of year Y), which consequently and automatically results in an adjustment in Y+1.

TABLES 4 TO 11 (AFEP-MEDEF CODE AND AMF NOMENCLATURE)

Tables 4 to 11 do not apply to a Managing Partner that is a legal entity.

COMPENSATION OF AGENA

TABLE 1 (AFEP-MEDEF CODE AND AMF NOMENCLATURE) – SUMMARY TABLE OF COMPENSATION AND OPTIONS AND SHARES GRANTED TO EACH MANAGING PARTNER

Agena, Managing Partner  Financial
year 2022

(in euros)
  Financial
year 2021

(in euros)
Compensation awarded in respect of the financial year (see table 2)  731,384  717,439
Valuation of options awarded during the financial year  NA  NA
Valuation of performance shares awarded during the financial year  NA  NA
Valuation of other long-term compensation plans  NA  NA
TOTAL  731,384  717,439

NA: not applicable.

TABLE 2 (AFEP-MEDEF CODE AND AMF NOMENCLATURE) – SUMMARY TABLE OF THE COMPENSATION OF EACH MANAGING PARTNER

   Financial year 2022  Financial year 2021
Agena, Managing Partner  Amounts
awarded

(in euros)
  Amounts
paid

(in euros)
  Amounts
awarded

(in euros)
  Amounts
paid

(in euros)
Fixed compensation*  731,384  722,320  717,439  720,357
Annual variable compensation  0  0  0  0
Exceptional compensation  NA  NA  NA  NA
Compensation awarded in respect of the office of Supervisory Board member  NA  NA  NA  NA
Benefits in kind  NA  NA  NA  NA
TOTAL  731,384  722,320  717,439  720,357

NA: not applicable.

* The difference between the amounts of fixed compensation awarded in respect of year Y and those paid during year Y is explained by the fact that the fixed compensation awarded in respect of Y is definitively known in March of Y+1 (i.e., on the date Insee publishes its indexes for the fourth quarter of year Y), which consequently and automatically results in an adjustment in Y+1.

TABLES 4 TO 11 (AFEP-MEDEF CODE AND AMF NOMENCLATURE)

Tables 4 to 11 do not apply to a Managing Partner that is a legal entity.

COMPENSATION OF JACQUES RIOU IN RESPECT OF HIS OFFICES IN GROUP SUBSIDIARIES

TABLE 1 (AFEP-MEDEF CODE AND AMF NOMENCLATURE) – SUMMARY TABLE OF COMPENSATION AND OPTIONS AND SHARES GRANTED TO EACH MANAGING PARTNER

Jacques Riou (in respect of his offices in Group subsidiaries*)  Financial
year 2022

(in euros)
  Financial
year 2021

(in euros)
Compensation awarded in respect of the financial year (see table 2)  361,647  320,122
Valuation of options awarded during the financial year  NA  NA
Valuation of performance shares awarded during the financial year  NA  NA
Valuation of other long-term compensation plans  NA  NA
TOTAL  361,647  320,122
* Chairman of Rubis Énergie SAS and Manager of Rubis Patrimoine SARL.

NA: not applicable.

TABLE 2 (AFEP-MEDEF CODE AND AMF NOMENCLATURE) – SUMMARY TABLE OF THE COMPENSATION OF EACH MANAGING PARTNER

   Financial year 2022  Financial year 2021
Jacques Riou (in respect of his offices in Group subsidiaries(1))  Amounts
awarded

(in euros)
  Amounts
paid

(in euros)
  Amounts
awarded

(in euros)
  Amounts
paid

(in euros)
Fixed compensation  330,051  330,051  314,855  314,855
Annual variable compensation  NA  NA  NA  NA
Exceptional compensation  NA  NA  NA  NA
Compensation awarded in respect of the office of Supervisory Board member  NA  NA  NA  NA
Benefits in kind (car)  31,596(2)  31,596(2)  5,267  5,267
TOTAL  361,647  361,647  320,122  320,122
(1) Chairman of Rubis Énergie SAS and Manager of Rubis Patrimoine SARL.
(2) New vehicle leased in 2022.

TABLES 4 TO 11 (AFEP-MEDEF CODE AND AMF NOMENCLATURE)

Jacques Riou (Chairman of Agena) does not benefit from any stock option plans, performance or preferred share plans or multi-year variable compensation in respect of his offices in the Group’s subsidiaries. In addition, Jacques Riou does not benefit from an employment contract, supplementary pension scheme, severance payment or compensation for a non-compete agreement.

5.5 Additional information

Absence of conflicts of interest, impediments or convictions

There are no family ties between the Managing Partners and the members of the Supervisory Board.

No Managing Partner or member of the Supervisory Board has any conflict of interest between his/her duties to Rubis and his/her private interests and/or other duties to which he/she is bound.

To Rubis’ knowledge, there is no arrangement or agreement between the Company and the main shareholders, clients, suppliers or others pursuant to which the members of the Supervisory Board or the Managing Partners have been selected.

No Managing Partner or member of the Supervisory Board has ever been convicted of fraud, filed for bankruptcy or been placed in receivership or liquidation.

No Managing Partner or member of the Supervisory Board has ever been the subject of a criminal prosecution or official public sanction pronounced by statutory or regulatory authorities.

No Managing Partner or member of the Supervisory Board has ever been prevented by a court from acting as member of an issuer’s administrative, management or supervisory body, or from being involved in the management or direction of an issuer’s affairs in the last five years at least.

Absence of any agreements binding a member of the Supervisory Board or a Managing Partner to Rubis or to one of its subsidiaries

There are no service contracts binding the Managing Partners or the members of the Supervisory Board to Rubis or any one of Rubis’ subsidiaries.

No loans or guarantees have been granted or made on behalf of the Managing Partners or the members of the Supervisory Board.

Transactions with related parties

The Group’s related parties include affiliates (joint undertakings and joint ventures, see notes 8 and 9 to the consolidated financial statements) and the principal Senior Managers (dirigeants) and close members of their family.

Agreements entered into by Rubis SCA with subsidiaries that it does not, directly or indirectly, wholly own (such as Rubis Terminal, RT Invest, Rubis Terminal Infra and Rubis Photosol), may be classified as related-party agreements and be the subject of the Statutory Auditors’ special report on related-party agreements mentioned below.

Transactions between the parent company and its fully consolidated subsidiaries are eliminated in the consolidated financial statements.

There are no other agreements with related parties.

Related-party agreements

Related-party agreements are described in the Statutory Auditors’ special report on related-party agreements in chapter 7, section 7.4.3. They are also explained in the presentation of the draft resolutions in the Notice of meeting for the Shareholders’ Meeting of 8 June 2023.

Procedure for assessing agreements relating to ordinary course transactions entered into on arm’s length terms

In accordance with Article L. 22-10-12 of the French Commercial Code, an internal charter on the regular assessment of regulated and non-regulated agreements was adopted by the Supervisory Board at its meeting of 12 March 2020.

On 10 March 2022, the Supervisory Board amended this charter for the purpose of specifying that the assessment of any agreement relating to an ordinary transaction entered into under arm’s length terms would be carried out by the Company’s internal departments, with the assistance of the Statutory Auditors, if need be.

The Supervisory Board meeting of 16 March 2023 was informed by the Corporate Secretary of the Company that no difficulties were encountered in the implementation of this procedure during the financial year 2022. The Supervisory Board therefore considered that no improvements needed to be made.

Restrictions on the disposal by members of the Supervisory Board and Managing Partners of their interests in Rubis’ share capital

To Rubis’ knowledge, no restrictions have been agreed by the Managing Partners or by the members of the Supervisory Board with respect to the sale of their shares in the Company, with the exception of rules governing trading in Rubis securities provided for by applicable legal provisions (see the section entitled “Blackout periods” below).

Blackout periods

Internal prudential rules provide for blackout periods during which time transactions in Rubis securities are prohibited for the Managing Partners and members of the Supervisory Board as well as for certain employees and external suppliers. These blackout periods start 30 days prior to the date scheduled for the publication of the annual and half-year results and 15 days prior to the date scheduled for the publication of quarterly revenue, and end the day after publication of such results. Furthermore, and in any event, trading in Rubis securities is prohibited if inside information is held (and until the day after its publication).

Securities transactions carried out by executive corporate officers

To the Company’s knowledge, the Managing Partners and members of the Supervisory Board of Rubis did not carry out any transactions involving the Company’s securities in financial year 2022.

Summary table of current delegations of authority to increase the share capital currently in force and use made of such delegations

This table, which is an integral part of the Supervisory Board’s report on corporate governance, appears in chapter 6, section 6.2.4 of this Universal Registration Document.

Participation of shareholders at Shareholders’ Meetings

The procedures for shareholder participation and voting at Shareholders’ Meetings, which form an integral part of the Supervisory Board’s report on corporate governance, are set out in chapter 6, section 6.1.4 of this Universal Registration Document. They are described in Articles 34 to 40 of the Company’s by-laws (which are available on the Company’s website).

Elements liable to have an impact in the event of a public offer

None of the elements described in Article L. 22-10-11 of the French Commercial Code is liable to have an impact in the event of a public tender offer or exchange offer.

Statutory Auditors’ specific verifications on the report on corporate governance

In accordance with the standard NEP 9510 published on 7 October 2018, the Statutory Auditors’ specific verifications implemented pursuant to Article L. 22-10-71 of the French Commercial Code on the Supervisory Board’s report on corporate governance are described in the Statutory Auditors’ report on the annual financial statements in chapter 7, section 7.4.2 of this Universal Registration Document.

6. INFORMATION about the COMPANY and its CAPITAL


6.1 Information about the Company

Rubis is a French Partnership Limited by Shares (Société en Commandite par Actions) governed by Articles L. 226-1 to L. 226-14 and L. 22-10-74 to L. 22-10-78 of the French Commercial Code and, insofar as they are compatible with the above-mentioned articles, by the provisions relating to Limited Partnerships (société en commandite simple) and public limited companies (sociétés anonymes). Within this legal framework, the Company is also governed by its by-laws.

This corporate form includes two categories of partners:

•   General Partners, who have the status of merchants and are indefinitely and jointly and severally liable for corporate debts;

•   Limited Partners (or shareholders), who are non-merchants and whose liability is limited to the amount of their contributions.

The law and Rubis’ by-laws make the Partnership Limited by Shares a modern structure that is adapted to the principles of good corporate governance, as reflected by:

•   the very clear separation of powers between the Management Board, which governs corporate affairs, and the Supervisory Board, whose members are appointed by the shareholders and which is tasked with overseeing the Company’s management, and notably giving its opinion on the compensation policy applicable to the Management Board and determining the components of the compensation to be awarded and paid ex-post to corporate officers;

•   the unlimited personal liability of the General Partner, which attests to the appropriate match between commitment of assets, power and responsibility;

•   the awarding to the Supervisory Board of the same powers and rights to communication and of investigation as those granted to the Statutory Auditors;

•   the right of shareholders to oppose the appointment of a candidate for the Management Board when he/she is not a General Partner.

6.1.1 General Partners

Rubis’ General Partners are:

•   Gilles Gobin;

•   Sorgema, a limited liability company (société à responsabilité limitée) whose Manager is Gilles Gobin and whose shareholders are members of the Gobin family group;

•   GR Partenaires, a Limited Partnership whose General Partners are the Gobin family group companies and Jacques Riou. The Limited Partners of GR Partenaires are Agena and members of the Riou family group.

6.1.2 Limited Partners (or shareholders)

The main Limited Partners (or shareholders) are listed in the table in section 6.2.2 of this chapter.

6.1.3 Organisation chart

6.1.4 Main by-laws’ provisions

The complete by-laws are available on the Company’s website https://rubis.fr/en/corporate-governance/rubis-by-laws.

Corporate purpose

(Article 2 of the by-laws)

The purpose of the Company, both in France and abroad, is:

Acquiring interests in any civil or commercial companies, by creating new companies, contributing, subscribing for or purchasing securities, corporate rights or convertible or non-convertible bonds, mergers, joint arrangements or otherwise.

This may be done directly or indirectly, by creating new companies and business combinations, contributing Limited Partnerships, subscribing for or purchasing securities or corporate rights, mergers, joint arrangements, combinations, joint venture companies, or by obtaining any property or other rights under a lease or management of a lease.

And, in general, any industrial, commercial, financial or civil operation or transaction in movable or immovable property that might be associated directly or indirectly with one of the purposes listed above or any similar or related purpose.

Date of incorporation, duration and financial year

(Articles 5 and 53 of the by-laws)

The Company was formed on 21 July 1900. Its current form results from the merger on 30 June 1992 of Rubis Investment & Cie and Compagnie de Penhoët. The Company’s term runs until 30 May 2089, except in the event of early dissolution or further extension.

Each financial year lasts 12 months, beginning on 1 January and ending on 31st December.

Share capital – rights and obligations attached to the shares

(Articles 8, 14 and 14 bis of the by-laws)

SHARE CAPITAL

As of 31 December 2022, the share capital amounts to one hundred and twenty-eight million, six hundred and ninety-one thousand, nine hundred and fifty-seven euros and fifty eurocents (€128,691,957.50).

It is divided into 102,953,566 fully paid-up ordinary shares with a par value of €1.25 each.

The share capital may be increased or reduced, in accordance with the legal provisions and those of these by-laws.

Under legal and regulatory conditions, preferred shares issued under Articles L. 228-11 et seq. of the French Commercial Code may be created, with special rights as defined in these by-laws in Articles 14 bis, 33, 48 and 57.

Several preferred share classes may be created, with various characteristics, including (i) their issue date and (ii) their conversion period. Consequently, the corporate body deciding the preferred share issue shall amend this Article accordingly, so as to specify the designation and characteristics of such issued class, including those referred to in (i) and (ii) above.

The 2,884 Class A preferred shares of the 2 September 2015 plan were cancelled following their conversion into 288,400 ordinary shares.

The 3,814 Class B preferred shares of the 11 July 2016 plan were cancelled following their conversion into 381,400 ordinary shares.

The 1,932 class C preferred shares of the 13 March 2017 plan were cancelled following their buyback by the Company due to a conversion coefficient of zero.

The 374 class D preferred shares of the 19 July 2017 plan were cancelled following their buyback by the Company due to a conversion coefficient of zero.

The 345 class E preferred shares of the 2 March 2018 plan were cancelled following their buyback by the Company due to a conversion coefficient of zero.

The 1,157 class F preferred shares of the 5 March 2018 plan were cancelled following their buyback by the Company due to a conversion coefficient of zero.

The 140 class G preferred shares of the 19 October 2018 plan were cancelled following their buyback by the Company due to a conversion coefficient of zero.

RIGHTS AND OBLIGATIONS ATTACHED TO THE SHARES

Each share of the same class shall give right to a proportional share capital of the Company’s assets, liquidation surpluses and profits equal to the fraction of the capital to which the share corresponds. All shares of the same class and face value can be considered equal to each other, with the sole exception of the start date for dividend entitlement.

A Limited Partner shall only be responsible for corporate debts up to an amount equal to the face value of the shares in his/her possession.

The possession of a share automatically implies acceptance of the present by-laws and the resolutions legally decided by the Shareholders’ Meeting.

Management Board

(Articles 7 and 20 to 22 of the by-laws)

The Company is managed and administered by one or more Managing Partners (either individuals or corporations), who may or may not be General Partners.

If a corporation holds the position of Managing Partner, its executives shall be subject to the same conditions, obligations and civil and criminal liability as those of an individual sitting in his/her own name, without prejudice to the joint liability of the corporation they manage.

APPOINTMENT

Throughout the Company’s existence, the General Partners shall be responsible for the appointment of any new Managing Partner by unanimous vote. However, if the candidate for the position of Managing Partner is not a General Partner, his/her appointment must be ratified by the Shareholders’ Meeting (in its ordinary form) of Limited Partners.

POWERS

Each Managing Partner shall be invested with the broadest of powers to act in all circumstances on behalf of the Company. He/she shall exercise said powers within the limitations of the corporate purpose and subject to the limitations expressly set out by law or attributed by the by-laws to the Shareholders’ Meeting and to the Supervisory Board.

Should there be more than one Managing Partner, the unanimous approval of the Management Board shall be required for any decision that involves expenses exceeding €152,449.

STATUTORY MANAGER

Gilles Gobin has been appointed Statutory Managing Partner.

Supervisory Board

(Articles 27 to 29 of the by-laws)

COMPOSITION

The Company has a Supervisory Board composed of members selected from the shareholders who are neither General Partners nor Managing Partner.

Board members shall be appointed and their mandates revoked by the Ordinary Shareholders’ Meeting. Shareholders who are General Partners cannot participate in the vote on the resolutions concerned.

Board members shall have a maximum term of office of three years. It shall end at the end of the meeting called to approve the financial statements for the past financial year and held in the year in which their term of office expires. Members are re-eligible for office.

DELIBERATIONS

The Supervisory Board meets when convened by its Chairman or the Management Board as often as the interests of the Company so require and at least once every six months.

POWERS

The Supervisory Board shall be responsible for the permanent control of the Management of the Company as provided by law. Each year, it shall submit a report to the Ordinary Shareholders’ Meeting, which is made available to shareholders at the same time as the Management Board report and the financial statements for the financial year. Its Chairman also prepares a report on the functioning of the Management and control bodies, as well as on the internal control procedures implemented within the Group.

General Partners

(Articles 19 and 24 of the by-laws)

APPROVAL OF NEW GENERAL PARTNERS

The corporate rights attached to the status of General Partner may only be transferred with the unanimous agreement of all the other General Partners. If the transferee is not already a General Partner, the approval of the Extraordinary Shareholders’ Meeting ruling in accordance with the majority required for extraordinary decisions must be obtained.

POWERS AND DECISIONS

General Partners may exercise all of the powers pertaining to their position as provided by law and the by-laws. The General Partners’ decisions may be taken either at Shareholders’ Meetings or by written consultation.

All General Partners’ decisions (Article 24.4) shall be taken unanimously, except for those concerning the revocation of a Managing Partner without the status of General Partner, which is decided by majority vote (Article 20.2).

Shareholders’ Meetings of Limited Partners

(Articles 34 to 38 and 40 of the by-laws)

CONVOCATION METHODS

Shareholders’ Meetings (or of Limited Partners) are convened by the Management Board or the Supervisory Board, or by any other person who is so entitled by law, in accordance with the statutory procedures and time frames.

The Management Board sends or makes available to shareholders, in accordance with the legislative provisions, documents allowing shareholders to make informed decisions.

CONDITIONS OF ADMISSION

The right to participate in Shareholders’ Meetings shall be subject to the registration of the securities in the shareholder’s name on the second business day that precedes the meeting at 00:00 hours, Paris time, either in the registered securities account held by the Company or in the bearer security accounts held by the intermediary authorised to manage the account. The registration or entry of the securities in the bearer securities accounts held by authorised intermediary shall be certified and a shareholder certificate shall be issued by the intermediary.

Any transfer that takes place after the aforementioned registration date shall have no influence on the functioning of the Shareholders’ Meeting: the transferor may vote in respect of the entire amount of his/her previous interest.

VOTING CONDITIONS

Each shareholder has as many votes as the number of voting shares he/she possesses or represents. Each ordinary share entitles its holder to one vote, it being specified that the ratio of one vote per share shall prevail over any non-mandatory statutory or regulatory provisions to the contrary.

Preferred shares do not confer voting rights at Shareholders’ Meetings of Limited Partners (Article 14 bis of the by-laws).

If a shareholder cannot attend the Shareholders’ Meeting in person, the shareholder may issue a proxy to another shareholder or to his/her spouse, or to any other individual or corporation of his/her choice. He/she may also issue a proxy without naming a representative, which means that the Chairman of the Shareholders’ Meeting will vote in favour of those draft resolutions presented or approved by the Management Board and against all other draft resolutions. Shareholders may also vote by post.

PLACE FOR CONSULTING LEGAL DOCUMENTS

Documents pertaining to the Company, and in particular the by-laws, the minutes of Shareholders’ Meetings, the reports presented at Shareholders’ Meetings by the Management Board, the Supervisory Board or the Statutory Auditors, may be consulted at the Company’s registered office and on the Company’s website (www.rubis.fr).

Statutory allocation of profits

(Articles 55 to 57 of the by-laws)

PARTICIPATION IN RESULTS

A 5% levy is deducted from net profits, less any previous losses where applicable, in order to form the legal reserve. This levy is no longer mandatory once such reserve is equivalent to one-tenth of the share capital. The legal reserve, which is formed to consolidate the share capital paid in by Limited Partners, shall remain the property of the Limited Partners. Under no circumstances may it be distributed to General Partners, even through a capital increase. This reserve, which is calculated on all of the profits made by the Company, will be the sole responsibility of Limited Partners.

The balance of such profits, less any previous losses and increased by retained earnings, make up the distributable profits.

DIVIDEND PER BY-LAWS TO GENERAL PARTNERS

The General Partners shall receive a dividend for a financial year (the “Relevant Financial Year”) equal to 3% of the Total Shareholder Return (the “TSR”), if positive, of Rubis’ shares, determined as indicated below. This dividend may in no case exceed 10% of net income, Group share for the Relevant Financial Year, nor the distributable profit as defined in Article 55.

The TSR is the change in market capitalisation, plus dividends paid and rights detached from shares.

The change in market capitalisation is equal to the difference between (i) the average of the opening prices of the last 20 trading days of the Relevant Financial Year and (ii) the highest among the averages of the opening prices of the last 20 trading days of the three financial years preceding the Relevant Financial Year (the “Reference Price”), multiplied by the number of outstanding shares at the end of the Relevant Financial Year less the number of shares held by the Company for cancellation at the end of the Relevant Financial Year. New shares created as a result of any capital increase since the end of the financial year of the Reference Price will not be taken into account, with the exception of shares awarded free of charge as part of a capital increase through capitalisation of reserves, profits or issue premiums and as part of a stock split or reverse stock split.

To the positive or negative amount corresponding to the change in market capitalisation are added the amount(s) of any cumulative dividends and interim dividends paid by Rubis to its Limited Partners between the financial year during which the Reference Price was determined and the end of the Relevant Financial Year, as well as the sums corresponding to the value of any rights detached from shares and to the value of any securities, other than Company shares, awarded free of charge to shareholders during this same period.

When they are listed, the value of the rights detached from the shares and the value of any free share allocations to shareholders correspond to the average opening price on the first days of listing, within the limit of 10 days.

The amount of the statutory dividend is recorded by the Ordinary Shareholders’ Meeting and that of the General Partners. Half of this dividend is blocked by the General Partners in the form of Rubis shares for three years.

DIVIDEND TO LIMITED PARTNERS (OR SHAREHOLDERS)

The portion distributed to the Limited Partners requires the approval of the Ordinary Shareholders’ Meeting of Limited Partners and that of the General Partners.

The option of receiving payment of the dividend or interim dividend in cash or in shares may be granted to each General Partner and Limited Partner holding ordinary shares, for all or part of the dividend or interim dividend paid.

Under no circumstances may this option be granted to General Partners without it being open to Limited Partners holding ordinary shares under the same conditions.

Shareholders holding preferred shares shall not be entitled to opt for the dividend to be paid in shares.

APPROPRIATION OF THE NON-DISTRIBUTED PORTION

The Shareholders’ Meeting appropriates the undistributed portion of the distributable profit for the financial year in the proportions that it determines, either to one or more reserve, general or special funds that remain available to it or to the “Retained earnings” account.

Statutory thresholds

(Article 14.7 of the by-laws)

In addition to the legal threshold crossing declaration provided for by Article L. 233-7 of the French Commercial Code, a shareholder must inform the Management Board, within four trading days following the date on which the threshold was crossed, of any change subsequent to the first legal threshold (5%), of more than 1% of the share capital or voting rights.

In the event that the above-mentioned reporting obligations are not complied with, the shares exceeding the fraction that should have been reported are deprived of voting rights at any Shareholders’ Meeting to be held until the expiry of a period of two years following the date when the notification was properly served. Except in the case that one of the thresholds defined in I of Article L. 233-7 of the French Commercial Code is crossed, the suspension of voting rights will only take place at the request of one or more shareholders holding at least 5% of the Company’s share capital or voting rights, as recorded in the minutes of the Shareholders’ Meeting.

6.1.5 Additional information concerning the General Partners

Absence of conflicts of interest, impediments or convictions

•   There are no family ties between the General Partners and the members of the Supervisory Board.

•   No General Partner has any conflict of interest between his/her duties to Rubis and his/her private interests and/ or other duties to which he/she is bound.

•   No General Partner has been convicted of fraud, filed for bankruptcy or been placed in receivership or liquidation.

•   No General Partner has been the subject of criminal prosecution or official public sanction by the statutory or regulatory authorities.

•   No General Partner has been prevented by a court from acting as member of an issuer’s administrative, management or supervisory body or from being involved in the management or direction of an issuer’s affairs in the last five years at least.

Absence of agreements binding a General Partner to Rubis or one of its subsidiaries

•   There are no service contracts binding the General Partners to Rubis or to any of Rubis’ subsidiaries.

•   No loans or guarantees have been granted or made on behalf of the General Partners.

Restrictions on the disposal by the General Partners of their equity interests in Rubis’ share capital

To Rubis’ knowledge, no restrictions have been agreed by the General Partners with respect to the disposal of their equity interests in the Company’s share capital, with the exception of the commitment made by the General Partners to invest half of the dividend received in Rubis shares for a period of three years.

6.2 Information on share capital and share ownership

6.2.1 Share capital as of 31 December 2022

The share capital as of 31 December 2022 amounted to €128,691,957.50, divided into 102,953,566 ordinary shares with a par value of €1.25 each, following the transactions carried out during the financial year 2022 as set out in the table in section 6.2.3.

As of this same date, the number of exercisable voting rights was 102,868,579. As double voting rights are excluded by Article 40 of the by-laws, each ordinary share carries one voting right.

6.2.2 Breakdown of the capital over the last three financial years

  31/12/2022 31/12/2021 31/12/2020
  Number of
shares(1)
% of
capital
Number
of voting
rights(1)
% of
voting
rights
Number of
shares(1)
% of
capital
Number
of voting
rights(1)
% of
voting
rights
Number of
shares(1)
% of
capital
Number
of voting
rights(1)
% of
voting
rights
Major shareholders
Groupe Industriel Marcel Dassault(2) 5,892,616 5.72% 5,892,616 5.73% 5,892,616 5.75% 5,892,616 5.75% 5,645,381 5.45% 5,645,381 5.45%
Wellington Management Group LLP -(7) -(7) -(7) -(7) 5,124,040 5.00% 5,124,040 5.00% 5,264,686 5.08% 5,264,686 5.08%
BlackRock Inc. 6,034,330 5.86% 6,034,330 5.87% 5,199,851 5.07% 5,199,851 5.07% -(8) -(8) -(8) -(8)
Tweedy, Browne Company LLC -(7) -(7) -(7) -(7) 5,128,195 5.,00% 5,128,195 5.01% -(8) -(8) -(8) -(8)
Management and Supervisory bodies
General Partners and Managing Partners 2,352,337 2.28% 2,352,337 2.29% 2,352,337 2.29% 2,352,337 2.30% 2,293,997 2.21% 2,293,997 2.22%
Supervisory Board 142,868 0.14% 142,868 0.14% 142,534 0.14% 142,534 0.14% 136,460 0.13% 136,460 0.13%
FCP Rubis Avenir(3) 1,707,364 1.66% 1,707,364 1.66% 1,570,927 1.53% 1,570,927 1.53% 1,369,245 1.32% 1,369,245 1.32%
Treasury shares(4) 84,987 0.08% 0 0% 73,122 0.07% 0 0% 58,087 0.06%   0 0%
Free float 86,739,064 84.25% 86,739,064 84.32% 77,051,468 75.14% 77,051,468 75.20% 88,857,633 85.74% 88,857,633 85.80%
Total ordinary shares(5) 102,953,566 100% 102,868,579 100% 102,535,090 99.994% 102,461,968 100% 103,625,489 99.995% 103,567,402 100%
Total preferred shares(6) 0 0% 0 0% 6,191 0.006% 0 0% 5,188 0.005% 0 0%
TOTAL 102,953,566 100% 102,868,579 100% 102,541,281 100% 102,461,968 100% 103,630,677 100% 103,567,402 100%
(1) To the Company’s knowledge, based on threshold crossing declarations received.
(2) Groupe Industriel Marcel Dassault is an investment holding company that is wholly owned by the Dassault family.
(3) Shares held by Group employees and former employees through the FCP Rubis Avenir mutual fund.
(4) In accordance with the provisions of the French Commercial Code, treasury shares do not carry voting rights.
(5) The slight difference in the sum of the percentages is due to rounding.
(6) Preferred shares do not carry voting rights.
(7) Shareholder holding less than 5% of the share capital and voting rights as of 31 December 2022.
(8) Shareholder holding less than 5% of the share capital and voting rights as of 31 December 2020.

To the Company’s knowledge, based on threshold crossing declarations received, no other shareholder held at least 5% of the share capital or voting rights as of 31 December 2022.

Crossings of thresholds reported during financial year 2022

During financial year 2022:

•   BlackRock Inc., acting on behalf of funds and clients, reported that it had crossed the threshold of 5% of the share capital or voting rights:

•   downwards on 26 January 2022, and as of that date held 5,070,276 Rubis shares, i.e., 4.94% of the share capital and voting rights,

•   upwards on 28 January 2022, and as of that date held 5,138,484 Rubis shares, i.e., 5.01% of the share capital and voting rights,

•   downwards on 31 January 2022, and as of that date held 5,028,496 Rubis shares, i.e., 4.90% of the share capital and voting rights,

•   upwards on 10 February 2022, and as of that date held 6,600,313 Rubis shares, i.e., 6.42% of the share capital and voting rights;

•   Tweedy, Browne Company LCC, acting on behalf of funds and clients, reported that it had crossed the threshold of 5% of the share capital or voting rights:

•   downwards on 8 September 2022, and as of that date held 5,131,180 Rubis shares, i.e., 4.98% of the share capital and voting rights.

Crossings of thresholds reported since the end of financial year 2022

None.

6.2.3 Change in share capital during financial year 2022

    Number of
ordinary shares
  Number of
preferred shares
  Share capital and
successive capital increase
or decrease at par value

(in euros)
SHARE CAPITAL AS OF 31 DECEMBER 2021  102,535,090  6,191  128,176,601.25
Transactions between 1st January and 31 December 2022         
Capital increase reserved for employees through the intermediary of the Rubis Avenir mutual fund  171,576  -  214,470
Issuance of preferred shares  -  226  282.50
Conversion of preferred shares into ordinary shares  246,900  (2,469)  305,538.75
Cancellation of preferred shares not converted into ordinary shares bought back by the Company  -  (3,948)  (4,935)
SHARE CAPITAL AS OF 31 DECEMBER 2022  102,953,566  0  128,691,957.50

6.2.4 Share capital authorised by Shareholders’ Meetings as of 31 December 2022

In 2022, the Management Board held the following delegations of powers and financial authorisations granted by the Combined Shareholders’ Meetings of the Limited Partners and of the General Partners of 9 December 2020, 10 June 2021 and 9 June 2022.

COMBINED SHAREHOLDERS’ MEETINGS OF THE LIMITED PARTNERS AND OF THE GENERAL PARTNERS OF 9 DECEMBER 2020

Resolution Maximum
authorised amount
Use Balance available
as of 31/12/2022
Expiration of
the authorisation
Authorisation to reduce the share capital by cancellation of shares repurchased (2nd resolution) 10% of the capital per 24-month period 4,134,083 shares cancelled None (authorisation expired on 9 December 2022) 9 December 2022

COMBINED SHAREHOLDERS’ MEETINGS OF THE LIMITED PARTNERS AND OF THE GENERAL PARTNERS OF 10 JUNE 2021

Resolution Maximum
authorised amount
Use Balance available
as of 31/12/2022
Expiration of
the authorisation
Capital increase by incorporation of profits, reserves or premiums(1) (24th resolution) €10,000,000 None Full amount 10 August 2023
Capital increase by way of public offering with preferential subscription rights(1) (25th resolution) €38,000,000 None Full amount 10 August 2023
Capital increase by way of public offering with preferential subscription rights in the event subscriptions exceed the number of securities offered in the framework of the 25th resolution (greenshoe provision)(1) (26th resolution) 15% of the initial issue resulting from (and counting towards) the 25th resolution None Full amount 10 August 2023
Capital increase in consideration for contributions in kind of equity securities or securities giving access to the share capital(1) (27th resolution) €10,000,000 None Full amount 10 August 2023
Capital increase in the event of a public exchange offer(1) (28th resolution) €6,000,000 None Full amount 10 August 2023
Capital increase for the benefit of a category of persons in accordance with the provisions of Article L. 225-138 of the French Commercial Code (equity line)(1) (29th resolution) €5,500,000 €5,500,000(2) (9 November 2021) None 10 December 2022
Overall cap for issues of shares and/or securities giving access to the share capital pursuant to the financial delegations provided for in the 24th to 29th resolutions and sublimit for capital increases with preferential subscription rights cancelled provided for in the 27th to 29th resolutions (30th resolution) 40% of the share capital as of the date of the 10 June 2021 Shareholders’ Meeting(3), of which 10% of the share capital as of the date of the 10 June 2021 Shareholders’ Meeting(3) in respect of the 27th to 29th resolutions None Full amount 10 August 2023
Performance share grants (31st resolution) 0.30% of the number of shares making up the share capital as of the date the performance shares are awarded(4) 160,072 performance shares
(13 December 2021 plan)
None (authorisation expired on 9 June 2022) 10 August 2023(5)
Capital increase reserved for the members of a company savings plan (32nd resolution) €700,000

•  €214,470 (13 January 2022)

•  2023 operation in progress as of the date this document was filed


€485,530 10 August 2023
(1) May only be used outside the period of a public offer.
(2) Out of the 4,400,000 equity warrants that were fully subscribed for by Crédit Agricole CIB on 9 November 2021 (term of 37 months), no equity warrant had been exercised by the Company as of 31 December 2022.
(3) To be adjusted by the amount of any capital reduction implemented after the 10 June 2021 Shareholders’ Meeting and resulting from the cancellation on 19 October 2021 of shares bought back as part of the share buyback programme authorised for an 18-month period until 9 June 2022 by the 9 December 2020 Shareholders’ Meeting.
(4) 0.30% of the number of shares making up the share capital on the date the performance shares were awarded, corresponding to 307,434 performance shares as of 13 December 2021.
(5) Early expiration of the term on 9 June 2022 pursuant to the approval of a resolution of the same kind at the Combined Shareholders’ Meeting of 9 June 2022.

COMBINED SHAREHOLDERS’ MEETINGS OF THE LIMITED PARTNERS AND OF THE GENERAL PARTNERS OF 9 JUNE 2022

Resolution Maximum
authorised amount
 Use Balance available
as of 31/12/2022
Expiration of
the authorisation
Authorisation to be granted to the Management Board for the purpose of carrying out a share buyback programme as part of a liquidity agreement (20th resolution) €30,000,000 Resources set out in the liquidity account as of 31 December 2022: 84,987 shares and €324,811 Full amount 9 December 2023
Performance share grants (21st resolution)   514,770 performance shares* 514,770 performance  shares (20 July 2022 plan) None 9 August 2024
* 0.50% of the number of shares comprising the Company’s share capital on the date of the Shareholders’ Meeting, corresponding to 514,770 performance shares.


6.2.5 Share buyback programme

Use of the authorisation granted by the Combined Shareholders’ Meeting of 9 June 2022

The Combined Shareholders’ Meeting of 9 June 2022 authorised the Management Board to purchase shares of the Company in the framework of an 18-month share buyback programme. The maximum purchase price per share was set at fifty euros (€50) (excluding fees and commissions). The number of shares that may be acquired cannot exceed 1% of the number of shares making up the Company’s share capital. The maximum amount of the funds earmarked for the realisation of this share buyback programme was set at thirty million euros (€30,000,000) (excluding expenses and commissions).

The objective of this programme is to ensure the promotion of the secondary market or the liquidity of the share by an investment services provider within the framework of an equity liquidity contract. The Company has entered into an equity liquidity contract (entrusted to Exane BNP Paribas as an investment services provider acting in full independence) meeting the acceptability criteria defined by the French Financial Markets Authority (AMF) in its decision no. 2021-01 of 22 June 2021 or any other subsequent decision by the AMF, providing for liquidity contracts for equity securities as an accepted market practice and which complies with the AMAFI Code of Ethics recognised by the AMF.

In the financial year 2022, under the liquidity agreement:

•   529,463 shares were purchased for €13,200,089;

•   518,018 shares were sold for €13,132,142.

Under this liquidity account, the following resources were included in the liquidity account as of 31 December 2022: 84,987 Rubis securities and €324,811.

Comprehensive information about this share buyback programme is available on the Company’s website (https://rubis.fr/en/share-buyback-program).

Authorisation proposed to the Combined Shareholders’ Meeting of 8 June 2023: description of the share buyback programme

The share buyback programme that will be submitted for the approval of the Combined Shareholders’ Meeting of 8 June 2023 is described hereafter in accordance with the provisions of Articles 241-2 et seq. of the General Regulation of the French Financial Markets Authority (the “AMF”).

The objectives of this programme will be:

•   to reduce the share capital by cancelling all or part of the shares thus purchased, this objective being subject to the adoption of the specific resolution (“Authorisation to be granted to the Management Board to reduce the share capital by cancelling the shares purchased by the Company (Article L. 22-10-62 of the French Commercial Code)”) submitted to the Combined Shareholders’ Meeting of 8 June 2023 (15th resolution) or any authorisation of the same nature granted by a subsequent Shareholders’ Meeting;

•   to deliver the shares thus purchased upon the exercise of rights attached to securities giving entitlement by redemption, conversion, exchange, presentation of a warrant or in any other manner, to the allocation of Company shares;

•   to award, allocate or transfer the shares thus purchased to employees and/or corporate officers of the Company and/or companies related to it, in accordance with applicable regulations, in particular in the context of stock option plans, award of shares free of charge or under any savings or shareholding plan, as well as any transactions to cover any share-based compensation scheme in accordance with applicable regulations;

•   to enable the market-making or liquidity of the share to be ensured by an investment services provider, through an equity liquidity contract that meets the acceptability criteria defined by the French Financial Markets Authority (AMF) and complies with an ethics charter recognised by the AMF;

•   to retain the shares thus purchased and sell them, transfer them, deliver them in payment or exchange them at a later date in the context of any external growth, merger, spin-off or contribution transactions;

•   to implement all other objectives and carry out all other transactions in accordance with the law and regulations in force, in particular any market practice that may be allowed by the applicable law or regulations or the AMF.

Purchase, sale, exchange and transfer transactions may take place at any time, except during the period of a public offer for the Company’s shares, in compliance with applicable regulations.

The transactions may be carried out by any means consistent with applicable law and regulations, including through acquisitions taking place under negotiated transactions.

The maximum amount of funds awarded to the share buyback programme will be one hundred million euros (€100,000,000) (excluding fees and commissions), in compliance with applicable regulations.

The maximum purchase price will be fifty euros (€50) (excluding fees and commissions) per share.

In the case of a capital increase through incorporation of issue premiums, reserves, profits or otherwise by allocating shares free of charge during the period of validity of the buyback programme, as well as in the case of a stock split or reverse stock split, the Management Board shall have the power to adjust, where necessary, the above-mentioned maximum unit price to account for the effect of these transactions on the share value.

Purchases of Company shares may relate to a number of shares such that:

•   the shares purchased by or on behalf of the Company during the buyback programme shall not exceed 10% of the shares comprising its share capital, it being specified that:

•   the number of shares acquired by the Company with a view to holding them and subsequent payment or exchange as part of a merger, spin-off or contribution is limited to 5% of the shares comprising its share capital, in accordance with legal provisions, and

•   for those bought back under the liquidity contract, a maximum percentage of 1% of the shares comprising the Company’s capital applies, bearing in mind that the number of shares taken into account for the calculation of this last limit of 1% corresponds to the number of shares purchased less the number of shares resold during the period of validity of the buyback programme under the conditions defined by the General Regulation of the French Financial Markets Authority (AMF), it being noted that the above percentage limits will be assessed at the time of the purchases and will apply to an amount of capital adjusted according to the transactions that may affect it after the Combined Shareholders’ Meeting of 8 June 2023;

•   the number of shares that the Company holds, directly or indirectly, at any time, will not exceed 10% of the shares comprising its share capital.

The programme covered by this description will be valid for a period of 18 months subject to and as from the date it is authorised by the Combined Shareholders’ Meeting of 8 June 2023, i.e., until 8 December 2024.

6.2.6 Potential share capital as of 31 December 2022

The securities that may grant access to the share capital are as follows:

•   preferred shares whose vesting period, retention period or conversion period is ongoing;

•   performance shares for which the vesting period is ongoing;

•   stock options not yet exercised;

•   equity warrants subscribed for by Crédit Agricole CIB and that may be exercised by the Company at its discretion.

As of 31 December 2022, there were no other securities that may grant access to the share capital.

The securities that may grant access to the share capital, as of 31 December 2022, broke as follows:

•   62 preferred shares (7 January 2019 plan) for which the vesting period was ongoing and that could be converted into a maximum of 6,200 ordinary shares. The Management Board, at its meeting of 9 January 2023, noted that, as the performance condition attached to this plan had not been met, none of these preferred shares could be converted into ordinary shares;

•   385,759 performance shares (17 December 2019 plan) for which the vesting period was ongoing. The Management Board, at its meeting of 16 March 2023, noted that, as the performance conditions attached to this plan had not been met, none of these performance shares could vest;

•   150,276 stock options (17 December 2019 plan) which could be exercised in 2023 subject to the fulfilment of performance conditions. The Management Board, at its meeting of 16 March 2023, noted that, as the performance conditions attached to this plan had not been met, none of these options could vest;

•   787,697 performance shares (6 November 2020 plan) for which the vesting period was ongoing;

•   87,502 stock options (6 November 2020 plan) which could be exercised in 2024 subject to the fulfilment of performance conditions;

•   43,516 performance shares (1st April 2021 plan) for which the vesting period was ongoing;

•   5,616 stock options (1st April 2021 plan) which could be exercised in 2024 subject to the fulfilment of performance conditions;

•   160,072 performance shares (13 December 2021 plan) for which the vesting period was ongoing;

•   514,770 performance shares (20 July 2022 plan) for which the vesting period was ongoing;

•   4,400,000 shares that could be issued as a result of the Company’s exercise, at its discretion, of 4,400,000 equity warrants that were fully subscribed by Crédit Agricole Corporate and Investment Bank on 9 November 2021 in its capacity as a financial intermediary (i.e., without this institution intending to remain a shareholder of the Company).

If all these securities giving access to the share capital had been issued as of 31 December 2022, the number of ordinary shares of the Company would have increased by 6,541,408 ordinary shares (representing approximately 6.35% of the share capital).

As a result, a shareholder owning 1% of the share capital on a non-diluted basis as of 31 December 2022 would own 0.94% of the share capital on a diluted basis.

A comprehensive statement of current stock option, performance share and preferred share plans is provided in section 6.5.6 of this document.

6.2.7 Statement of changes in share capital over the last five years

Date Transaction Amount of
capital increase
Number of
securities created
Share capital after
the transaction
Shares making up
the share capital
2018          
 19/01  Equity Line  €500,000  400,000  €117,835,600 94,265,740 ordinary shares
2,740 preferred shares
 19/02  Equity Line  €312,500  250,000  €118,148,100 94,515,740 ordinary shares
 2,740 preferred shares
 27/03  Equity Line  €375,000  300,000  €118,523,100 94,815,740 ordinary shares
 2,740 preferred shares
 17/04  Performance shares  €22,027.50  17,622  €118,545,127.50 94,833,362 ordinary shares
 2,740 preferred shares
 20/04  Equity Line  €312,500  250,000  €118,857,627.50 95,083,362 ordinary shares
 2,740 preferred shares
 24/05  Employee savings  €147,471.25  117,977  €119,005,098.75 95,201,339 ordinary shares
 2,740 preferred shares
 05/07  DPS*  €2,012,081.25  1,609,665  €121,017,180 96,811,004 ordinary shares
 2,740 preferred shares
2019          
 21/03  Equity Line  €500,000  400,000  €121,517,180 97,211,004 ordinary shares
 2,740 preferred shares
 22/05  Employee savings  €180,066.25  144,053  €121,697,246.25 97,355,057 ordinary shares
 2,740 preferred shares
 11/07  Preferred shares  €4,652.50  3,722  €121,701,898.75 97,355,057 ordinary shares
 6,462 preferred shares
 16/07  DPS*  €3,410,023.75  2,728,019  €125,111,922.50 100,083,076 ordinary shares
 6,462 preferred shares
 19/08  Performance shares  €10,935.00  8,748  €125,122,857.50 100,091,824 ordinary shares
 6,462 preferred shares
 02/09    Preferred shares  €180.00    144    €125,123,037.50   100,091,824 ordinary shares
 6,606 preferred shares
31/12 Conversion of preferred shares into ordinary shares €99,750 79,800      
  Cancellation of preferred shares converted into ordinary shares €(997.50) (798) €125,221,790 100,171,624 ordinary shares
 5,808 preferred shares
2020          
 02/03    Conversion of preferred shares into ordinary shares  €260,750    208,600           
  Cancellation of preferred shares
converted into ordinary shares
€(2,607.50) (2,086) €125,479,932.50 100,380,224 ordinary shares
 3,722 preferred shares
 13/03  Preferred shares  €2,132.50  1,706  €125,482,065.00 100,380,224 ordinary shares
 5,428 preferred shares
 20/05  Employee savings  €128,546.25  102,837  €125,610,611.25 100,483,061 ordinary shares
 5,428 preferred shares
 13/07  Preferred shares  €115  92  €125,610,726.25 100,483,061 ordinary shares
 5,520 preferred shares
 17/07  DPS*  €3,839,785  3,071,828  €129,450,511.25 103,554,889 ordinary shares
 5,520 preferred shares
 20/07  Preferred shares  €467.50  374  €129,450,978.75 103,554,889 ordinary shares
 5,894 preferred shares
 31/12 Conversion of preferred shares into ordinary shares  €88,250  70,600    
  Cancellation of preferred shares converted into ordinary shares  €(882.50)  (706)  €129,538,346.25 103,625,489 ordinary shares
 5,188 preferred shares
2021          
 02/03  Preferred shares  €431.25  345  €129,538,777.50 103,625,489 ordinary shares
 5,533 preferred shares
 05/03  Preferred shares  €1,446.25  1,157  €129,540,223.75 103,625,489 ordinary shares
 6,690 preferred shares
 19/05  Employee savings  €332,032.50  265,626  €129,872,256.25 103,891,115 ordinary shares
 6,690 preferred shares
  31/05 Cancellation of shares purchased under the share buyback programme   €(3,292,603.75)   (2,634,083)   €126,579,652.50  101,257,032 ordinary shares
 6,690 preferred shares
 08/07  DPS*  €3,392,697.50  2,714,158  €129,972,350.00 103,971,190 ordinary shares
 6,690 preferred shares
15/10 Cancellation of shares purchased under the share buyback programme   €(1,875,000.00)   (1,500,000)   €128,097,350.00  102,471,190 ordinary shares
 6,690 preferred shares
19/10 Preferred shares €175.00 140 €128,097,525.00 102,471,190 ordinary shares
6,830 preferred shares
 31/12 Conversion of preferred shares into ordinary shares  €79,875  63,900    
  Cancellation of preferred shares converted into ordinary shares  €(798.75)  (639)  €128,176,601.25 102,535,090 ordinary shares
 6,191 preferred shares
2022          
 11/01 Conversion of preferred shares into ordinary shares  €308,625  246,900    
  Cancellation of preferred shares converted into ordinary shares  €(3,086.25)  (2,469)  €128,482,140.00 102,781,990 ordinary shares
 3,722 preferred shares
 14/03  Preferred shares  €282.50  226  €128,482,422.50 102,781,990 ordinary shares
 3,948 preferred shares
 09/05 Cancellation of preferred shares bought back by the Company  €(4,292.50)  (3,434)  €128,478,130.00 102,781,990 ordinary shares
 514 preferred shares
 19/05  Employee savings  €214,470  171,576  €128,692,600.00 102,953,566 ordinary shares
 514 preferred shares
 13/09 Cancellation of preferred shares bought back by the Company  €(467.50)  (374)  €128,692,132.50 102,953,566 ordinary shares
 140 preferred shares
 29/11 Cancellation of preferred shares bought back by the Company  €(175)  (140)  €128,691,957.50 102,953,566 ordinary shares
0 preferred shares
 31/12  STATEMENT OF SHARE CAPITAL      €128,691,957.50 102,953,566 ORDINARY SHARES
 0 PREFERRED SHARES
* DPS: dividend payment in shares.

6.2.8 Additional information

•   No agreement anticipating preferential terms for the disposal or acquisition of shares liable to be submitted to the French Financial Markets Authority.

•   No pledge of the issuer’s shares held in a pure registered form (nominatif pur).

•   No public tender or exchange offer and no standing market offer (garantie de cours) carried out by third parties in respect of the Company’s shares.

•   No public exchange offer for the shares of another company made by Rubis.

6.3 Dividends

6.3.1 Dividend paid to the Limited Partners (or shareholders)

The Company pursues a stable dividend policy, with a payout ratio of over 60% and medium- to long-term dividend growth in line with earnings per share.

Accordingly, the Company will propose a dividend of €1.92 per ordinary share to the 2023 Shareholders’ Meeting. This amount is an increase of more than 3% compared to the dividend paid for the financial year 2021 (€1.86 per ordinary share and €0.93 per preferred share). There are no longer any preferred shares since February 2023.

DIVIDENDS PAID TO SHAREHOLDERS OVER THE LAST FIVE YEARS

Date of Shareholders’ Meeting Financial year
concerned
Number of shares Net dividend
paid
(in euros)
Total net amounts
distributed
(in euros)
    95,048,202 ordinary shares 1.50 142,572,303
Shareholders’ Meeting 07/06/2018 2017 2,740 preferred shares 0.75 2,055
    97,182,460 ordinary shares 1.59 154,520,111
Shareholders’ Meeting 11/06/2019 2018 2,740 preferred shares 0.79 2,165
    100,345,050 ordinary shares 1.75 175,603,837
Shareholders’ Meeting 11/06/2020 2019 3,722 preferred shares 0.87 3,238
    100,950,230 ordinary shares 1.80 181,710,414
Shareholders’ Meeting 10/06/2021 2020 5,188 preferred shares 0.90 4,669
    102,720,441 ordinary shares 1.86 191,060,020
Shareholders’ Meeting 09/06/2022 2021 514 preferred shares 0.93 478

Dividends not claimed within five years from the date of their payment are forfeited and paid to the French Treasury.

6.3.2 Dividend paid to the General Partners

Given that the status of General Partner implies unlimited joint and several personal liability, General Partners are entitled to a by-laws’ defined dividend that is calculated according to the formula set out in Article 56 of the by-laws.

The Total Shareholder Return is calculated between year Y (the “Relevant Financial Year”) and the year among the three previous years (Y-1, Y-2 and Y-3) in which the Rubis share price was the highest (the “Reference Price”).

TSR corresponds to the change in market capitalisation, plus dividends paid to the Limited Partners and cumulative rights detached between the year of the Reference Price and year Y.

The change in market capitalisation is equal to the product of the difference between (i) the average of the opening prices of the last 20 trading days of the Relevant Financial Year, and (ii) the highest among the averages of the opening prices of the last 20 trading days of each of the three Financial years preceding the Relevant Financial Year (the “Reference Price”), and the number of shares outstanding at the end of the Relevant Financial Year. This number of shares is reduced by the number of shares held by the Company with a view to their cancellation and new shares created since the end of the Reference Price financial year (with the exception of shares awarded free of charge as part of a capital increase through capitalisation of reserves, profits or issue premiums giving rise to adjustments).

When the TSR is positive, the dividend paid to the General Partners is equal to 3% of such amount, within the limit of 10% of net income, Group share and the distributable profit.

Half of this dividend is held by the General Partners in Rubis shares for a three-year period.

The General Partners split the dividend in accordance with the provisions of the 1997 Shareholders’ Agreement.

For 2019, the dividend paid to the General Partners amounted to €22,356,940. However, given the global economic situation related to the Covid-19 pandemic, which impacted the Rubis share price, the General Partners decided to block in partner current accounts 50% of their General Partners’ dividend until June 2022, or until an earlier date if the Rubis share price reached an average of €50 over 20 consecutive trading days (opening price). This 50%, which had been blocked in partner current accounts, was repaid to the General Partners on 30 June 2022.

For 2022, the application of the formula defined in Article 56 of the by-laws results in the TSR of Rubis shares being negative (-€2,328,362,568.91), thereby conferring no rights to a dividend for the General Partners (as for 2020 and 2021).

6.4 Employee shareholdings

As of 31 December 2022, Group employees owned 1.66% of Rubis’ share capital and voting rights through the Rubis Avenir mutual fund. Since the fund was put in place in 2002, Rubis has carried out a capital increase reserved for employees of eligible companies (companies with their registered office in France) every year. All these transactions have attracted a high level of participation by the Group’s employees.

6.4.1 Capital increase reserved for Group employees: 2022 operation

Acting pursuant to the Combined Shareholders’ Meeting’s delegation of 10 June 2021, on 13 January 2022, the Management Board carried out a capital increase reserved for employees of eligible Group companies through the Rubis Avenir mutual fund.

In accordance with Article L. 3332-19 of the French Labour Code and the delegation granted by the shareholders, the subscription price for new shares was set at 75% of the average listing opening prices during the 20 trading days preceding the 13 January 2022 meeting. This average amounted to €26.75, resulting in a subscription price of €20.07.

This transaction resulted in the subscription of 171,576 new shares for a total amount of €3,443,530.32, representing the payment of the par value in the amount of €214,470 and a share premium in the amount of €3,229,060.32. The subscription rate of the Group’s employees was 48.46%.

A new transaction was decided by the Management Board on 3 January 2023 and was ongoing as of the date this document was filed.

6.4.2 Summary table of capital increases reserved for employees

The table below presents the characteristics of the last three capital increases reserved for employees implemented by the Company.

    2022   2021   2020
Number of eligible employees   1,042   1,030   975
Number of subscriptions   505   683   515
Subscription rate   48.46%   66.31%   52.82%
Subscription price (in euros)   20.07   26.35   37.48
Total number of shares subscribed   171,576   265,626   102,837

6.5 Stock options, performance shares and preferred shares

In accordance with the provisions of Articles L. 225-184 and L. 225-197-4 of the French Commercial Code, this chapter constitutes the special report of the Management Board on stock options, performance shares and preferred shares.

6.5.1 Award policy

The Company has set up stock option plans, performance share plans and preferred share plans to motivate and retain high-potential executives and Senior Managers of subsidiaries whom it wishes to keep in its workforce over the long term to ensure its future growth. These plans also enable the Company to ensure that the interests of beneficiaries are aligned with those of shareholders over the long term.

The Managing Partners and the General Partners of the Company do not benefit from any such plan.

In accordance with the recommendations of the Afep-Medef Code, all plans issued by the Company are fully subject to performance conditions and a condition of the beneficiaries being in the Group’s workforce. The latter is assessed on the date of the exercise of the options, on the date of the vesting of the performance or preferred shares, as well as on the date on which the conversion period of the preferred shares into ordinary shares begins.

The main characteristics of the stock option, performance share and preferred share plans, and in particular the performance conditions to which they are fully subject, are set out in section 6.5.6 of this document.

6.5.2 Stock options

Plans in progress

NO PLAN WAS SET UP IN 2022

No stock option plan was set up in 2022. The Company no longer holds an authorisation to award stock options.

PLANS SET UP PRIOR TO 2022

On 1st April 2021, a stock option plan covering 5,616 options was set up. It benefited six employees. The subscription price for the new shares was set at €40.47, i.e., the average listing price for Rubis shares during the 20 trading days preceding 1st April 2021. No discount was applied.

On 6 November 2020, a stock option plan covering 87,502 options was set up. It benefited 36 employees. The subscription price for the new shares was set at €29.71, i.e., the average listing price for Rubis shares during the 20 trading days preceding 6 November 2020. No discount was applied.

On 17 December 2019, a stock option plan covering 150,276 options was set up. It benefited 41 employees. The subscription price for new shares was set at €52.04, i.e., the average listing price for Rubis shares during the 20 trading days preceding 17 December 2019. No discount was applied.

The exercise of the options awarded under these three plans is subject to the satisfaction of the performance conditions described below, which will be assessed upon the expiration of a vesting period of at least three years (i.e., at the earliest, 1st April 2024 for the 1st April 2021 plan, on the date the 2023 financial statements are published for the 6 November 2020 plan, and on the date the 2022 financial statements are published for the 17 December 2019 plan).

The exercise period for the options will last 10 years. No retention period has been set for the shares resulting from the exercise of the options.

The Management Board, at its meeting of 16 March 2023, noted that, as the performance conditions attached to the plan of 17 December 2019 set out below had not been met, none of the 150,276 options could be exercised.

Conditions attached to plans in progress

The exercise of stock options is subject to the beneficiary being a member of the Group’s workforce at the time they are exercised and to the satisfaction of the following performance conditions (assessed over three years):

•   Total Shareholder Return (“TSR”) of the Rubis share (condition relating to 50% of the total number of options awarded).
TSR corresponds to the change in the share price of the Rubis share plus the dividends distributed and detached rights over the period in question.
In order for all the options subject to this condition to be exercised, the cumulative TSR of the Rubis share calculated over three years must exceed the cumulative TSR of the SBF 120 over the same period, from date to date (i.e., from the date the plan is set up to the date the vesting period expires). Failing this, the condition will not be met and no options subject to this condition may be exercised;

•   Net income, Group share (condition relating to 25% of the total number of options awarded).
In order for all the options subject to this condition to be exercised, the average annual growth in net income, Group share must reach at least 6% over three financial years, i.e., a total of 18% over the period in question.
Nevertheless, a straight-line exercise rate will be applied to the number of options initially awarded in the case of growth between 9% and 18%. If growth is less than or equal to 9%, the condition will not be met and no options subject to this condition may be exercised;

•   earnings per share (“EPS”) (condition relating to 25% of the total number of options awarded).
In order for all the options subject to this condition to be exercised, the cumulative EPS growth of the Rubis share calculated over three financial years must exceed the cumulative FactSet consensus over the same period. Failing this, the condition will not be met and no options subject to this condition may be exercised.

Total number of outstanding stock options as of 31 December 2022

243,394 stock options resulting from the 17 December 2019, 6 November 2020 and 1st April 2021 plans.

As of 16 March 2023, there were 98,118 stock options remaining to be exercised under the 2020 and 2021 plans.

6.5.3 Performance shares

Plans in progress

PLAN SET UP IN 2022

On 20 July 2022, a performance share plan covering 514,770 shares was set up under the authorisation granted by the Shareholders’ Meeting of 9 June 2022. It benefited 15 employees.

Following the implementation of this plan, the Company no longer has any authorisation to grant performance shares.

Conditions attached to the plan of 20 July 2022

The vesting of performance shares is subject to the beneficiary being a member of the Group’s workforce on the vesting dates, and to the satisfaction of the following performance conditions (assessed over three years):

•   financial conditions (75% of the total award):

•   change in Total Shareholder Return (“TSR”) of the Rubis share compared to the change in the TSR of the SBF 120 (condition relating to 25% of the total number of performance shares awarded).
The change in TSR for Rubis share corresponds to the change in the share price, plus dividends distributed and detached rights over the period in question.
In order for all the performance shares subject to this condition to vest, the change in the TSR of the Rubis share must exceed the change in the TSR of the SBF 120 over three years, from date to date (i.e., between the date the plan is set up (20 July 2022) and the date the vesting period expires (i.e., 20 July 2025). Failing this, the performance condition will not be met and no performance shares subject to this condition will vest,

•   growth rate of the Group’s consolidated EBITDA (condition relating to 50% of the total number of performance shares awarded).
To acquire all the performance shares subject to this condition, the growth rate of the Group’s consolidated EBITDA calculated between the financial years ended 31 December 2022 and 31 December 2025 must be greater than or equal to 15% over the whole of this period.
Nevertheless, a straight-line vesting rate will be applied to the number of shares initially awarded if the growth rate of the Group’s consolidated EBITDA is between 5% and 15%. If this growth rate is less than or equal to 5%, the performance condition will not be met and no performance shares subject to this condition will vest.
The Management Board wanted to mobilise the Senior Managers of the subsidiaries and high-potential executives to focus on operational performance (before implementation of the financial strategy) and, consequently, on growth in profit. This is why it retained this performance condition and attached significant weight to it;

•   non-financial conditions (25% of the total award).
As this plan was set up after the Company published its CSR Roadmap target monitoring in June 2022, the plan is subject to the following non-financial conditions, which have been selected in view of the strategic challenges and targets set out in this monitoring:

•   reinforcement of gender balance within the Group’s management bodies (excluding the Rubis Terminal JV) (condition relating to 15% of the total number of performance shares awarded).
To acquire all the performance shares subject to this condition, the average rate of women on the Management Committees of Rubis and all business units in the Group (including the Photosol entities but excluding the Rubis Terminal JV), on a like-for-like basis, must be greater than or equal to 30% as of 31 December 2025.
Failing this, the performance condition will not be met and no performance shares subject to this condition will vest.
This condition is particularly demanding since it is stricter than the target of the same nature included in the CSR Roadmap. This condition covers an expanded scope that includes the Photosol entities,

•   contribution to local development through the implementation of community investment in 100% of Group business units (excluding the Rubis Terminal JV) (condition relating to 10% of the total number of performance shares awarded).
To acquire all the performance shares subject to this condition, 100% of the Group’s business units (including the Photosol entities but excluding the Rubis Terminal JV), on a like-for-like basis, must have implemented, by 31 December 2025 at the latest, a societal action meeting a local need in connection with one of the following three areas: education, health or the energy transition.
Failing this, the performance condition will not be met and no performance shares subject to this condition will vest.

PLANS SET UP PRIOR TO 2022

Plan set up under the authorisation granted by the 10 June 2021 Shareholders’ Meeting (plan of 13 December 2021)

On 13 December 2021, a performance share plan covering 160,072 shares was set up under the authorisation granted by the Combined Shareholders’ Meeting of 10 June 2021. It benefited 13 employees.

Conditions attached to the plan of 13 December 2021

The vesting of performance shares is subject to the beneficiary being a member of the Group’s workforce on the vesting date and to the satisfaction of the following performance conditions (assessed over three years):

•   financial conditions (90% of the total award)

•   change in Total Shareholder Return (“TSR”) of Rubis compared to the change in the TSR of the SBF 120 (condition relating to 40% of the total number of performance shares awarded).
The change in TSR for Rubis share corresponds to the change in the share price, plus dividends distributed and detached rights over the period in question.
In order for all the performance shares subject to this condition to vest, the change in the TSR of Rubis’ share must exceed the change in the TSR of the SBF 120 over three years, from date to date (i.e., between the date the plan is set up (13 December 2021) and the date the vesting period expires (13 December 2024).
Failing this, the performance condition will not be met and no performance shares subject to this condition will vest.
The weighting attached to this condition was reduced from 50% (under the previous plans) to 40% in order to accommodate two new non-financial conditions (presented below) into this plan,

•   growth rate of net income, Group share set out in the consolidated financial statements (condition relating to 25% of the total number of performance shares awarded).
In order for all the performance shares subject to this condition to vest, the product of the compound annual growth rate of net income, Group share calculated in respect of financial years 2022, 2023 and 2024, multiplied by three (i.e., the number of financial years making up the performance period) must exceed or be equal to 18%.
Nevertheless, a straight-line exercise rate will be applied to the number of shares initially awarded if this product is between 9% and 18%. If this product is less than or equal to 9%, the condition will not be met and no performance shares subject to this condition will vest,

•   growth rate of earnings per share (“EPS”) set out in the consolidated financial statements compared to the consensus (condition relating to 25% of the total number of performance shares awarded).
In order for all the performance shares subject to this condition to vest, the growth rate of EPS between financial years 2021 and 2024 (inclusive) must exceed the FactSet consensus over the same period. To assess the growth rate of EPS over the period in question, the first consensus published by FactSet after the plan is set up and relating to the financial year 2024 will be used.
Failing this, the performance condition will not be met and no performance shares subject to this condition will vest;

•   non-financial conditions (10% of the total award).
As this plan was set up after the Company published its CSR Roadmap on 6 September 2021, the plan is subject to the following non-financial conditions, which have been selected in view of the strategic challenges and targets set out in the CSR Roadmap:

•   improvement of gender diversity on the Management Committees of Rubis Énergie and its subsidiaries (condition relating to 5% of the total number of performance shares awarded).
In order for all of the performance shares subject to this condition to vest, the average percentage of women on the Management Committees of Rubis Énergie and its subsidiaries as of 31 December 2024 must exceed or be equal to 30%.
Failing this, the performance condition will not be met and no performance shares subject to this condition will vest.
This condition is particularly demanding as it is stricter than the target of a similar nature set out in the CSR Roadmap, which aims to achieve the same proportion of women by 2025.

•   Carbon Disclosure Project (CDP) score on the Climate Change questionnaire (condition relating to 5% of the total number of performance shares awarded).
In order for all of the performance shares subject to this condition to vest, the score awarded by CDP for the 2024 campaign (published in December 2024) must not be lower than the score Rubis received on 7 December 2021 (i.e., a B score).
Failing this, the performance condition will not be met and no performance shares subject to this condition will vest.

Plans set up under the authorisation granted by the 11 June 2019 Shareholders’ Meeting (plans of 1st April 2021, 6 November 2020 and 17 December 2019)

On 1st April 2021, a performance share plan covering 43,516 shares was set up under the authorisation granted by the Combined Shareholders’ Meeting of 11 June 2019. It benefited seven employees.

On 6 November 2020, a performance share plan covering 787,697 shares was set up. It benefitted 55 employees.

On 17 December 2019, a performance share plan covering 385,759 shares was set up. It benefitted 49 employees.

The vesting of performance shares awarded under these three plans is subject to the satisfaction of the performance conditions described below, which will be assessed upon the expiration of a vesting period of at least three years (i.e., at the earliest, 1st April 2024 for the 1st April 2021 plan, on the date the 2023 financial statements are published for the 6 November 2020 plan, and on the date the 2022 financial statements are published for the 17 December 2019 plan).

No retention period has been set.

The Management Board, at its meeting of 16 March 2023, noted that, as the performance conditions attached to the plan of 17 December 2019 set out below had not been met, none of the 385,759 performance shares could vest.

Conditions attached to plans dated 1st April 2021, 6 November 2020 and 17 December 2019

The vesting of performance shares is subject to the beneficiary being a member of the Group’s workforce on the vesting dates, and to the satisfaction of the following (financial only) performance conditions (assessed over three years):

•   Total Shareholder Return (TSR) of the Rubis share (condition relating to 50% of the total number of performance shares awarded).
TSR corresponds to the change in the share price of the Rubis share plus the dividends distributed and detached rights over the period in question.
In order for all the performance shares subject to this condition to vest, the cumulative TSR of the Rubis share calculated over three years must exceed the cumulative TSR of the SBF 120 over the same period, from date to date (i.e., from the date the plan is set up to the date the vesting period expires). Failing this, the performance condition will not be met and no performance shares subject to this condition will vest;

•   net income, Group share (condition relating to 25% of the total number of performance shares awarded).
In order for all the performance shares subject to this condition to vest, the average annual growth in net income, Group share must reach at least 6% over three financial years, i.e., a total of 18% over the period in question.
Nevertheless, a straight-line exercise rate will be applied to the number of shares initially awarded in the case of growth between 9% and 18%. If growth is less than or equal to 9%, the condition will not be met and no performance shares subject to this condition will vest;

•   earnings per share (“EPS”) (condition relating to 25% of the total number of performance shares allocated).
In order for all the performance shares subject to this condition to vest, the cumulative EPS growth of the Rubis share calculated over three financial years must exceed the cumulative FactSet consensus over the same period. Failing this, this condition will not be met and no performance shares subject to this condition will vest.

Total number of outstanding performance shares as of 31 December 2022

1,891,814 performance shares resulting from the 17 December 2019, 6 November 2020, 1st April 2021, 13 December 2021 and 20 July 2022 plans.

As of 16 March 2023, there were 1,506,055 performance shares in the process of vesting under the 2020, 2021 and 2022 plans.

6.5.4 Preferred shares

Preferred shares have the same par value as ordinary shares but do not carry voting rights or preferential subscription rights. However, commencing on their issue date (at the end of the vesting period), each preferred share benefits from a dividend equal to 50% of that paid in respect of an ordinary share, it being specified that, taking into account the conversion coefficient applied (0 to 100), 100 times fewer preferred shares are issued than ordinary shares. The dividend is paid in cash without it being possible to opt for payment in shares.

Plans in progress

NO PLAN WAS SET UP IN 2022

No preferred share plan was set up in 2022. The Company no longer has an authorisation to issue preferred shares.

PLANS SET UP PRIOR TO 2022

17 December 2019 plan

The plan of 17 December 2019 relating to 662 preferred shares was cancelled before the end of the vesting period by decision of the Management Board of 12 December 2022 after obtaining the agreement of the beneficiary.

7 January 2019 plan

As of 31 December 2022, the 7 January 2019 plan covering 62 preferred shares was in the process of vesting. The four-year vesting period ended on 7 January 2023 (the beneficiary, whose compensation is taxable outside France, having opted for a deferred vesting of one additional year).

After noting the presence of the beneficiary in the Group’s workforce, the Management Board of 9 January 2023 decided to create the 62 preferred shares. It nevertheless noted that, as the performance condition presented below was not met, the conversion coefficient was equal to 0. Consequently, as none of the 62 preferred shares could be converted into ordinary shares, they were bought back by the Company with a view to their cancellation.

19 October 2018 plan

The three-year vesting period applicable to the 19 October 2018 plan covering 140 preferred shares expired on 19 October 2021.

After acknowledging that the beneficiary was member of the Group’s workforce, at its meeting of 19 October 2021, the Management Board decided to create 140 preferred shares.

At the end of the one-year retention period, the Management Board meeting of 19 October 2022 found that, as the performance condition presented hereafter had not been met, the conversion coefficient was equal to 0. Consequently, as none of the 140 preferred shares could be converted into ordinary shares, they were bought back by the Company with a view to their cancellation.

5 March 2018 plan

The three-year vesting period applicable to the 5 March 2018 plan covering 1,157 preferred shares expired on 5 March 2021.

After acknowledging that the beneficiary was member of the Group’s workforce, at its meeting of 5 March 2021, the Management Board decided to create 1,157 preferred shares.

At the end of the one-year retention period, the Management Board meeting held on 7 March 2022 found that, as the performance condition presented hereafter had not been met, the conversion coefficient was equal to 0. As a result, as none of the 1,157 preferred shares could be converted into ordinary shares, they were bought back by the Company with a view to their cancellation.

2 March 2018 plan

The three-year vesting period applicable to the 2 March 2018 plan covering 345 preferred shares expired on 2 March 2021.

After acknowledging that the beneficiary was member of the Group’s workforce, at its meeting of 2 March 2021, the Management Board decided to create 345 preferred shares.

At the end of the one-year retention period, the Management Board meeting of 2 March 2022 found that, as the performance condition presented hereafter had not been met, the conversion coefficient was equal to 0. Consequently, as none of the 345 preferred shares could be converted into ordinary shares, they were bought back by the Company with a view to their cancellation.

19 July 2017 plan

The 19 July 2017 plan relating to 374 preferred shares, issued on 19 July 2020, had an initial one-year retention period expiring on 19 July 2021.

In order to take the exceptional effects of the health crisis linked to the Covid-19 pandemic into account and in order to further mobilise beneficiaries, at its 16 July 2021 meeting, the Management Board decided to extend the retention period for the shares under the 19 July 2017 plan by 12 months, i.e., until 18 July 2022 (evening).

The period during which the AAORR of Rubis’ share (i.e., the performance condition presented hereafter) is calculated was consequently extended to five full years (instead of the four full years that initially applied). The conversion ratio was 100 ordinary shares per 1 preferred share in respect of AAORR more than or equal to 10%, i.e., at least 50% over five years (compared to, initially, at least 40% over 4 years). Therefore, the extension of the performance period was combined with the achievement of a more demanding target.

At the end of the two-year retention period, the Management Board meeting of 19 July 2022 found that, as the performance condition presented hereafter had not been met, the conversion coefficient was equal to 0. Consequently, as none of the 374 preferred shares could be converted into ordinary shares, they were bought back by the Company with a view to their cancellation.

13 March 2017 plan

The 13 March 2017 plan had an initial one-year retention period expiring on 13 March 2021.

Out of the 1,932 preferred shares allocated under the plan, only 1,706 had been issued on 13 March 2020, as 226 preferred shares had been subject to a deferred vesting (of one year) for which certain beneficiaries whose income is taxable outside of France had opted.

In order to take the exceptional effects of the health crisis linked to the Covid-19 pandemic into account and in order to further mobilise beneficiaries, at its 12 March 2021 meeting, the Management Board decided to extend the retention period for the 1,706 preferred shares issued by 12 months, i.e., until 12 March 2022 (evening), and to extend the deferred vesting of the 226 preferred shares allocated to beneficiaries taxable outside of France by 12 months, i.e., until 12 March 2022 (evening).

The period during which the AAORR of Rubis’ share (i.e., the performance condition presented hereafter) is calculated was consequently extended to five full years (instead of the four full years that initially applied). The conversion ratio was 100 ordinary shares per 1 preferred share in respect of AAORR more than or equal to 10%, i.e., at least 50% over five years (compared to, initially, at least 40% over 4 years). Therefore, the extension of the performance period was combined with the achievement of a more demanding target. The deferred vesting for which certain beneficiaries whose income is taxable outside of France had opted therefore was extended from one year to two years.

The Management Board meeting held on 14 March 2022 found that, as the performance condition presented hereafter had not been met, the conversion coefficient was equal to 0. Consequently, as none of the 1,932 preferred shares could be converted into ordinary shares, they were bought back by the Company with a view to their cancellation.

11 July 2016 plan

The conversion period for the 11 July 2016 plan relating to 3,814 preferred shares convertible into 381,400 ordinary shares (the performance condition of which presented hereafter had been approved by the Management Board at its meeting held on 13 July 2020) expired on 11 January 2022.

The 3,814 preferred shares were converted into 381,400 ordinary shares.

Conditions attached to plans in progress

Both vesting of preferred shares and their conversion into ordinary shares are subject to the beneficiary being a member of the Group’s workforce (the presence condition attached to this conversion being mandatory on the day when the conversion period starts)

The conversion of the preferred shares takes place depending on the level of achievement of the Average Annual Overall Rate of Return (“AAORR”) of Rubis’ share. The AAORR, which incorporates the stock market performance of the share and dividends and detached rights for the period, must be equal to or greater than 10% over four full years (i.e., a minimum of 40% over four years) for all plans other than the plans of 13 March 2017 and 19 July 2017 for which the AAORR is assessed over five full years (i.e., a minimum of 50% over five years). The conversion ratio is one preferred share for 100 ordinary shares if AAORR is more than or equal to 10%. The conversion coefficient used for converting preferred shares into ordinary shares varies on a straight-line basis between 0 and 100 depending on the actual AAORR on the conversion date.

This performance condition is assessed at the time the preferred shares are converted into ordinary shares. If the AAORR level of achievement is zero or less than 100% or if the beneficiary has left the Group, the preferred shares that are not converted may be bought back by the Company at par value with a view to their cancellation.

Vesting and retention periods

With the exception of the 2 September 2015 plan – for which the Shareholders’ Meeting had set a two-year vesting period followed by a two-year retention period – the above plans have a three-year vesting period followed by a minimum one-year retention period.

Total number of outstanding preferred shares as of 31 December 2022

62 preferred shares resulting from the 7 January 2019 plan for which the vesting period was ongoing.

On 14 February 2023, all of these preferred shares were cancelled.

6.5.5      Number of ordinary shares that may be issued as a result of all current plans as of 31 December 2022

As of 31 December 2022, the potential volume of ordinary shares that may be issued as a result of all stock option, performance share and preferred share plans in the process of vesting amounted to 2,141,408 shares, i.e., 2.08% of the share capital, broken down as follows:

•   243,394 shares in respect of stock option plans for which the vesting period was ongoing;

•   1,891,814 shares in respect of performance share plans for which the vesting period was ongoing;

•   6,200 shares in respect of preferred share plans that had not yet been converted into ordinary shares.

6.5.6 Monitoring of stock option, performance share and preferred share plans

The tables below present the characteristics of the stock option, performance share and preferred share plans outstanding as of 31 December 2022, as well as the history of completed plans.

STOCK OPTION PLANS OUTSTANDING AS OF 31 DECEMBER 2022

Stock option plans 2019 Plan 2020 Plan 2021 Plan
Date of Shareholders’ Meeting 11/06/2019 11/06/2019 11/06/2019
Date of grant by the Management Board 17/12/2019 06/11/2020 04/01/2021
Total number of shares available for subscription(1) 150,276 87,502 5,616
Total number of beneficiaries 41 36 6
• of which corporate officers 0 0 0
Start date for exercising options (at the earliest) Date the 2022 annual
financial statements are
published
Date the 2023 annual
financial statements
are published
1st April 2024
Expiration date for exercising options (at the earliest) Date the 2032 annual
financial statements
are published
Date the 2033 annual
financial statements
are published
1st April 2034
Subscription price (in euros) 52.04 29.71 40.47
Performance conditions (assessed over three years):      
• Total Shareholder Return (TSR) of the Rubis share Relates to 50%
of the award(2)
Relates to 50%
of the award(5)
Relates to 50%
of the award(8)
• net income, Group share Relates to 25%
of the award(3)
Relates to 25%
of the award(6)
Relates to 25%
of the award(6)
• earnings per share (EPS) Relates to 25%
of the award(4)
Relates to 25%
of the award(7)
Relates to 25%
of the award(7)
Total number of options exercised 0 0 0
Number of cancelled/void options 0 0 0
Number of options outstanding as of 31/12/2022 150,276 87,502 5,616
(1) One option gives the right to subscribe for one share.
(2) Cumulative TSR of Rubis’ share from 17 December 2019 to 17 December 2022 that is higher than the cumulative TSR of the SBF 120 over the same period.
(3) Average annual growth in net income, Group share of 6% between financial years 2020 and 2022 (i.e., a minimum of 18% over financial years 2020 to 2022, with straight-line degression between 18% and 9%).
(4) Cumulative EPS growth of Rubis’ share over financial years 2020 to 2022 that is higher than the FactSet consensus over the same period.
(5) Cumulative TSR of Rubis’ share from 6 November 2020 to 6 November 2023 that is higher than the cumulative TSR of the SBF 120 over the same period.
(6) Average annual growth in net income, Group share of 6% between financial years 2021 and 2023 (i.e., a minimum of 18% over financial years 2021 to 2023, with straight-line degression between 18% and 9%).
(7) Cumulative EPS growth of Rubis’ share over financial years 2021 to 2023 that is higher than the FactSet consensus over the same period.
(8) Cumulative TSR of Rubis’ share from 1st April 2021 to 1st April 2024 that is higher than the cumulative TSR of the SBF 120 over the same period.

OPTIONS GRANTED TO AND EXERCISED BY THE GROUP’S TOP 10 NON-CORPORATE OFFICER EMPLOYEES DURING THE FINANCIAL YEAR 2022

  Number of options
granted/exercised
Weighted
average price
(in euros)
Plan date
Options granted by the issuer during the financial year to the top 10 Group employees that received the largest awards 0 0 0
Options exercised during the year by the 10 Group employees exercising the highest number of options 0 - -

HISTORY OF EXPIRED STOCK OPTION PLANS

Plan date Number of
options allocated(1)
Of which
options cancelled
Number of
options exercised
Expiration date for
exercising options
17 July 2001 222,939(2) 0 222,939 16 July 2011
13 December 2002 12,349(2) 0 12,349 12 December 2012
19 January 2004 38,143 0 38,143 18 January 2014
29 July 2004 4,978 0 4,978 28 July 2014
12 July 2005 6,493 0 6,493 11 July 2015
27 July 2006 344,980 21,383 323,597 26 July 2012
17 November 2006 5,116 0 5,116 16 November 2012
29 August 2007 8,314 0 8,314 28 August 2013
12 February 2008 24,732 0 24,732 11 February 2013
4 June 2008 10,392 0 10,392 3 June 2014
22 July 2009 752,485 14,548 737,937 21 July 2014
28 April 2011 79,376 21,082 58,294 27 April 2016
9 July 2012 548,525 0 548,525 8 July 2017
(1) Following readjustments due to various capital increases.
(2) Before 8 July 2011 two-for-one Rubis share split.

PERFORMANCE SHARE PLANS OUTSTANDING AS OF 31 DECEMBER 2022

Performance share plan 2019 Plan 2020 Plan 2021 Plan 2021 Plan 2022 Plan
Date of Shareholders’ Meeting 11/06/2019 11/06/2019 11/06/2019 10/06/2021 09/06/2022
Date of grant by the Management Board 17/12/2019 06/11/2020 01/04/2021 13/12/2021 20/07/2022
Number of shares awarded 385,759 798,697 43,516 160,072 514,770
Total number of beneficiaries 49 55 7 13 15
 of which corporate officers(1) 0 1 0 0 0
 of which French residents 21 24 4 2 12
 of which non-French residents 28 31 3 11 3
Vesting date of shares (at the earliest):          
• French residents Date the 2022 annual financial statements are published Date the 2023 annual financial statements are published 1st April 2024

•  TSR-based shares: 13/12/2024

•  Shares subject to the other performance conditions: date the 2024 annual financial statements are closed

•  TSR-based shares: 20/07/2025

•  Shares subject to the other performance conditions: date the 2025 annual financial statements are closed

• non-French residents
Performance conditions
(assessed over three years):
         

•  Total Shareholder Return (TSR)
of the Rubis share

Relates
to 50% of
the award(2)
Relates
to 50% of
the award(5)
Relates
to 50% of
the award(8)
Relates
to 40% of
the award(9)
Relates
to 25% of
the award(14)
•   net income, Group share Relates
to 25% of
the award(3)
Relates
to 25% of
the award(6)
Relates
to 25% of
the award(6)
Relates
to 25% of
the award(10)
NA
•  EBITDA NA NA NA NA Relates
to 50% of
the award(15)

•   earnings per Rubis share (EPS)/net income
per Rubis share

Relates
to 25% of
the award(4)
Relates
to 25% of
the award(7)
Relates
to 25% of
the award(7)
Relates
to 25% of
the award(11)
NA

•   score from CDP (Carbon Disclosure Project)
– Climate Change questionnaire

NA NA NA Relates
to 5% of
the award(12)
NA
•   gender diversity on management bodies NA NA NA Relates
to 5% of
the award(13)
Relates
to 15% of
the award(16)
•   community investment NA NA NA NA Relates
to 10% of
the award(17)
Number of shares vested 0 0 0 0 0
Number of cancelled/void stock 0 0 0 0 0
Number of shares subject to deferred vesting NA   NA NA NA NA
Number of performance shares outstanding as of 31/12/2022 385,759 787,697 43,516 160,072 514,770
(1) Exclusively Group subsidiaries.
(2) Cumulative TSR of Rubis’ share from 17 December 2019 to 17 December 2022 that is higher than the cumulative TSR of the SBF 120 over the same period.
(3) Average annual growth in net income, Group share of 6% over financial years 2020 and 2022 (i.e., a minimum of 18% over financial years 2020 to 2022, with straight-line degression between 18% and 9%).
(4) Cumulative EPS growth of Rubis’ share over financial years 2020 and 2022 that is higher than the FactSet consensus over the same period.
(5) Cumulative TSR of Rubis’ share from 6 November 2020 to 6 November 2023 that is higher than the cumulative TSR of the SBF 120 over the same period.
(6) Average annual growth in net income, Group share of 6% between financial years 2021 and 2023 (i.e., a minimum of 18% over financial years 2021 to 2023, with straight-line degression between 18% and 9%).
(7) Cumulative EPS growth of Rubis’ share over financial years 2021 to 2023 that is higher than the FactSet consensus over the same period.
(8) Cumulative TSR of Rubis’ share from 1st April 2021 to 1st April 2024 that is higher than the cumulative TSR of the SBF 120 over the same period.
(9) Change in the TSR of Rubis’ share between 13 December 2021 and 13 December 2024 that is higher than the change in the TSR of the SBF 120 over the same period.
(10) Product of the compound annual growth rate of the net income, Group share set out in the consolidated financial statements for financial years 2022, 2023 and 2024 multiplied by three (i.e., the number of financial years making up the performance period) 18%, with straight-line degression between 18% and 9%.
(11)Growth rate of Rubis EPS set out in the consolidated financial statements between financial years 2021 and 2024 (inclusive) that is higher than the FactSet consensus over the same period.
(12) Score awarded to Rubis by CDP in 2024 to the score awarded to Rubis by CDP on 7 December 2021 (i.e., a B score).
(13) Average percentage of women on the Management Committees of Rubis Énergie and its subsidiaries as of 31 December 2024 ≥ 30%.
(14) Change in the TSR of Rubis’ share between 20 July 2022 and 20 July 2025 that is higher than the change in the TSR of the SBF 120 over the same period.
(15) Growth rate of the Group’s consolidated EBITDA between financial years 2022 and 2025 15%, with straight-line degression between 15% and 5%.
(16) Average percentage of women on the Management Committees of all Group business units (excluding the Rubis Terminal JV) as of 31 December 2025 ≥ 30%.
(17) Implementation of community investment in 100% of the Group’s business units (excluding the Rubis Terminal JV) as of 31 December 2025.

PERFORMANCE SHARES AWARDED TO AND PERFORMANCE SHARES ACQUIRED BY THE GROUP’S TOP 10 NON-CORPORATE OFFICER EMPLOYEES DURING THE FINANCIAL YEAR 2022


Number of

performance shares

allocated/vested

Plan date
Performance shares awarded by the issuer during the financial year to the 10 Group employees with the highest number of shares thus granted 472,748 20/07/2022
Performance shares vested during the financial year by the 10 Group employees with the highest number of shares thus vested 0 -

HISTORY OF EXPIRED PERFORMANCE SHARE PLANS

Plan date Number of
performance
shares allocated(1)
Of which
cancelled
shares
Number of
performance
shares vested
Vesting
date
End of
retention
period
27 July 2006 44,304(2) 3,054 41,250 11 March 2010 11 March 2012
17 November 2006 717(2) 0 717 11 March 2010 11 March 2012
29 August 2007 600(2) 0 600 15 October 2010 15 October 2012
12 February 2008 1,768(2) 0 1,768 14 February 2011 14 February 2014
4 June 2008 728(2) 0 728 16 June 2011 16 June 2013
22 July 2009 106,405 2,080 104,325 20 August 2012 3 August 2014
28 April 2011 11,356 2,636 8,720 13 May 2014 13 May 2016
9 July 2012 195,751 0 195,751 10 July 2015 10 July 2017
18 July 2012 1,444 0 1,444 20 July 2015 20 July 2017
18 September 2012 3,609 0 3,609 Shares cancelled -
9 July 2013 11,395 0 11,395 11 July 2016 11 July 2018
3 January 2014 5,101 0 5,101 3 January 2017 3 January 2019
31 March 2014 751 0 751 3 April 2017 3 April 2017(3)
18 August 2014 114,616 1,500 113,116 18 August 2017 18 August 2019
17 April 2015 17,622 0 17,622 17 April 2018 17 April 2020
(1) Following readjustments due to various capital increases.
(2) Before 8 July 2011 two-for-one Rubis share split.
(3) Standard retention period of two years from vesting not applicable to the sole beneficiary due to his invalidity corresponding to classification in the second category provided for in Article L. 341-4 of the French Social Security Code.

PREFERRED SHARE PLANS OUTSTANDING AS OF 31 DECEMBER 2022

Preferred share plans 2016 Plan 2017 Plan 2017 Plan 2018 Plan 2018 Plan 2018 Plan 2019 Plan 2019 Plan
Date of Shareholders’ Meeting 09/06/2016 09/06/2016 08/06/2017 08/06/2017 08/06/2017 08/06/2017 08/06/2017 08/06/2017
Date of grant by the Management Board 11/07/2016 13/03/2017 19/07/2017 02/03/2018 05/03/2018 19/10/2018 07/01/2019 17/12/2019
Number of preferred shares allocated 3,864(5) 1,932(5) 374(5) 345 1,157 140 62 662
Total number of beneficiaries 51 19 6 1 10 1 1 1
•   of which corporate officers(1) 2 2 0 1 1 1 0 0
•   of which French residents 38 15 5 1 10 1 0 1
  of which non-French residents 13 4 1 0 0 0 1 1
Vesting date of preferred shares:                
  French residents 11/07/2019 13/03/2020 20/07/2020 02/03/2021 05/03/2021 19/10/2021 07/01/2022 17/12/2022
  non-French residents 11/07/2020 13/03/2022 20/07/2020 NA NA NA 07/01/2023 17/12/2023
Date of preferred shares may be converted into ordinary shares 13/07/2020 13/03/2022 19/07/2022 02/03/2022 05/03/2022 19/10/2022 07/01/2023 17/12/2023
Expiration date of the ordinary share conversion period 13/01/2022 13/09/2023 19/01/2024 01/09/2023 04/09/2023 18/04/2024 06/07/2024 16/06/2025
Number of preferred shares vested 3,814 1,932 374 345 1,157 140 - 0
Number of preferred shares cancelled/void 50 1,932 374 345 1,157 140 - 662
Number of preferred shares subject to deferred vesting - 0 0 0 0 0 0 0
Performance condition (assessed over a minimum of four years):                
  reference price(2) (for the assessment of the AAORR(3)) (in euros) 33.78 43.10 50.28 57.97 57.89 47.28 46.78 52.12
  AAORR(3) achieved 46.56% -16.75% -38.30% -38.68% -38.80% -38.80% - NA
  conversion coefficient applied(4) 100 0 0 0 0 0 - NA
Number of preferred shares converted into ordinary shares 3,814 0 0 0 0 0 - NA
Number of preferred shares outstanding as of 31/12/2022 0 0 0 0 0 0 62 0
(1) Exclusively Group subsidiaries.
(2) Average of the opening prices quoted for Rubis shares during the 20 trading days preceding the date the preferred shares were allocated.
(3) Average Annual Overall Rate of Return (“AAORR”) of Rubis’ share equal to a minimum of 10% (i.e., a minimum AAORR of 40% over four years) for all plans other than the plans of 13 March 2017 and 19 July 2017, for which the AAORR was increased to at least 50% over five years.
(4) The conversion coefficient varies between 0 and 100 ordinary shares for one preferred share, depending on the actual AAORR. Straight-line degression will be applied between the actual AAORR and the target AAORR (10%) giving the right to a maximum coefficient of 100.
(5) After 28 July 2017 two-for-one Rubis share split.

PREFERRED SHARES AWARDED TO AND PREFERRED SHARES ACQUIRED BY THE GROUP’S TOP 10 NON-CORPORATE OFFICER EMPLOYEES DURING THE FINANCIAL YEAR 2022


Number of preferred

shares allocated/vested

  Plan date
Preferred shares awarded by the issuer during the financial year to the 10 Group employees with the highest number of shares thus granted   0   -
Preferred shares vested during the financial year by the 10 Group employees with the highest number of shares thus vested   226   13/03/2017

HISTORY OF EXPIRED PREFERRED SHARE PLANS

Plan date Number of
preferred
shares
allocated
Of which
cancelled
shares
Number of
preferred
shares vested
Vesting
date
End of
retention
period
Number of
preferred
shares
converted
into ordinary
shares
9 September 2015 2,884* 0 2,884 2 September 2017 2 September 2019 2,884
* After 28 July 2017 two-for-one Rubis share split.

6.6 Relations with investors and financial analysts

The Group strives to maintain close relationships with financial analysts and all its shareholders, whether individual or institutional, French or foreign. Rubis has also developed its relationships with French and international brokers, including CM-CIC, Exane BNP Paribas, Gilbert Dupont, Kepler Cheuvreux, Oddo, Portzamparc and Société Générale. Analyst and investor meetings and/or conference calls are held when the annual (in March) and half-year (in September) results are released or at the time of any other significant event. In addition, conference calls are organised with financial analysts and institutional investors after the publication of quarterly revenue figures. In parallel, the Group’s management speaks at conferences and roadshows organised throughout the year by specialised financial intermediaries. Investors can also contact the Director of Investor Relations at any time.

Documents accessible to the public

Documents and information relating to the Company (in particular its by-laws and other corporate documents such as the Notice of meeting) and the 2022 consolidated financial statements may be consulted on the Company’s website (www.rubis.fr). The consolidated financial statements and the separate financial statements for 2022 and previous years are also available at the Company’s registered office, under the conditions provided for by law.

The Company’s press releases, the 2021 and subsequent Universal Registration Documents and the earlier Registration Documents filed with the French Financial Markets Authority (AMF), together with their updates, where applicable, are available on the Company’s website.

Presentations made by the Group at the time its annual and half-year results are published, as well as quarterly financial information (revenue for the first, third and fourth quarters) and presentations relating to strategy and CSR challenges can also be consulted on the Company’s website.

Regulated information is posted on the Company’s website for at least five years and on the website of the French Legal and Administrative Information Directorate (www.info-financiere.fr).

Finally, declarations on the crossing of thresholds are published on the AMF’s website (www.amf-france.org).

2023 financial agenda

4 May 2023 First-quarter 2023 revenue (after trading)
8 June 2023 Shareholders’ Meeting (2 p.m.)
7 September 2023 2023 half-yearly results (after trading)
7 November 2023 Third-quarter 2023 revenue (after trading)

Identity

Trade and Companies Register: 784 393 530 RCS Paris

LEI: 969500MGFIKUGLTC9742

APE code: 6420Z

ISIN code: FR0013269123

Listing venue: Euronext Paris

Main indices: CAC MID 60 and SBF 120

Contacts

Head office

Rubis

46, rue Boissière – 75116 Paris – France

+33 (0)1 44 17 95 95

rubis@rubis.fr

Investor relations

Clémence Mignot-Dupeyrot

Head of Investor Relations

+33 (0)1 45 01 87 44

investors@rubis.fr

Shareholder contact

Uptevia

Service Assemblées Générales

12 place des États-Unis

CS 40083

92549 Montrouge Cedex – France

Become a shareholder

ct-contact@uptevia.com

Shareholders’ Meetings

ct-assemblees@uptevia.com

Press relations

+33 (0)1 45 01 99 51

presse@rubis.fr

7. FINANCIAL STATEMENTS


7.1 2022 consolidated financial statements and notes

Consolidated balance sheet

ASSETS

(in thousands of euros)   Notes   31/12/2022   31/12/2021
Non-current assets            
Intangible assets   4.3   79,777   31,574
Goodwill   4.2   1,719,170   1,231,635
Property, plant and equipment   4.1.1   1,662,305   1,268,465
Property, plant and equipment – right-of-use assets   4.1.2   221,748   166,288
Interests in joint ventures   9   305,127   322,171
Other financial assets   4.5.1   204,636   132,482
Deferred tax   4.6   18,911   12,913
Other non-current assets   4.5.3   9,542   10,408
TOTAL NON-CURRENT ASSETS (I)       4,221,216   3,175,936
Current assets            
Inventory and work in progress   4.7   616,010   543,893
Trade and other receivables   4.5.4   770,421   622,478
Tax receivables       36,018   21,901
Other current assets   4.5.2   21,469   23,426
Cash and cash equivalents   4.5.5   804,907   874,890
TOTAL CURRENT ASSETS (II)       2,248,825   2,086,588
TOTAL ASSETS (I + II)       6,470,041   5,262,524


EQUITY AND LIABILITIES

(in thousands of euros)   Notes   31/12/2022   31/12/2021
Equity – Group share            
Share capital       128,692   128,177
Share premium       1,550,120   1,547,236
Retained earnings       1,054,652   941,249
TOTAL       2,733,464   2,616,662
NON-CONTROLLING INTERESTS       126,826   119,703
EQUITY (I)   4.8   2,860,290   2,736,365
Non-current liabilities            
Borrowings and financial debt   4.10.1   1,299,607   805,667
Lease liabilities   4.10.1   196,914   138,175
Deposit/consignment       148,588   138,828
Provisions for pensions and other employee benefit obligations   4.12   40,163   56,438
Other provisions   4.11   98,008   159,825
Deferred tax   4.6   92,480   63,071
Other non-current liabilities   4.10.3   94,509   3,214
TOTAL NON-CURRENT LIABILITIES (II)       1,970,269   1,365,218
Current liabilities            
Borrowings and short-term bank borrowings (portion due in less than one year)   4.10.1   791,501   507,521
Lease liabilities (portion due in less than one year)   4.10.1   27,735   23,742
Trade and other payables   4.10.4   781,742   601,605
Current tax liabilities       28,771   23,318
Other current liabilities   4.10.3   9,733   4,755
TOTAL CURRENT LIABILITIES (III)       1,639,482   1,160,941
TOTAL EQUITY AND LIABILITIES (I + II + III)       6,470,041   5,262,524


Consolidated income statement

(in thousands of euros)   Notes   Change   31/12/2022   31/12/2021
NET REVENUE   5.1   +55%   7,134,728   4,589,446
Consumed purchases   5.2       (5,690,380)   (3,319,645)
External expenses   5.4       (403,404)   (415,461)
Payroll expenses   5.3       (236,965)   (199,479)
Taxes           (134,485)   (122,564)
EBITDA       +26%   669,494   532,297
Other operating income           940   3,106
Net depreciation and provisions   5.5       (167,747)   (136,530)
Other operating income and expenses   5.6       6,327   (7,045)
EBIT       +30%   509,014   391,828
Other operating income and expenses   5.7       (58,136)   4,802
Operating income before share of net income from joint ventures       +14%   450,878   396,630
Share of net income from joint ventures   9       5,732   5,906
Operating income after share of net income from joint ventures       +13%   456,610   402,536
Income from cash and cash equivalents           11,868   9,645
Gross interest expense and cost of debt           (42,363)   (22,220)
Cost of net financial debt   5.8   +143%   (30,495)   (12,575)
Interest expense on lease liabilities           (10,234)   8,565
Other finance income and expenses   5.9       (80,116)   (11,456)
Profit (loss) before tax       -9%   335,765   369,940
Income tax   5.10       (63,862)   (65,201)
Net income       -11%   271,903   304,739
Net income, Group share       -10%   262,896   292,569
Net income, non-controlling interests       -26%   9,007   12,170
Earnings per share (in euros)   5.11   -10%   2.56   2.86
Diluted earnings per share (in euros)   5.11   -11%   2.55   2.86


Statement of other comprehensive income

(in thousands of euros)   31/12/2022   31/12/2021
TOTAL CONSOLIDATED NET INCOME (I)   271,903   304,739
Foreign exchange differences (excluding joint ventures)   (8,141)   47,748
Hedging instruments   39,732   4,715
Income tax on hedging instruments   (10,263)   (1,249)
Financial assets at fair value through comprehensive income   (14,020)   (11,642)
Restatements due to hyperinflation   2,787   3,333
Taxes on restatements due to hyperinflation   (1,177)   (1,034)
Items recyclable in P&L from joint ventures   10,818   1,916
Items that will subsequently be recycled in P&L (II)   19,736   43,787
Actuarial gains and losses   20,035   6,966
Income tax on actuarial gains and losses   (3,346)   (1,347)
Change in fair value of buyback option on non-controlling interests   (8,500)   -
Items not recyclable in P&L from joint ventures   307   350
Items that will not subsequently be recycled in P&L (III)   8,496   5,969
COMPREHENSIVE INCOME FOR THE PERIOD (I + II + III)   300,135   354,495
Share attributable to the owners of the Group’s parent company   289,852   341,390
Share attributable to non-controlling interests   10,283   13,105


Consolidated statement of changes in equity

CAPITAUX PROPRES AU 31 Shares
outstanding
Of which
treasury
shares
Share
capital
Share
premium
Treasury
shares
Consolidated
reserves and
earnings
Translation
differences
Shareholder’s
equity
attributable
to the owners
of the Group’s
parent
company
Non-
controlling
interests
Total
consolidated
equity
(in number of shares) (in thousands of euros)
EQUITY AS OF
31 DECEMBER 2020
103,630,677 58,087 129,538 1,593,902 (2,034) 1,012,305 (232,660) 2,501,051 119,282 2,620,333
Comprehensive income for the period           291,942 49,448 341,390 13,105 354,495
Change in interest                    
Share-based payments           4,386   4,386   4,386
Capital increase 3,044,687   3,806 101,327       105,133   105,133
Capital decrease (4,134,083)   (5,167) (147,993)       (153,160)   (153,160)
Treasury shares   15,035     85 (511)   (426)   (426)
Dividend payment           (181,715)   (181,715) (12,684) (194,399)
Other changes           3   3   3
EQUITY AS OF 31 DECEMBER 2021 102,541,281 73,122 128,177 1,547,236 (1,949) 1,126,410 (183,212) 2,616,662 119,703 2,736,365
Comprehensive income for the period           297,244 (7,392) 289,852 10,283 300,135
Change in interest           (3,437)   (3,437) 86,319 82,882
Buyback option on non-controlling interests*                 (81,800) (81,800)
Share-based payments           18,136   18,136 3,171 21,307
Capital increase 416,233   520 2,884       3,404 372 3,776
Capital decrease (3,948)   (5)         (5)   (5)
Treasury shares   11,865     (41) (39)   (80)   (80)
Dividend payment           (191,061)   (191,061) (11,219) (202,280)
Other changes           (7)   (7) (3) (10)
EQUITY AS OF
31 DECEMBER 2022
102,953,566 84,987 128,692 1,550,120 (1,990) 1,247,246 (190,604) 2,733,464 126,826 2,860,290

* The impact of changes in the scope of consolidation is described in note 3.

Consolidated statement of cash flows

(in thousands of euros)   31/12/2022   31/12/2021
TOTAL CONSOLIDATED NET INCOME FROM CONTINUING OPERATIONS   271,903   304,739
Adjustments:        
Elimination of income of joint ventures   (5,732)   (5,906)
Elimination of depreciation and provisions   100,928   163,201
Elimination of profit and loss from disposals   84   (599)
Elimination of dividend earnings   (190)   (91)
Other income and expenditure with no impact on cash and cash equivalents(1)   65,270   3,468
CASH FLOW AFTER COST OF NET FINANCIAL DEBT AND INCOME TAX   432,263   464,812
Elimination of income tax expenses   63,862   65,201
Elimination of the cost of net financial debt and interest expense on lease liabilities   40,729   21,140
CASH FLOW BEFORE COST OF NET FINANCIAL DEBT AND INCOME TAX   536,854   551,153
Impact of change in working capital*   (31,353)   (214,456)
Income tax paid   (84,543)   (42,039)
CASH FLOWS RELATED TO OPERATING ACTIVITIES   420,958   294,658
Impact of changes to consolidation scope (cash acquired – cash disposed)   57,031   -
Acquisition of financial assets: Retail & Marketing division   -   (83,985)
Acquisition of financial assets: Renewable Electricity Production division(2)   (341,122)   -
Disposal of financial assets: Retail & Marketing division   -   3,463
Acquisition of property, plant and equipment and intangible assets   (258,416)   (205,682)
Change in loans and advances granted   (451)   (1,653)
Disposal of property, plant and equipment and intangible assets   5,942   8,733
(Acquisition)/disposal of other financial assets   (2,779)   (157)
Dividends received   34,609   20,298
Other cash flows from investing activities(3)   4,063   -
CASH FLOWS RELATED TO INVESTING ACTIVITIES   (501,123)   (258,983)


Consolidated statement of cash flows (continued)

(in thousands of euros)   Notes   31/12/2022   31/12/2021
Capital increase   4.8   3,404   6,995
Share buyback (capital decrease)   4.8   (5)   (153,160)
(Acquisition)/disposal of treasury shares       (41)   85
Borrowings issued   4.10.1   1,191,102   730,694
Borrowings repaid   4.10.1   (847,812)   (677,276)
Repayment of lease liabilities   4.10.1   (33,180)   (40,827)
Net interest paid(4)       (38,908)   (20,923)
Dividends payable       (191,061)   (83,577)
Dividends payable to non-controlling interests       (11,303)   (13,191)
Acquisition of financial assets: Renewable Electricity Production division       (5,306)    
Other cash flows from financing operations(2)       (41,975)    
CASH FLOWS RELATED TO FINANCING ACTIVITIES       24,915   (251,180)
Impact of exchange rate changes       (14,733)   8,811
CHANGE IN CASH AND CASH EQUIVALENTS       (69,983)   (206,694)
Cash flows from continuing operations            
Opening cash and cash equivalents(5)   4.5.5   874,890   1,081,584
Change in cash and cash equivalents       (69,983)   (206,694)
Closing cash and cash equivalents(5)   4.5.5   804,907   874,890
Financial debt excluding lease liabilities   4.10.1   (2,091,108)   (1,313,188)
Cash and cash equivalents net of financial debt       (1,286,201)   (438,298)
(1) Including change in fair value of financial instruments, IFRS 2 expense, goodwill (impairment), etc.
(2) The impact of changes in the scope of consolidation is described in note 3.
(3) See note 5.7.
(4) Net financial interest paid includes the impacts related to restatements of leases (IFRS 16).
(5) Cash and cash equivalents net of bank overdrafts.
* Breakdown of the impact of change in working capital       31/12/2022   31/12/2021
Impact of change in inventories and work in progress   4.7   (77,342)   (205,280)
Impact of change in trade and other receivables   4.5.4   (142,683)   (150,960)
Impact of change in trade and other payables   4.10.4   188,672   141,784
Impact of change in working capital       (31,353)   (214,456)


Notes to the consolidated financial statements for the year ended 31 December 2022

Note 1.   General

1.1   Annual financial information

The financial statements for the year ended 31 December 2022 were finalised by the Management Board on 15 March 2023 and approved by the Supervisory Board on 16 March 2023.

The 2022 consolidated financial statements have been prepared in accordance with the international accounting standards issued by the IASB (International Accounting Standards Board) and adopted by the European Union. These standards include IFRS (International Financial Reporting Standards) and IAS (International Accounting Standards), as well as the interpretations of the IFRS Interpretations Committee.

1.2   Overview of the Group’s activities

Rubis SCA (hereinafter “the Company” or, together with its subsidiaries, “the Group”) is a Partnership Limited by Shares registered and domiciled in France. Its registered office is located at 46, rue Boissière 75116 Paris, France.

The Rubis Group operates three businesses in the energy sector:

•   the Retail & Marketing activity, which specialises in the distribution of fuels (in service stations or to professionals), lubricants, liquefied gas and bitumen;

•   the Support & Services activity, which houses all infrastructure, transport, supply and services activities that support the development of downstream distribution and marketing activities;

•   the Renewable Electricity Production division (Rubis Renouvelables), developed since April 2022 with the acquisition of 80% of Photosol, one of the main independent producers of photovoltaic electricity in France.

Since 30 April 2020, the Rubis Terminal activity has been consolidated in the Group’s financial statements using the equity method. The Rubis Terminal joint venture (hereinafter “Rubis Terminal”) specialises in the Bulk Liquid Storage of products (fuels, chemicals and agrifood products) for commercial and industrial customers.

The Group is present in Europe, Africa and the Caribbean.

Note 2.   Accounting policies

2.1   Basis of preparation

The consolidated financial statements are prepared based on historical costs with the exception of certain categories of assets and liabilities, in accordance with IFRS rules. The categories concerned are specified in the notes below.

To prepare its financial statements, the Group’s Management must make estimates and assumptions that affect the carrying amount of assets and liabilities, income and expenses, and the data disclosed in the notes to the financial statements.

The Group’s Management makes these estimates and assessments on an ongoing basis according to past experience as well as various factors that are deemed reasonable and that constitute the basis for these assessments.

The amounts that will appear in its future financial statements may differ from these estimates, in accordance with changes in these assumptions or different conditions.

The main estimates made by Group Management relate, in particular, to the fair values of assets and liabilities acquired in business combinations, the recoverable value of goodwill, intangible assets and property, plant and equipment, and the measurement of employee benefit obligations (including share-based payments), the measurement of other provisions and leases (lease term used and borrowing rates, described in note 4.1.2).

The consolidated financial statements for the year ended 31 December 2022 include the financial statements of Rubis SCA and its subsidiaries.

The financial statements of foreign subsidiaries are prepared in their functional currency.

The results and financial position of Group subsidiaries whose functional currency differs from the reporting currency (i.e., the euro) and is not the currency of an economy in hyperinflation, are translated according to the following principles:

•   assets and liabilities are translated at the exchange rate prevailing as of the reporting date;

•   income and expenses are translated at the average exchange rate for the period;

•   these exchange differences are recognised in other comprehensive income, under “Foreign exchange reserves”;

•   cumulative translation differences are reclassified to profit or loss in the event of the disposal or liquidation of the equity interest to which they relate.

Goodwill and fair value adjustments arising on the acquisition of a foreign entity are treated as assets and liabilities of the foreign entity and translated at the exchange rates prevailing as of the balance sheet date.

Since 2021, Suriname has been a hyperinflationary country. The impacts of hyperinflation in this country were not material across the Group over the financial year.

All significant transactions conducted between consolidated companies as well as internal profits are eliminated.

Foreign exchange differences arising from the elimination of transactions and transfers of funds denominated in foreign currencies between consolidated companies, are subject to the following accounting treatment:

•   foreign exchange differences arising from the elimination of internal transactions are recorded as “Translation differences” in equity and as “Non-controlling interests” for the portion attributable to third parties, thereby offsetting their impact on consolidated income;

•   foreign exchange differences on fund movements for reciprocal financing are classified under a separate heading in the consolidated statement of cash flows.

The consolidated financial statements are denominated in euros and the financial statements are presented in thousands of euros.

2.2   Accounting standards applied

STANDARDS, INTERPRETATIONS AND AMENDMENTS APPLICABLE AS OF 1ST JANUARY 2022

The following standards, interpretations and amendments, published in the Official Journal of the European Union as of the reporting date, were applied for the first time in 2022:

Standard/Interpretation       Date of mandatory
application
Amendments to IAS 16   Proceeds before intended use   1st January 2022
Amendments to IAS 37   Onerous contracts – costs of fulfilling a contract   1st January 2022
Amendments to IFRS 3   Reference to the conceptual framework   1st January 2022
Annual improvements (2018-2020 cycle) to IFRS   Relevant standards: IFRS 1, IFRS 9, IFRS 16 and IAS 41   1st January 2022

The first-time application of these standards, interpretations and amendments did not have a material impact on the Group’s financial statements.

STANDARDS, INTERPRETATIONS AND AMENDMENTS FOR WHICH EARLY APPLICATION MAY BE CHOSEN

The Group has not opted for the early adoption of the standards, interpretations and amendments whose application is not mandatory as of 31 December 2022 or which have not yet been adopted by the European Union.

SPECIFIC INFORMATION ON THE CONSEQUENCES OF THE CONFLICT BETWEEN UKRAINE AND RUSSIA AND THE MACROECONOMIC ENVIRONMENT

The Group does not carry out any transactions in Ukraine or Russia and has no assets in this territory. In addition, it does not source from Ukrainian or Russian suppliers. To date, the Group has not identified any direct exposure to this risk.

In an uncertain geopolitical and economic context, the financial statements are impacted by global inflationary pressures, leading, through the actions of central banks to control inflation expectations, to a sharp rise in interest rates in 2022, with the following main consequences:

•   an increase in the weighted average cost of capital used for impairment testing on goodwill (see note 4.2);

•   an increase in the fair value of the financial instruments used by the Group to hedge its variable-rate debt (see note 4.5);

•   an increase in the actual discount rates for the actuarial assumptions used for employee benefit obligations, mainly explaining the decrease in employee benefit obligations in 2022 (see note 4.12).

Note 3. Scope of consolidation

Accounting policies

The Group applies IFRS 10, 11 and 12, as well as amended IAS 28, on the scope of consolidation.

Full consolidation

All companies in which Rubis exercises control, i.e., in which it has the power to influence the financial and operating policies in order to obtain benefits from their activities, are fully consolidated.

Control as defined by IFRS 10 is based on the following three criteria that must be met simultaneously in order to determine the exercise of control by the parent company:

•    the parent company has power over the subsidiary when it has effective rights that give it the ability to direct the relevant activities, i.e., activities that have a significant impact on the subsidiary’s returns. Power may be derived from voting rights (existing and/or potential) and/or contractual arrangements. The assessment of power depends on the nature of the relevant activities of the subsidiary, the decision-making process within it and the breakdown of the rights of its other shareholders;

•    the parent company is exposed or entitled to variable returns due to its ties with the subsidiary, which may vary depending on its performance;

•    the parent company has the ability to exercise its power to influence returns.

Joint arrangements

In a joint arrangement, the parties are bound by a contractual agreement giving them joint control of the Company. Joint control is deemed to exist when decisions regarding the relevant activities require the unanimous consent of the parties that collectively control the business.

Joint arrangements are classified in one of two categories:

•    joint operations: these are partnerships in which the parties exercising joint control over the business have direct rights to the assets and obligations for related liabilities, of the business. Joint operations are accounted for according to the percentage interest held by the Group in the assets and liabilities of each joint operation;

•    joint ventures: these are partnerships in which the parties exercising joint control over the business have rights to the net assets of the enterprise. The Group accounts for its joint ventures using the equity method, in accordance with IAS 28.

3.1   Scope of consolidation

The consolidated financial statements for the year ended 31 December 2022 include the Rubis SCA financial statements and those of its subsidiaries listed in note 12.

3.2   Changes in the scope of consolidation

The changes in the scope of consolidation concerned business combinations as defined by IFRS 3 and the acquisition of groups of assets.

Only the most material transactions are set out below.

ACQUISITION OF PHOTOSOL FRANCE

On 14 April 2022, Rubis completed the acquisition of 80% of Photosol (France), one of the independent leaders in photovoltaic energy in France. This acquisition creates the foundation for the development of the Group’s activities in renewable energies alongside its historical Energy Distribution activities via Rubis Énergie and its subsidiaries (Retail & Marketing and Support & Services) and Bulk Liquid Storage via the Rubis Terminal JV.

Photosol (France) is one of the main independent producers of renewable electricity in France, with a capacity of 384 MWp in operation, 119 MWp under construction and a project portfolio of over 3.5 GWp as of end-December 2022, and has 112 employees in France. Retaining a 20% stake, Photosol’s founders and Senior Managers remain committed to the development of the company.

The transaction meets the definition of a business combination as provided for in IFRS 3 “Business combinations” and has been recognised in the consolidated financial statements since 1st April 2022 (the date difference having no material impact as of 31 December 2022).

Rubis disbursed an amount of €341 million. The acquisition price of the Photosol securities on a 100% basis is €439 million. In addition, Rubis repaid a current account held by the founders in one of the Photosol entities for €42 million.

IDENTIFIABLE ASSETS ACQUIRED AND LIABILITIES ASSUMED

The following table summarises the assets acquired and liabilities assumed recognised on a provisional basis at the acquisition date:

Contribution at the date of consolidation on a 100% base (in thousands of euros)   01/04/2022
Fixed assets (including right-of-use assets)   414,888
Other financial assets   31,770
Inventories   1,428
Trade receivables, other receivables and other assets   26,818
Identified assets   474,904
Net financial debt (including lease liabilities)   (441,976)
Non-controlling interests   11,017
Provisions   (9,496)
Deferred tax liabilities   (18,718)
Current account liabilities   (42,347)
Trade payables, other payables and other liabilities   (74,966)
Liabilities assumed   (576,486)
Net assets acquired on a 100% base   (101,582)

The Group has identified the identifiable assets acquired and liabilities assumed at the transaction date. The main elements recognised as part of the business combination are:

•   an intangible asset of €40 million recognised in respect of long-term electricity purchase contracts concluded at a contractual fixed price with electricity distributors This intangible asset was measured at fair value using the direct intrinsic approach (the DCF method);

•   interest rate hedging derivatives measured at fair value and recorded in “Other financial assets” for €27 million.

The amounts described above have been valued on a provisional basis and reflect the preliminary results of the valuation work carried out by Rubis with the assistance of an independent valuation expert.

GOODWILL

In accordance with IFRS 3, the Group may measure non-controlling interests either at fair value (full goodwill method) or at the portion in the net identifiable assets of the acquired company (partial goodwill method). The Group has opted for the full goodwill method for the Photosol acquisition. Goodwill amounts to €541 million and mainly corresponds to the Group’s ability to complete the portfolio of projects identified at the acquisition date.

Non-controlling interests amounted to €87 million as of 1st April 2022.

BUYBACK OPTION ON NON-CONTROLLING INTERESTS

Finally, as part of the transaction, the Group (via its subsidiary Rubis Renouvelables) has undertaken to buy back all the ordinary shares held by the founders in two stages: 50% in 2027 and 50% in 2028. This buyback option is recognised as a liability based on the discounted future purchase price of the Rubis Photosol shares at the end of December 2026 and the end of December 2027 (enterprise value – net financial debt). The fair value thus determined at the acquisition date amounts to €82 million recognised in “Other non-current liabilities”, with a corresponding decrease in non-controlling interests presented in total equity.

The Photosol Group contributed to the Group’s earnings from 1st April 2022

Contribution to net income (in thousands of euros)   31/12/2022
(9 months)
Revenue   32,558
EBITDA   17,717
EBIT   (849)
Other operating income and expenses*   (22,475)
Cost of net financial debt   (7,297)
Corporate income tax   2,826
Total net income   (25,860)
Net income, Group share   (20,444)

* Mainly related to the acquisition.

Note 4.    Notes to the balance sheet

4.1   Property, plant and equipment and right-of-use assets

4.1.1    PROPERTY, PLANT AND EQUIPMENT

Accounting policies

The gross amount of property, plant and equipment corresponds to its acquisition cost.

Maintenance and repair costs are recorded as expenses as soon as they are incurred, except for those incurred to extend the useful life of the asset, in particular during shutdowns for major maintenance, which are then recorded as non-current assets and depreciated over the period between two shutdowns.

Depreciation is calculated according to the straight-line method for the estimated useful life of the various categories of non-current assets, as follows:

    Duration
Buildings   10 to 40 years
Technical facilities   10 to 20 years
Equipment and tools   5 to 30 years
Transport equipment   4 to 5 years
Facilities and fixtures   10 years
Office equipment and furniture   5 to 10 years

The depreciation periods result from the different types of property, plant and equipment within the various activities, in particular buildings, complex facilities and equipment or tooling.

Borrowing costs are included in non-current asset costs when significant.

As of 31 December 2022, no indication of impairment was identified.

Gross value
(in thousands of euros)
31/12/2021 Change
in scope
Acquisitions Disposals Reclassifications Translation
differences
31/12/2022
Other property, plant and equipment 313,136 1,566 21,132 (4,511) 7,942 (3,829) 335,436
Prepayments and down payments on property, plant and equipment 4,687   2,856 (2,432) (1,534) (56) 3,521
Assets in progress 177,842 71,028 106,569 (156) (137,293) (1,131) 216,859
Machinery, equipment and tools 1,779,667 165 76,180 (32,595) 65,834 19,772 1,909,023
Land and buildings 585,930 332,251 17,401 (3,518) 56,490 (8,459) 980,095
TOTAL 2,861,262 405,010 224,138 (43,212) (8,561) 6,297 3,444,934
Depreciation
(in thousands of euros)
31/12/2021 Change
in scope
Increases Disposals Reclassifications Translation
differences
31/12/2022
Other property, plant and equipment (165,125) (512) (16,392) 3,923 108 2,521 (175,477)
Facilities and equipment (1,159,066) (55) (84,321) 30,170 (58) (12,452) (1,225,782)
Land and buildings (268,606) (87,598) (28,584) 2,790 (832) 1,460 (381,370)
TOTAL (1,592,797) (88,165) (129,297) 36,883 (782) (8,471) (1,782,629)
NET VALUE 1,268,465 316,845 94,841 (6,329) (9,343) (2,174) 1,662,305

Changes in scope mainly relate to the acquisition of Photosol.

4.1.2   RIGHT-OF-USE ASSETS (IFRS 16)

Accounting policies

IFRS 16 defines the right of use conveyed by a lease as an asset which represents the lessee’s right to use the underlying asset for a given period. This right-of-use asset is recognised by the Group as of the effective date of the lease (when the asset becomes available for use).

The Group adopted the following exemptions under the standard:

•    leases with a term of less than 12 months did not give rise to the recognition of an asset or liability;

•    leases related to low-value assets were excluded.

The discount rates used to value rights of use were determined based on the incremental borrowing rate for the business segment in which the Group operates, plus a spread to reflect the specific economic environments of each country. These rates are defined according to the asset’s useful life.

The right-of-use asset is measured at cost, which includes:

•    the initial amount of the lease liability;

•    the advance payments made to the lessor, net of any benefits received from the lessor;

•    the significant initial direct costs incurred by the lessee for the conclusion of the lease, i.e., the costs that would not have been incurred if the lease had not been entered into;

•    the estimated cost of any dismantling or restoration of the leased asset in accordance with the terms of the lease, where appropriate.

The depreciation is booked on a straight-line basis over the term of the lease and is recognised as an expense in the income statement. The right-of-use asset is impaired if there is any indication of loss in value.

The lease term is the non-cancellable period during which the lessee has the right to use the underlying asset, after taking into account any renewal or termination options that the lessee is reasonably certain to exercise.

Non-current assets financed by finance leases are presented as assets under “Right-of-use assets”. The corresponding liability is recognised as a “Lease liability”.

Gross value
(in thousands of euros)
31/12/2021 Change
in scope
Acquisitions Disposals Translation
differences
31/12/2022
Other property, plant and equipment 904 9 253 (2) 4 1,168
Transport equipment 42,847 51 16,580 (22,395) 1,874 38,957
Machinery, equipment and tools 17,887   6,580   (1,665) 22,802
Land and buildings 181,419 51,300 18,935 (4,517) (3,265) 243,872
TOTAL 243,057 51,360 42,348 (26,914) (3,052) 306,799
Depreciation
(in thousands of euros)
31/12/2021 Change
in scope
Increases Disposals Translation
differences
31/12/2022
Other property, plant and equipment (207)   (239) 2 (1) (445)
Transport equipment (27,575)   (12,221) 22,290 (1,301) (18,807)
Machinery, equipment and tools (7,327)   (2,412)   290 (9,449)
Land and buildings (41,660)   (18,400) 1,841 1,869 (56,350)
TOTAL (76,769)   (33,272) 24,133 857 (85,051)
NET VALUE 166,288 51,360 9,076 (2,781) (2,195) 221,748

Changes in scope mainly relate to the acquisition of Photosol.

4.2   Goodwill

Accounting policies

Business combinations prior to 1st January 2010

Business combinations carried out prior to 1st January 2010 have been recognised according to IFRS 3 unrevised, applicable from that date. These combinations have not been restated, as revised IFRS 3 must be applied prospectively.

On first consolidation of a wholly controlled company, the assets, liabilities and contingent liabilities have been valued at their fair value in accordance with IFRS requirements. Valuation discrepancies generated at that time have been recorded in the relevant asset and liability accounts, including the non-controlling interests’ share, rather than solely for the proportion of securities acquired. The difference between the acquisition cost and the acquirer’s share of the fair value of the identifiable net assets in the acquired company is recognised in goodwill if positive and charged to income under “Other operating income and expenses” if negative (badwill).

Business combinations subsequent to 1st January 2010

IFRS 3 revised and IAS 27 amended modified the accounting policies applicable to business combinations carried out after 1st January 2010.

The main changes with an impact on the Group’s consolidated financial statements are:

•    recognition of direct acquisition expenses;

•    revaluation at fair value through profit and loss of interests held prior to the controlling interest, in the case of an acquisition via successive securities purchases;

•    the possibility of valuing non-controlling interests either at fair value or as a proportional share of identifiable net assets, on a case-by-case basis;

•    recognition at fair value of earn-out payments on the takeover date, with any potential adjustments being recognised in profit and loss if they take place beyond the assignment deadline;

•    adjustments of the price recorded on acquisitions made by the Group are presented in cash flows from investing activities on the same basis as the initial price.

In accordance with the acquisition method, on the date of takeover, the Group recognises the identifiable assets acquired and liabilities assumed at fair value. It then has a maximum of 12 months with effect from the acquisition date to finalise recognition of the business combination in question. Beyond this deadline, adjustments of fair value of assets acquired and liabilities assumed are recognised directly in the income statement.

Goodwill is determined as the difference between (i) the transferred counterpart (mainly the acquisition price and any earn-out payment excluding acquisition expenses) and the total non-controlling interests, and (ii) the fair value of assets acquired and liabilities assumed. When positive, this difference is recognised as an asset in the consolidated balance sheet or, when negative (badwill), under “Other operating income and expenses”.

After the adoption of the revised IFRS 3, an option exists for the measurement of non-controlling interests as of the acquisition date: either at the fraction they represent of the net assets acquired (the partial goodwill method) or at fair value (the full goodwill method). The option is available on a case-by-case basis for each business combination.

For the purpose of allocating goodwill generated during the various business combinations, the groups of cash-generating units (CGUs) used by Rubis are:

•    the Retail & Marketing activity (Europe);

•    the Retail & Marketing activity (Africa);

•    the Retail & Marketing activity (Caribbean);

•    the Support & Services activity;

•    the Photovoltaic Electricity Production activity.

This allocation was calculated based on the General Management’s organisation of Group operations and the internal reporting system, enabling not only business oversight, but also monitoring of the return on capital employed, i.e., the level at which goodwill is monitored for internal management purposes.

Goodwill impairment

Goodwill is subject to an impairment test at least once per year, or more frequently if there are indications of a loss in value, in accordance with the requirements of IAS 36 “Impairment of assets”. Annual tests are performed during the fourth quarter.

Impairment testing consists of comparing the recoverable value and the net carrying amount of the CGU or group of CGUs, including goodwill. A CGU is a uniform set of assets (or group of assets) whose continued use generates cash inflows that are largely independent of cash inflows generated by other groups of assets.

The recoverable value is the greater of the fair value less costs of disposal and value in use.

Value in use is determined on the basis of discounted future cash flows.

The fair value minus disposal costs corresponds to the amount that could be obtained from the disposal of the asset (or group of assets) under normal market conditions, minus the costs directly incurred to dispose of it.

When the recoverable value is lower than the net carrying amount of the asset (or group of assets), an impairment, corresponding to the difference, is recorded in the income statement and is charged primarily against goodwill.

These impairments of goodwill are irreversible.

(in thousands of euros) 31/12/2021 Change
in scope
Translation
differences
Impairment 31/12/2022
Retail & Marketing activity (Europe) 274,943   3,121   278,064
Retail & Marketing activity (Africa) 531,474   (8,026)   523,448
Retail & Marketing activity (Caribbean) 313,970   (9,376) (40,000) 264,594
Support & Services activity 111,248   906   112,154
Photovoltaic Electricity Production activity   540,910     540,910
GOODWILL 1,231,635 540,910 (13,375) (40,000) 1,719,170

Changes in scope correspond to the acquisition of Photosol.

Impairment testing as of 31 December 2022

Recoverable amounts are based on the value in use calculation.

For the Retail & Marketing activity:

•   value in use calculations are based on cash flow forecasts using the financial budgets, for the financial year 2023, and medium-term forecasts approved by Management at the reporting date. The forecast period used by management is generally three years. In rare cases, the Group has identified circumstances that require the consideration of longer periods. In East Africa, the duration of the business plans has been extended to six years to take into account the timeframe required, following the global Covid-related pandemic, to complete the renovation of the network acquired in 2019. Similarly, in Haiti, the economic, political and security context led management to extend the duration of the business plan to six years;

•   the main assumptions made concern volumes processed and unit margins. Cash flows are extrapolated by generally applying a growth rate of 2%.

For the Photovoltaic Electricity Production activity:

•   the value in use is based on cash flow projections over a period of 35 years, based on the business plan prepared by management, including the SPVs in operation and the portfolio of existing and future projects;

•   the main assumptions are the electricity resale price, discount rates and the Company’s ability to generate new projects.

The discount rate used, based on the concept of weighted average cost of capital (WACC), reflects current market assessments of the time value of money, and the specific risks inherent in each CGU or group of CGUs.

The following weighted discount rates are used:

CGU Group   2022 rate   2021 rate
Retail & Marketing activity (Europe)   5.7%   4.6%
Retail & Marketing activity (Africa)   12.0%   9.2%
Retail & Marketing activity (Caribbean)   10.3%   7.6%
Support & Services activity    12.1%   6.5%
Photovoltaic Electricity Production activity   8.5%    

The discount rates presented were determined by using the 2023 EBITDA of each country as the basis for the weighting for the CGU.

An impairment of €40 million was recognised as of 31 December 2022 reflecting the operational difficulties encountered by the Group in Haiti, given the political, economic and security environment in the country, which affects all business sectors. The recoverable value as of 31 December 2022 was determined on the basis of value in use. Value in use is based on expected cash flows. Given the current situation and the related uncertainties, the business plan period has been extended to six years and the cash flows have been discounted at a rate of 17.4%. A one-year lag in cash flow projections, without any change in financial assumptions, would have an impact of around €15 million on the amount of the impairment. In addition, a 1 point increase in the discount rate and a 1 point decrease in the growth rate would have an impact of €10 million and €5 million respectively on the amount of the impairment.

Sensitivity of recoverable values as of 31 December 2022

For the Retail & Marketing activity, excluding the Haiti CGU, a 1-point increase in the discount rate or a 1-point reduction in the growth rate would not result in the impairment of goodwill as of 31 December 2022.

Similarly, a 5% reduction in discounted future cash flows would not call into question the findings of the tests as of 31 December 2022.

For the Photovoltaic Electricity Production activity, analyses of sensitivity to price curves and to the discount rate exclude the risk of impairment of the Photosol goodwill as of 31 December 2022.

4.3     Intangible assets

Accounting policies

Intangible assets are accounted for at their acquisition cost.

Intangible assets with a finite useful life are amortised according to the straight-line method for the periods corresponding to their expected useful lives and are subject to an impairment test whenever events or changes in circumstances indicate that their carrying amounts may not be recoverable.

In accordance with IFRS 15, the costs of obtaining contracts related to LPG distribution in France are capitalised as “Other intangible assets” and depreciated over the average useful life of the corresponding contracts (10 years).

An intangible asset resulting from development (or the development phase of an internal project) may be recognised if, and only if, the criteria defined by IAS 38.57 are met. For the Renewable Electricity Production division, development costs, direct and indirect, external or internal, are capitalised when the success of the corresponding projects is probable and the other criteria of IAS 38 are met. The Group considers that these criteria are met when a project falls within the development portfolio, i.e., when the contractual elements and technical studies indicate that the feasibility of a project is probable. When the conditions for the recognition of an internally generated asset are not met, project development expenses are recognised as expenses in the financial year in which they are incurred. The capitalisation of costs ends at the start-up of the plant’s operations.

In accordance with IAS 36 “Impairment of assets”, the Group examines whether there is an indication of impairment of intangible assets with a finite useful life and intangible assets in progress at the end of each reporting period. If such indications exist, the Group performs an impairment test to assess whether the carrying amount of the asset is higher than its recoverable value, defined as the higher of the fair value less transaction costs and value in use.

As of 31 December 2022, no indication of impairment was identified.

Gross value
(in thousands of euros)
31/12/2021 Change
in scope
Acquisitions Disposals Reclassifications Translation
differences
31/12/2022
Other concessions, patents, similar rights and development costs 26,437 5,908 3,659 (190) (511) (176) 35,127
Leases 2,404     (80)   (95) 2,229
Other intangible assets 32,161 41,320 3,768 (303) 149 89 77,184
TOTAL 61,002 47,228 7,427 (573) (362) (182) 114,540
               
Amortisation
(in thousands of euros)
31/12/2021 Change
in scope
Increases Disposals Reclassifications Translation
differences
31/12/2022
Other concessions, patents and similar rights (12,655) (221) (1,270) 42 9 228 (13,867)
Other intangible assets (16,773) (324) (4,048) 303   (54) (20,896)
TOTAL (29,428) (545) (5,318) 345 9 174 (34,763)
NET VALUE 31,574 46,683 2,109 (228) (353) (8) 79,777

Changes in scope mainly relate to the acquisition of Photosol.

At the time of the acquisition of Photosol (France), the Group recognised, in accordance with IFRS 3, the following intangible assets:

•   development costs of €5.9 million: concern expenses related to the development of renewable energy production projects, an activity carried out by Rubis Renouvelables;

•   an intangible asset of €40 million recognised in respect of long-term electricity purchase contracts concluded at a contractual fixed price with electricity distributors.

4.4      Interests in affiliates

Information about non-controlling interests, interests in joint operations and in joint ventures is given in notes 7 to 9.

4.5      Financial assets

Accounting policies

Financial assets are recognised and measured in accordance with IFRS 9 “Financial instruments”.

Classification and measurement

Financial assets are recognised in the Group balance sheet when the Group is a party to the instrument’s contractual provisions.

The classification proposed by IFRS 9 determines how assets are accounted for and the method used to measure them. Financial assets are classified based on two cumulative criteria: the management model applied to the asset and the characteristics of its contractual cash flows.

Based on the combined analysis of the two criteria, IFRS 9 distinguishes between three categories of financial assets, with measurement and accounting treatments specific to each category:

  the financial assets are measured at amortised cost; or

  the financial assets are measured at fair value through other comprehensive income; or

  financial assets at fair value through profit or loss

Financial assets at amortised cost mainly include bonds and negotiable debt securities, loans and receivables.

Financial assets at fair value through other comprehensive income mainly include equity securities, previously classified as securities held for sale.

Financial assets at fair value through profit or loss include cash, Sicav and other funds.

The Group used the fair value hierarchy in IFRS 7 to determine the classification level of the financial assets:

  level 1: quoted prices in active markets for identical assets or liabilities;

  level 2: use of data other than the quoted prices listed in level 1, which are observable for the assets or liabilities in question, either directly or indirectly;

  level 3: use of data relating to the asset or liability which are not based on observable market data.

Impairment of financial assets

IFRS 9 introduces an impairment model based on expected losses.

Measurement and recognition of derivative instruments

The Group uses derivative financial instruments to manage its exposure to fluctuations in interest rates, foreign exchange rates and raw material prices. The Group’s hedging policy includes the use of swaps, caps and floors. The derivative instruments used by the Group are valued at their fair value. Unless otherwise specified below, changes in the fair value of derivatives are always recorded in the income statement.

Derivative instruments may be designated as hedging instruments in a fair value or future cash flow hedging relationship:

  a fair value hedge protects the Group against the risk of changes in the value of any asset or liability, resulting from foreign exchange rate fluctuations;

  a future cash flow hedge protects the Group against changes in the value of future cash flows relating to existing or future assets or liabilities.

The Group only applies cash flow hedges.

Hedge accounting is applicable if:

  the hedging relationship is clearly defined and documented at the date it is set up;

  the hedging relationship’s effectiveness is demonstrated from the outset and throughout its duration.

As a consequence of the use of hedge accounting of cash flows, the effective portion of the change in fair value of the hedging instrument is recorded directly in other comprehensive income. The change in value of the ineffective portion is recorded in the income statement under “Other finance income and expenses”. The amounts recorded in other comprehensive income are recycled in the income statement during the periods when the hedged cash flows impact profit and loss.

Breakdown of financial assets by class (IFRS 7) and by category (IFRS 9)       Value on balance sheet   Fair value
(in thousands of euros)   Note   31/12/2022   31/12/2021   31/12/2022   31/12/2021
At amortised cost       846,658   692,071   846,658   692,071
Other receivables from interests (long term)   4.5.1   17,711   18,550   17,711   18,550
Loans, deposits and guarantees (long term)   4.5.1   47,847   39,641   47,847   39,641
Loans, deposits and guarantees (short term)   4.5.2   1,137   994   1,137   994
Trade and other receivables   4.5.4   770,421   622,478   770,421   622,478
Other non-current assets   4.5.3   9,542   10,408   9,542   10,408
Fair value through other comprehensive income       139,524   78,260   139,524   78,260
Equity interests   4.5.1   63,308   74,291   63,308   74,291
Non-current derivatives   4.5.1   75,770       75,770    
Current derivatives   4.5.2   446   3,969   446   3,969
Fair value through profit or loss       804,907   874,890   804,907   874,890
Cash and cash equivalents   4.5.5   804,907   874,890   804,907   874,890
TOTAL FINANCIAL ASSETS       1,791,089   1,645,221   1, 791,089   1,645,221

Fair value of financial instruments by level (IFRS 7)

Equity interests in Hydrogène de France, a listed company, are in level 1.

Unlisted equity interests and other available-for-sale financial assets are considered to be level 3 (non-observable data).

The fair value of derivative instruments is determined using valuation models based on observable data (level 2).

Cash and cash equivalents are detailed in note 4.5.5. They are classified as level 1, with the exception of term deposits in the amount of €40 million, which are considered as level 2.

4.5.1    NON-CURRENT FINANCIAL ASSETS

Other financial assets notably include equity interests, other receivables from investments (more than one year), long-term securities, long-term loans, long-term deposits and guarantees, and long-term marketable securities that are not considered cash or cash equivalents.

Gross value
(in thousands of euros)
  31/12/2022   31/12/2021
Equity interests   92,565   89,511
Other receivables from investments   17,711   18,550
Loans, deposits and guarantees   49,455   41,289
Fair value of financial instruments   75,770    
TOTAL OTHER FINANCIAL ASSETS   235,501   149,350
Impairment   (30,865)   (16,868)
NET VALUE   204,636   132,482

Equity interests in non-controlled entities correspond mainly to:

•   18.5% equity interest in Hydrogène de France (HDF Energy) subscribed in 2021 for a total amount of €78.6 million;

•   non-controlling interests held by Rubis Energia Portugal in several entities in Portugal;

•   non-controlling interests held by the SARA refinery in diversification projects;

•   shares of the EIG held by Rubis Antilles Guyane.

Other receivables from investments mainly include advances made to EIGs or joint ventures.

Loans, deposits and guarantees paid correspond to the €31 million loan in USD, repayable in 2025, granted by the subsidiary RWIL Suriname to the State of Suriname. The other items recorded in this account mainly correspond to advances made to certain distributors working for the Group, security deposits provided for in certain long-term leases and other security deposits.

Impairments include €25.7 million for the impact of the fair value measurement of the interest in HDF Energy due to the decline in its share price compared to the initial subscription price. The contra-entry is recognised in other comprehensive income.

The change in the fair value of financial instruments is due for €62 million to the consolidation of Photosol (France), i.e., €26 million at the date of consolidation and €36 million in respect of revaluations made on 31 December 2022.

4.5.2    OTHER CURRENT ASSETS

Current financial assets include the portion due in less than one year of receivables from investments, loans and deposits and guarantees paid, advances and deposits paid to acquire new businesses, prepaid expenses, marketable securities that cannot be considered as cash or cash equivalents, and hedging instruments at fair value.

(in thousands of euros)   31/12/2022   31/12/2021
Loans, deposits and guarantees   1,137   994
Fair value of financial instruments   446   3,969
Gross current financial assets   1,583   4,963
Impairment        
Net current financial assets   1,583   4,963
Prepaid expenses   19,886   18,463
Current assets   19,886   18,463
TOTAL OTHER CURRENT ASSETS   21,469   23,426

4.5.3    OTHER NON-CURRENT ASSETS

(in thousands of euros)   1 to 5 years   More than 5 years
Other receivables (long-term portion)   1,421   249
Prepaid expenses (long-term portion)   7,872    
TOTAL   9,293   249

4.5.4    TRADE AND OTHER RECEIVABLES (CURRENT OPERATING ASSETS)

Accounting policies

Trade receivables, generally due within a period of one year, are recognised and accounted for at the initial invoice amount less an allowance for impairment recorded as the amount deemed to be unrecoverable. Doubtful receivables are estimated when there is no longer any probability of recovering the entire receivable. Impaired receivables are recorded as losses when they are identified as such. The Group uses the simplified approach allowed under IFRS 9 to calculate provisions for expected losses on trade receivables. Due to the Group’s low rate of past losses, the application of the impairment model for financial assets based on expected losses did not have a material impact for the Group.

In certain subsidiaries, Rubis has set up receivables disposal programmes enabling it to sell trade receivables and receive cash payments.

Trade receivables are deconsolidated once the Group has transferred its rights to receive payments for the asset as well as all the risks and rewards attached to the receivables.

When the risks and rewards of the asset have not been fully transferred, the receivables sold remain on the asset side of the balance sheet while the financing received is treated as financial liabilities in exchange for the receivables concerned.

Trade and other receivables include trade receivables and related accounts, employee receivables, government receivables and other operating receivables.

Gross value
(in thousands of euros)
      31/12/2022 31/12/2021
Trade and other receivables       662,002 508,637
Employee receivables       2,176 2,114
Government receivables       83,299 62,780
Other operating receivables       54,357 75,183
TOTAL       801,834 648,714
           
Impairment
(in thousands of euros)
31/12/2021 Change
in scope
Additions Reversals 31/12/2022
Trade and other receivables 24,566 933 6,592 (5,312) 26,779
Other operating receivables 1,670 835 2,135 (6) 4,634
TOTAL 26,236 1,768 8,727 (5,318) 31,413

In 2022, losses on receivables remained stable and were not material.

Assignment of receivables

During the year, Rubis set up receivables and factoring programmes, particularly in Martinique, under which the subsidiary sells trade receivables to the factor or financial institution in exchange for cash. Some programmes are deconsolidating.

€20 million of receivables were deconsolidated as of 31 December 2022.

RECONCILIATION OF CHANGE IN WORKING CAPITAL WITH THE STATEMENT OF CASH FLOWS

Net carrying amount as of 31/12/2022   770,421
Net carrying amount as of 31/12/2021   622,478
Change in trade and other receivables on the balance sheet   (147,943)
Impact of change in the scope of consolidation   25,874
Impact of translation differences   (18,205)
Impact of reclassifications   379
Impact of change in other current assets and other receivables due in more than one year   (2,788)
Change in trade and other receivables on the statement of cash flows   (142,683)

4.5.5    CASH AND CASH EQUIVALENTS

Accounting policies

Cash and cash equivalents include current bank accounts and UCITS units which can be mobilised or sold in the very short term (less than three months) and which present no significant risk of change in value, according to the criteria stipulated in IAS 7. These assets are recognised at fair value through profit or loss.

(in thousands of euros)   31/12/2022   31/12/2021
UCITS   24,737   23,920
Other funds   212,857   125,702
Interest receivable   591   246
Cash   566,723   725,022
TOTAL   804,907   874,890

As of 31 December 2022, cash and cash equivalents included €83.8 million in funds reserved for the priority acquisition of dollars by the Ringardas subsidiary located in Nigeria.

Equity risk

The Group’s exposure to equity risk mainly relates to HDF Energy securities acquired in 2021 (see note 4.5.1).

4.5.6    CREDIT RISK

Customer concentration risk

No customer represented 10% or more of the Group’s revenue in 2022 or 2021.

The Group’s maximum credit risk exposure from trade receivables at the reporting date is as follows for each region:

Net amount (in thousands of euros)   31/12/2022   31/12/2021
Europe   102,395   82,805
Caribbean   216,000   167,105
Africa   316,828   234,161
TOTAL   635,223   484,071

Over both financial years, the ratio of trade receivables to revenue was less than or close to 10%.

The ageing of the current assets at the reporting date breaks down as follows:

          Amount of assets due
(in thousands of euros) Carrying
amount
Impairment Net carrying
amount
Assets not
yet due
Less than
6 months
From
6 months
to 1 year
More than
1 year
Trade and other receivables 801,834 31, 413 770,421 460,430 237,265 56,504 16,222
Tax receivables 36,018   36,018 23,501 3,242 2,490 6,785
Other current assets 21,469   21,469 21,096 90 283  
TOTAL 859,321 31,413 827,908 505,027 240,597 59,277 23,007

The breakdown of impaired trade receivables by maturity is as follows:

      Amount of assets due
(in thousands of euros) 31/12/2022 Assets not
yet due
Less than
6 months
From 6 months
to 1 year
More than
1 year
Gross value of impaired trade receivables 30,677 461 3,818 3,744 22,654
Impairment of trade receivables (26,779) (461) (3,129) (2,080) (21,109)
TOTAL 3,898   689 1,664 1,545

4.6     Deferred taxes

Accounting policies

Deferred taxes are recognised for all temporary differences between the carrying amount and the tax basis, using the liability method.

Deferred tax assets are recognised for all deductible temporary differences, carry forwards of unused tax losses and unused tax credits, subject to the probability of taxable profit/earnings becoming available in the foreseeable future, on which these temporary deductible differences and carry forwards of unused tax losses, and unused tax credits can be used.

Deferred tax assets and liabilities are measured at the expected tax rate for the period when the asset is realised or the liability is settled, based on tax rates and laws enacted by the reporting date. This measurement is updated at each balance sheet date.

Deferred tax assets and liabilities are not discounted.

Deferred taxes are recorded as the difference between the carrying amount and the tax basis of assets and liabilities. Deferred tax assets and liabilities break down as follows:

(in thousands of euros)   31/12/2022   31/12/2021
Depreciation of fixed assets   (95,215)   (73,847)
Right-of-use assets and lease liabilities (IFRS 16)   4,896   3,580
Loss carryforwards   13, 240   1,639
Temporary differences   7,550   5,268
Provisions for risks   3,072   1,803
Provisions for environmental costs   4,445   4,975
Financial instruments   (17,348)   (980)
Pension commitments   8,795   9,548
Other   (3,004)   (2,144)
NET DEFERRED TAXES   (73,569)   (50,158)
Deferred tax assets   18,911   12,913
Deferred tax liabilities   (92,480)   (63,071)
NET DEFERRED TAXES   (73,569)   (50,158)

Deferred taxes representing tax loss carryforwards mainly concern tax losses carried forward from the French tax consolidation entities (as defined below), the Frangaz entity (tax losses arising prior to its inclusion in the tax consolidation) and the Photosol entities. The business forecasts updated at year-end justify the probability of deferred tax assets being applied in the medium term.

Deferred taxes relating to financial instruments mainly comprise deferred taxes relating to the fair value of hedging instruments.

Deferred taxes on non-current assets mainly comprise:

•   the cancellation of excess tax depreciation;

•   the standardisation of depreciation periods for machinery;

•   the difference between the consolidated value and the tax value of certain assets.

Deferred tax assets and liabilities are offset by entity or by tax consolidation group. Only the deferred tax asset or liability balance by entity or by tax consolidation group appears on the balance sheet. There are two tax consolidation scopes within the Group:

•   that of the parent company, Rubis SCA, which comprises the following entities: Rubis Énergie, Vitogaz France, Coparef, Rubis Patrimoine, Vito Corse, Frangaz, Starogaz, Sicogaz, Rubis Antilles Guyane, SIGL, Rubis Caraïbes Françaises, Rubis Guyane Française, Société Antillaise des Pétroles Rubis, Rubis Restauration et Services, Société Réunionnaise de Produits Pétroliers (SRPP) and Rubis Renouvelables (formerly Cimarosa Investissements);

•   that formed by Photosol SAS, which includes the entities: CRE 4, Firinga, Clotilda, Photosol Bourbon and Maïdo.

4.7     Inventories

Accounting policies

Inventories are valued at cost or net realisable value, whichever is lower.

The cost price is determined using the weighted average price method.

Borrowing costs are not included in inventory cost.

The net realisable value is the estimated sale price in the normal course of business minus estimated costs necessary to complete the sale.

Impairment is recognised when the probable realisable value is lower than the net carrying amount.

Gross value
(in thousands of euros)
    31/12/2022 31/12/2021
Inventories of raw materials and supplies     66,593 66,675
Inventories of finished and semi-finished products     155,823 88,731
Inventories of merchandise and other goods     421,848 402,898
TOTAL     644,264 558,304
         
Impairment
(in thousands of euros)
31/12/2021 Additions Reversals 31/12/2022
Inventories of raw materials and supplies 12,436 11,197 (10,615) 13,018
Inventories of finished and semi-finished products 227 12,466 (227) 12,466
Inventories of merchandise and other goods 1,748 2, 659 (1,637) 2,770
TOTAL 14,411 26,322 (12,479) 28,254
         
RECONCILIATION OF CHANGE IN WORKING CAPITAL WITH THE STATEMENT OF CASH FLOWS
NET CARRYING AMOUNT AS OF 31/12/2022 616,010
Net carrying amount as of 31/12/2021 543,893
Change in inventories and work in progress on the balance sheet (72,117)
Impact of change in the scope of consolidation 1,428
Impact of reclassifications (139)
Impact of translation differences (6,514)
Change in inventories and work in progress in the statement of cash flows (77,342)

4.8     Equity

As of 31 December 2022, the share capital consisted of 102,953,566 fully paid up shares, with a par value of €1.25 each, i.e., a total amount of €128,692 thousand.

The various transactions impacting the share capital in the period are set out in the table below:

  Number of shares Share capital
(in thousands of euros)
Share premium
(in thousands of euros)
As of 1st January 2022 102,541,281 128,177 1,547,236
Company savings plan 171,576 214 3,229
Equity line (BEA)      
Preferred shares acquired 226    
Preferred shares converted into ordinary shares 244,431 306 (306)
Capital decrease by cancelling shares bought back (3,948) (5)  
Capital increase expenses     (39)
AS OF 31 DECEMBER 2022 102,953,566 128,692 1,550,120

As of 31 December 2022, Rubis held 84,987 treasury shares.

Equity line agreement with Crédit Agricole CIB of November 2021

In November 2021, the Group signed an equity line agreement with Crédit Agricole CIB for a period of 37 months and up to the authorised limit of 4,400,000 shares with a par value of €1.25. The share subscription price will show a discount of 5% compared to the volume-weighted average of the share prices of the two trading days preceding its setting. Crédit Agricole CIB acts as a financial intermediary and does not intend to remain in the Company’s share capital. As of 31 December 2022, the Group had not yet made use of this equity line.

RECONCILIATION OF THE CAPITAL INCREASE WITH THE STATEMENT OF CASH FLOWS

Share capital increase (decrease)   515
Share premium increase (decrease)   2,884
CAPITAL INCREASE (DECREASE) ON THE BALANCE SHEET   3,399
Share buyback (capital decrease)   5
CAPITAL INCREASE IN THE STATEMENT OF CASH FLOWS   3,404


RECONCILIATION OF THE DIVIDEND DISTRIBUTED BETWEEN THE STATEMENT OF CHANGES IN EQUITY AND THE STATEMENT OF CASH FLOWS

DIVIDEND PAYMENT ACCORDING TO THE STATEMENT OF CHANGES IN EQUITY   191,061
Payment of the dividend in shares    
DIVIDENDS PAID IN THE STATEMENT OF CASH FLOWS   191,061

4.9     Stock options and shares free of charge

Accounting policies

IFRS 2 provides for payroll expenses to be recognised for services remunerated by benefits granted to employees in the form of share-based payments. These services are carried at fair value of the instruments awarded.

All the plans granted by the Group are in the form of instruments settled in shares; the payroll expense is offset in equity.

The plans contain a condition that the beneficiaries remain in the Group’s workforce at the end of the vesting period, as well as non-market and/or market performance conditions depending on the plans.

Market performance conditions have an impact on the initial estimate of the unitary fair value of the instrument awarded at the allocation date, without subsequent revision during the vesting period.

Non-market performance conditions have an impact on the initial estimate at the allocation date of the number of instruments to be issued, which is subject to subsequent revision, where necessary, throughout the vesting period.

Stock option plans

Stock option plans are granted to some members of the Rubis Group personnel.

These options are measured at fair value on the allocation date, using a binomial model (Cox Ross Rubinstein). This model takes into account the characteristics of the plan (exercise price and exercise period, performance conditions) and market data on the allocation date (risk-free interest rate, share price, volatility, and expected dividends).

This fair value on the allocation date is recognised as payroll expenses, on a straight-line basis over the vesting period, offset against equity.

Award of shares free of charge

Free share award plans are granted to some members of the Group’s personnel.

These free share awards are measured at fair value on the allocation date, using a binomial model. This valuation is carried out on the basis of the share price on the allocation date, taking into account the absence of dividends over the vesting period and the performance conditions contained in the plans.

This fair value on the allocation date is recognised as payroll expenses, on a straight-line basis over the vesting period, offset against equity.

Preferred share allocations

Preferred share award plans are also granted to some members of the Rubis Group personnel.

These allocations of preferred shares are valued at fair measured on the allocation date, using a binomial model. This valuation is carried out on the basis of the share price on the allocation date, taking into account, over the vesting period, the absence of dividends and the performance conditions contained in the share plans.

This fair value on the allocation date is recognised as payroll expenses, on a straight-line basis over the vesting period, offset against equity.

Company savings plans

The Group has set up several company savings plans for its employees. These plans provide employees with the possibility of subscribing to a reserved capital increase at a discounted share price. They meet the conditions for the application of share purchase plans.

The fair value of each share is then estimated as corresponding to the difference between the share price on the plan allocation date and the subscription price. However, the share price is adjusted to take into account the unavailability of the share for five years, based on the difference between the risk-free rate at the allocation date and the interest rate.

In the absence of vesting period, the payroll expense is recognised directly against equity.

The expense corresponding to the Company contribution granted to employees is also recognised in the income statement under payroll expenses.

Stock options
Date of Management Board
Outstanding as
of 31/12/2021
Rights
issued
Rights
exercised
Rights
cancelled
Outstanding as
of 31/12/2022
17 December 2019 150,276       150,276
6 November 2020 87,502       87,502
1st April 2021 5,616       5,616
TOTAL 243,394       243,394
           
Stock options
Date of Management Board
Number of outstanding
options
Exercise
expiry date
Exercise price
(in euros)
Exercisable
options
17 December 2019 150,276   Mar.-33 52.04  
6 November 2020 87,502   Mar.-34 29.71  
1st April 2021 5,616   Mar.-34 40.47  
TOTAL 243,394        

The terms of the free share plans outstanding as of 31 December 2022 are set out in the tables below:

Free performance shares
Date of Management Board
Outstanding as
of 31/12/2021
Rights
issued
Rights
exercised
Rights
cancelled
Outstanding as
of 31/12/2022
17 December 2019 385,759       385,759
6 November 2020 787,697       787,697
1st April 2021 43,516       43,516
13 December 2021 160,072       160,072
20 July 2022   514,770     514,770
TOTAL 1,377,044 514,770     1,891,814

The definitive allocation of the shares to the beneficiaries may only take place at the end of a vesting period, which is generally three years, running from their allocation by the Management Board. Vesting is also subject to the achievement of the performance conditions stipulated in the plan regulations.

Free preferred shares
Date of Management Board
Outstanding as
of 31/12/2021
Rights
issued
Rights
exercised
Rights
cancelled
Outstanding as
of 31/12/2022
11 July 2016 2,469   (2,469)    
13 March 2017 1,932     (1,932)  
19 July 2017 374     (374)  
2 March 2018 345     (345)  
5 March 2018 1,157     (1,157)  
19 October 2018 140     (140)  
7 January 2019 62       62
17 December 2019 662     (662)  
TOTAL 7,141   (2,469) (4,610) 62

Preferred shares will be converted into ordinary shares at the end of a retention period of one year based on the extent to which the performance conditions have been achieved.

As part of the Photosol transaction, the managers of the group acquired by Rubis SCA benefited from a share-based compensation plan from the Rubis Photosol holding company, head of the Photosol Group, providing for the grant of 8.4 million shares free of charge and 0.8 million preferred shares. These items were measured at fair value and amortised over the vesting period, i.e., one year from the takeover by Rubis SCA.

Valuation of stock option plans and shares free of charge

The risk-free interest rate used to calculate the value of these plans is the interest rate on Euro-zone Government bonds with the same maturity as the options (source: Iboxx).

With respect to the early exercise of the options, the model assumes rational expectations on the part of option holders, who may exercise their options at any time throughout the exercise period. The implied volatility used in the calculation is estimated on the basis of past volatility levels.

The annual dividend rates used in the valuations are as follows:

Date of Management Board   Shares free of charge
11 July 2016   3.7%
13 March 2017   3.4%
19 July 2017   3.3%
2 March 2018   3.4%
5 March 2018   3.4%
19 October 2018   3.0%
7 January 2019   3.0%
17 December 2019   2.9%
6 November 2020   3.1%
1st April 2021   3.3%
13 December 2021   4.0%
20 July 2022   5.4%

Company savings plan – Valuation of company savings plans

The lock-up rate was estimated at 0.17% for the 2022 plan (0.41% for the 2021 plan).

The risk-free interest rate used to calculate the value of the company savings plans is the interest rate on Euro-zone Government bonds with the same maturity as the instruments valued (source: Iboxx). The discount related to the lock-up was estimated based on the risk-free interest rate and the average borrowing rate over five years, i.e., 0.52% and 0.17% respectively.

4.10    Financial liabilities

Accounting policies

Financial liabilities are recognised and measured in accordance with IFRS 9 “Financial instruments”.

Financial liabilities are recognised in the Group balance sheet when the Group is a party to the instrument’s contractual provisions.

IFRS 9 defines two categories of financial liabilities, each subject to a specific accounting treatment:

   financial liabilities valued at amortised cost; they mainly include trade payables and borrowings applying the effective interest rate method, if applicable;

   financial liabilities valued at fair value through profit and loss, which only represent a very limited number of scenarios for the Group and do not have a significant impact on the financial statements.

Measurement and recognition of derivative instruments

The accounting policies used to measure and recognise derivative instruments are set out in note 4.5.

Breakdown of financial liabilities by class (IFRS 7) and by category (IFRS 9)   Value on balance sheet Fair value
 (in thousands of euros) Note  31/12/2022 31/12/2021 31/12/2022 31/12/2021
At amortised cost   2,905,232 1,969,879 2,893,963 1,969,764
Borrowings and financial debt 4.10.1 1,622,394 1,036,630 1,611,125 1,036,515
Lease liabilities 4.10.1 224,649 161,917 224,649 161,917
Deposit/consignment 4.10.1 148,588 138,828 148,588 138,828
Other non-current liabilities 4.10.3 94,245 3,214 94,245 3,214
Trade and other payables 4.10.4 781,742 601,605 781,742 601,605
Current tax liabilities   28,771 23,319 28,771 23,319
Other current liabilities 4.10.3 4,843 4,366 4,843 4,366
Fair value through other comprehensive income   5,154 389 5,154 389
Non-current derivatives 4.10.3 264   264  
Current derivatives 4.10.3 4,890 389 4,890 389
Fair value through profit or loss   468,714 276,558 468,714 276,558
Short-term bank borrowings 4.10.1 468,714 276,558 468,714 276,558
TOTAL FINANCIAL LIABILITIES   3,379,100 2,246,826 3,367,831 2,246,711

The fair value of derivative instruments is determined using valuation models based on observable data (level 2).

4.10.1    FINANCIAL DEBT AND LEASE LIABILITIES

Financial debt is presented in the following table, which differentiates between non-current and current liabilities:

Current
(in thousands of euros)
  31/12/2022   31/12/2021
Bank loans   267,487   227,617
Interest accrued not yet due on loans and bank overdrafts   4,193   2,083
Bank overdrafts   468,144   276,492
Other loans and similar liabilities   51,677   1,329
TOTAL BORROWINGS AND BANK OVERDRAFTS (DUE IN LESS THAN ONE YEAR)   791,501   507,521
Non-current
(in thousands of euros)
      31/12/2022 31/12/2021
Bank loans       1,254,240 786,182
Customer deposits on tanks       16,231 16,787
Customer deposits on cylinders       132,357 122,041
Other loans and similar liabilities       45,367 19,485
TOTAL BORROWINGS AND FINANCIAL DEBT       1,448,195 944,495
TOTAL       2,239,696 1,452,016
           
Non-current borrowings and financial debt (in thousands of euros)       1 to 5 years More than
5 years
Bank loans       959,664 294,576
Other loans and similar liabilities       26,236 19,131
TOTAL       985,900 313,707
           
As of 31/12/2022
(in thousands of euros)
Pledges of
securities
Pledges of
property, plant
and equipment
Other
guarantees
Unsecured Total
Bank loans 300,008   91,109 1,130,610 1,521,727
Bank overdrafts 75 6,886 272,889 188,294 468,144
Other loans and similar liabilities     30,975 66,069 97,044
TOTAL 300,083 6,886 394,973 1,384,973 2,086,915

The change in borrowings and other current and non-current financial liabilities between 31 December 2021 and 31 December 2022 breaks down as follows:

(in thousands of euros) 31/12/2021 Change
in scope
Issue Repayment Translation
differences
31/12/2022
Current and non-current borrowings and financial debt 1,313,188 449,474 1,186,809 (849,061) (9,302) 2,091,108
Lease liabilities            
(current and non-current) 161,917 49,533 50,308 (33,180) (3,929) 224,649
TOTAL 1,475,105 499,007 1,237,117 (882,241) (13,231) 2,315,757

Changes in scope mainly relate to the acquisition of Photosol.

The issues carried out during the period are mainly used for the refinancing of credit facilities that have been used, the financing of capital expenditure and current operations.

(in thousands of euros)   Fixed rate   Variable rate
Bank loans   244,004   1,010,236
Bank loans (portion due in less than one year)   71,182   196,305
TOTAL   315,186   1,206,541

Financial covenants

The Group’s consolidated net debt totalled €1,286 million as of 31 December 2022.

The credit agreements of Rubis Énergie and its subsidiaries include the commitment within Rubis Énergie’s scope to comply, during the term of the loans, with the following financial ratios:

•   net debt to equity ratio of less than 1;

•   net debt to EBITDA ratio of less than 3.5.

As of 31 December 2022, the Rubis Énergie Group’s threshold ratios were met, thus ruling out any probability of occurrence of events triggering early repayment. Failure to comply with these ratios would result in the early repayment of the loans.

The Photosol Group’s financing entities and certain production SPVs are subject to covenants negotiated on a case-by-case basis. No early repayment was required in respect of these as of 31 December 2022.

Schedule of lease liabilities

(in thousands of euros)   Less than
1 year
  1 to
5 years
  More than
5 years
  31/12/2022
Schedule of lease liabilities   27,735   68,486   128,428   224,649

Other information relating to leases (IFRS 16)

As of 31 December 2022, the amount of rent paid (restated leases and exempted leases) totalled €93 million and income from sub-letting amounted to €6.8 million.

Rents not restated as of 31 December 2022 break down as follows:

•   leases exempted:

•   term of less than 12 months, totalling €32.9 million,

•   assets with a low unit value, totalling €0.8 million;

•   variable portion of rents of €15.5 million.

4.10.2    DERIVATIVE FINANCIAL INSTRUMENTS

Hedging   Nominal amount hedged   Market value as of 31/12/2022
(in thousands of euros)
Foreign exchange        
    USD22M   (1,023)
    CHF5M   4
    USD26M   257
Interest rate (swaps and caps)        
    €882M   75,494
Trading (interest rate swap)        
        653
Material        
    51,563t   (3,931)
TOTAL FINANCIAL INSTRUMENTS       71,453

The fair value of derivative financial instruments carried by the Group includes a “counterparty risk” component for derivative instrument assets and an “own credit risk” component for derivative instrument liabilities. Credit risk is assessed using conventional mathematical models for market participants.

Interest rate risk

Characteristics of loans contracted Rate Total amount of lines
(in thousands of euros)
Less than
1 year
Between
1 and 5 years
More than
5 years
Existence or not of hedging
Euros Fixed rate 295,129 68,295 201,132 25,702  
  Variable rate 1,206,541 196,305 741,362 268,874 YES
US dollar Fixed rate 2,459 452 2,007    
  Variable rate          
Barbados dollar Fixed rate 17,598 2,435 15,163    
  Variable rate          
TOTAL   1,521,727 267,487 959,664 294,576  

Interest rate risk for the Group is limited to the loans obtained.

As of 31 December 2022, the Group had interest rate hedging agreements (caps and floors) in the amount of €882 million on a total of €1,207 million in variable-rate debt, representing 73% of that amount.

(in thousands of euros)   Overnight to 1 year(3)   1 to 5 years   Beyond
Borrowings and financial debt excluding consignments(1)   791,501   985,900   313,707
Financial assets(2)   804,907        
Net exposure before hedging   (13,406)   985,900   313,707
Hedging instruments       (882,000)    
NET EXPOSURE AFTER HEDGING   (13,406)   103,900   313,707
(1) Bank loans, bank overdrafts, accrued interest not yet due and other loans and similar liabilities.
(2) Cash and cash equivalents.
(3) Including variable-rate assets and liabilities.

Interest rate sensitivity

€869.8 million of the Group’s net debt has a variable interest rate, comprising confirmed variable-rate loans (€1,206.5 million) plus short-term bank borrowings (€468.1 million), less cash on hand (€804.9 million).

Given the hedges put in place, a 1% change in short-term rates would not have a significant impact on the cost of net financial debt for 2022.

Foreign exchange risk

Rubis purchases petroleum products in US dollars; the Group’s only potential exposure is therefore to that currency.

As of 31 December 2022, the Retail & Marketing and Support & Services activities showed a net positive position of US$482 million consisting of debts (including intragroup), and receivables as well as bank overdrafts and cash and cash equivalents. The Group’s exposure is mainly concentrated on the Rubis Energy Kenya, Ringardas (Nigeria), RWIL Suriname and Dinasa (Haiti) subsidiaries. This exposure increased mainly due to difficulties in sourcing US dollars.

A €0.01 fall in the euro against the US dollar would not entail a material foreign exchange risk (around €5 million before tax).

The exposure of the newly acquired Photosol entities is not material.

(in millions of US dollars)   31/12/2022
Assets   132
Liabilities   (614)
NET POSITION BEFORE MANAGEMENT   (482)
Off-balance sheet position    
NET POSITION AFTER MANAGEMENT   (482)

Risk of fluctuations in petroleum product prices

The following two factors must be considered when analysing the risk related to fluctuations in petroleum product prices:

•   petroleum product price fluctuation risk is mitigated by the short product storage times;

•   sales rates are revised on a regular basis, based on market conditions.

4.10.3    OTHER LIABILITIES

Other current liabilities
(in thousands of euros)
  31/12/2022   31/12/2021
Deferred income and other accruals   4,843   4,366
Fair value of financial instruments   4,890   389
TOTAL   9,733   4,755
Other non-current liabilities
(in thousands of euros)
  31/12/2022   31/12/2021
Liabilities on the acquisition of fixed assets and other non-current assets   577   154
Fair value of financial instruments (long-term portion)   264    
Other liabilities (long-term portion)   92,622   2,026
Deferred income (long-term portion)   1,046   1,034
TOTAL   94,509   3,214

As part of the Photosol transaction (see note 3.2), the Group recognised a buyback option on non-controlling interests at the date of the acquisition for a fair value of €82 million recognised in “Other long-term liabilities” with a corresponding decrease in minority interests presented in total equity. This buyback option amounted to €90 million as of 31 December 2022, after a revaluation of €8.5 million recognised in other comprehensive income.

4.10.4    TRADE AND OTHER PAYABLES (CURRENT OPERATING LIABILITIES)

(in thousands of euros)   31/12/2022   31/12/2021
Trade payables   456,848   405,330
Liabilities on the acquisition of fixed assets and other non-current assets   16,953   6,039
Social security payables   48,249   44,175
Taxes payable   153,969   74,722
Expenses payable   136   145
Current accounts   3,671   11,409
Miscellaneous operating liabilities   101,916   59,785
TOTAL   781,742   601,605

Reconciliation of change in working capital with the statement of cash flows

NET CARRYING AMOUNT AS OF 31/12/2022   781,742
Net carrying amount as of 31/12/2021   601,605
Change in trade and other payables on the balance sheet   180,137
Impact of change in the scope of consolidation   (23,433)
Impact of translation differences   24,353
Impact of reclassifications   514
Impact of change in payables on acquisition of assets (in investment)   (10,914)
Impact of the change in dividends payable and accrued interest on liabilities (in financing)   (130)
Impact of change in other current liabilities and other long-term debt   18,145
Change in trade and other payables on the statement of cash flows   188,672

4.10.5    LIQUIDITY RISK

Liquidity risk

As of 31 December 2022, the Group had used confirmed credit facilities totalling €639 million. The amount of credit facilities confirmed but not used as of 31 December 2022 was €531 million.

(in €m) Less than 1 year 1 to 5 years More than 5 years
Repayment schedule 267 960 295

At the same time, the Group has €805 million in immediately available cash on the assets side of its balance sheet.

The remaining contractual maturities of the Group’s financial liabilities break down as follows (including interest payments):

Financial liabilities
(in thousands of euros)
Carrying
amount
Contractual
cash flows
Less than
1 month
1 to
3 months
3 months
to 1 year
1 to
5 years
More than
5 years
Total
Borrowings and financial debt 1,299,607 1,397,113       1,047,049 350,064 1, 397,113
Deposit/consignment 148,588 148,588 90 170 1,009 91,539 55,780 148,588
Other non-current liabilities 94,509 94,509       48,782 45,727 94,509
Borrowings and bank overdrafts 791,501 815,989 311,582 235,279 269,093 35   815,989
Trade and other payables 781,742 781,742 466,272 152,585 78,349 83,326 1,210 781,742
Other current liabilities 9,733 9,733 2,539 669 5,620 896 9 9,733
TOTAL 3,125,680 3,247,674 780,483 388,703 354,071 1,271,627 452,790 3,247,674

The difference between contractual cash flows and the carrying amounts of financial liabilities mainly corresponds to future interest.

4.11    Other provisions (excluding employee benefits)

Accounting policies

Provisions are recognised when the Group has a current (legal or implicit) obligation to a third party resulting from a past event, when it is likely that an outflow of resources representing economic benefits will be necessary to settle the obligation, and when the amount of the obligation can be reliably estimated.

Dismantling and clean-up

Provisions are made for future site rehabilitation expenditures (dismantling and clean-up), arising from a current legal or implicit obligation, based on a reasonable estimate of their fair value during the financial year in which the obligation arises. The counterpart of this provision is included in the net carrying amount of the underlying asset and is depreciated according to the asset’s useful life. Subsequent adjustments to the provision following, in particular, a revision of the outflow of resources or the discount rate are symmetrically deducted from or added to the cost of the underlying asset. The impact of accretion (the passage of time) on the provision for site rehabilitation is measured by applying a risk-free interest rate to the provision. Accretion is recorded under “Other finance income and expenses.”

Litigation and claims

Provisions for litigation and claims are recognised when the Group has an obligation relating to legal action, tax audits, vexatious litigation or other claims resulting from past events that are still pending, when it is likely that an outflow of resources representing economic benefits will be necessary to settle the obligation, and when the amount of the obligation can be reliably estimated. The Group takes advice from its counsel and lawyers in order to assess the likelihood of the occurrence of risks and to estimate provisions for litigation and claims by including the probabilities of occurrence of the various scenarios envisaged.

Energy savings certificates

Some French entities are subject to an obligation to collect energy savings certificates. This obligation is subject to a provision evenly spread over the fourth period ended on 31 December 2021 (2018 to 2021). At the same time, the Group records the purchases of certificates made throughout the three-year period in inventories, at their acquisition or collection cost.

At the end of each three-year period, the inventories are consumed and the provisions reversed. These items are recorded under “EBITDA”.

Restructuring

In the case of restructuring, an obligation is created when the Group has a detailed and formalised restructuring plan and the main restructuring measures have been announced to the people concerned, or when the restructuring has begun to be implemented.

If the impact of time value is significant, provisions are discounted to present value.

Non-current
(in thousands of euros)
  31/12/2022   31/12/2021
Provisions for contingencies and expenses   62,408   130,857
Dismantling and clean-up provisions   35,600   28,968
TOTAL   98,008   159,825

Provisions for contingencies and expenses include:

•   the Group’s obligations in terms of energy-saving certificates. These provisions are recognised throughout the three-year period currently in progress (2022-2025);

•   a provision relating to the Rubis Group’s obligation to bring the acquired assets under its banner (rebranding);

•   provisions relating to risks or disputes that could potentially lead to action being taken against the Rubis Group.

The Group may be required to make provisions when there is a risk of the prices charged by the project companies (SPV) being called into question. However, as of 31 December 2022, no significant provision had been made for this risk.

Dismantling and clean-up provisions comply with IAS 16. The Group has estimated its clean-up and dismantling costs largely based on the findings of outside consultants. In compliance with IAS 16, the present value of these expenses was incorporated into the cost of the corresponding facilities.

(in thousands of euros) 31/12/2021 Change
in scope
Additions Reversals* Translation
differences
31/12/2022
Provisions for contingencies and expenses 130,857   41,778 (109,733) (494) 62,408
Dismantling and clean-up provisions 28,968 9,496 1,794 (1,670) (2,988) 35,600
TOTAL 159,825 9,496 43,572 (111,403) (3,482) 98,008


* Including €10.9 million in reversals not applicable.

Provisions made for obligations to collect energy saving certificates relating to the period ended (2018/2021) were reversed over the financial year, the Group having liquidated this collection campaign, thus settling the inventories and liabilities recognised in previous years and relating to this fourth three-year period.

Changes in provisions for contingencies and expenses for the year mainly reflect:

•   the Group’s new obligations in terms of collecting energy-saving certificates;

•   the Group’s clean-up and remediation obligations

•   the obligations of the newly acquired Photosol entities in terms of clean-up and restoration.

In December 2021, the Competition Authority was automatically tasked with a fact-finding mission on the practices observed in the fuel supply, storage and distribution sector in Corsica. The procedure is still ongoing at the reporting date.

4.12   Employee benefits

Accounting policies

The Group’s employees are entitled to:

defined-contribution pension plans applicable under general law in the relevant countries;

supplementary pension benefits and retirement allowances (French, Swiss and Bermudan companies and entities located in Barbados, Guyana and the Bahamas and certain Malagasy entities);

a closed supplementary pension plan (FSCI pension funds, Channel Islands);

post-employment health plans (Bermudan and South African companies).

The Group’s only obligations under defined-contribution plans are premium payments; the expense corresponding to premium payments is recorded in the profit (loss) for the period.

Under defined-benefit plans, pension commitments and related commitments are valued according to the actuarial projected unit credit method based on final salary. The calculations include actuarial assumptions, mainly pertaining to mortality, personnel turnover rates, final salary forecasts and the discount rate. These assumptions take into account the economic conditions of each country or each Group entity. The rate is determined in relation to high-quality corporate bonds in the region in question.

These measurements are performed twice a year.

Actuarial gains and losses on post-employment defined-benefit plans resulting from changing actuarial assumptions or experience-related adjustments (differences between previous actuarial assumptions and actual recorded workforce events), are recognised in full under other comprehensive income for the period in which they are incurred. The same applies to any adjustment due to the cap on hedging assets in the case of over-financed plans. These items are never subsequently recycled through profit and loss.

In accordance with the IFRIC 14 interpretation, net assets resulting from over-financing of the FSCI’s defined-benefit pension plans are not recognised in the Group’s financial statements, as the Group does not have an unconditional right to receive this surplus.

The employees of Vitogaz France, Rubis Énergie, Frangaz, Vito Corse, Rubis Antilles Guyane, SARA, SRPP, Rubis Energy Bermuda and Vitogaz Switzerland are also entitled to seniority bonuses related to the awarding of long-service medals, which fall into the category of long-term benefits, as defined in IAS 19. The amount of the bonuses likely to be awarded has been valued via the method used to value post-employment defined-benefit plans, except for actuarial gains and losses recognised in the income statement for the period during which they are incurred.

Employees of SARA are entitled to progressive pre-retirement plans, early retirement, and retirement leave. The total amount of the commitments corresponding to pre-retirement allowances and early retirement has been assessed using the method described above.

The employee benefits granted by the Group are broken down by type in the table below:

(in thousands of euros)   31/12/2022   31/12/2021
Provision for pensions   26,607   39,846
Provision for health and mutual insurance coverage   11,318   13,870
Provision for long-service awards   2,238   2,722
TOTAL   40,163   56,438

The change in provisions for employee benefits breaks down as follows:

(in thousands of euros)   2022   2021
Provisions as of 1st January   56,438   60,189
Interest expense for the period   1,388   1,024
Service cost for the period   3,697   3,670
Expected return on assets for the period   5,902   (3,240)
Benefits paid for the period   (3,322)   (2,557)
Actuarial losses/(gains) and limitation of assets   (25,571)   (5,148)
Translation differences   1,631   2,500
PROVISIONS AS OF 31 DECEMBER   40,163   56,438

Post-employment benefits

Post-employment benefits as of 31 December 2021 and 2022 were assessed by an independent actuary, using the following assumptions:

Assumptions (within a range depending on the entity)   2022   2021
Discount rate   from 1.45 to 13.50%   from 0 to 11.25%
Inflation rate   from 0 to 3.2%   from 0 to 3.2%
Rate of wage increases   from 0 to 17.5%   from 0 to 15%
Age at voluntary retirement   from 60 to 65 years   from 60 to 66 years

Actuarial differences are offset against equity.

The discount rates used were determined by reference to the yields on high-quality corporate bonds (minimum rating of AA) with terms equivalent to those of the commitments on the date of assessment.

The calculation of the sensitivity of the provision for commitments to a change of one-quarter of a percentage point in the discount rate shows that the total obligation and the components of earnings would not be significantly affected, in view of the total sum recognised in the Group’s financial statements under employee benefits.

Sensitivity assumptions
(in thousands of euros)
  Provision for
commitments
Measurement of the provision as of 31/12/2022   40,163
Measurement of the provision – discount rate assumption lowered by 0.25%   41,221
Measurement of the provision – discount rate assumption raised by 0.25%   39,356


Detail of commitments

(in thousands of euros)   31/12/2022   31/12/2021
Actuarial liabilities for commitments not covered by assets   25,484   42,093
Actuarial liabilities for commitments covered by assets   28,954   36,843
Market value of hedging assets   (28,954)   (36,843)
Deficit   25,484   42,093
Limitation of assets (over-financed plans)   12,441   11,623
PROVISIONS AS OF 31 DECEMBER   37,925   53,716


Change in actuarial liabilities

(in thousands of euros)   2022   2021
Actuarial liabilities as of 1st January   78,936   83,557
Service cost for the period   4,007   3,533
Interest expense for the period   1,379   1,020
Benefits paid for the period   (4,061)   (3,226)
Actuarial losses/(gains) and limitation of assets   (26,208)   (9,134)
Translation differences   385   3,186
ACTUARIAL LIABILITIES AS OF 31 DECEMBER   54,438   78,936


Change in hedging assets

(in thousands of euros)   2022   2021
Hedging assets as of 1st January   36,843   33,232
Translation differences   (1,231)   696
Expected return on fund assets   (5,717)   3,722
Benefits paid   (942)   (807)
Hedging assets as of 31 December   28,953   36,843
Limitation of assets   (12,441)   (11,623)
ASSETS RECOGNISED AS OF 31 DECEMBER   16,512   25,220
Hedging assets are detailed below:    
Breakdown of hedging assets   31/12/2022
Equity   19%
Bonds   31%
Assets backed by insurance policies   50%
TOTAL   100%


Geographic breakdown of employee benefits

(in thousands of euros)   Europe   Caribbean   Africa
Actuarial assumptions   from 1.45 to 4.25%   from 3.1 to 5.30%   from 3.1 to 13.5%
Provision for pensions and health insurance coverage   3,691   30,230   4,004
Provision for long-service awards   597   1,387   253


Note 5.    Notes to the income statement

Accounting policies

The Group uses EBITDA as a performance indicator. EBITDA corresponds to net revenue minus:

•    consumed purchases;

•    external expenses;

•    payroll expenses;

•    taxes.

The Group uses EBIT as its main performance indicator. EBIT corresponds to EBITDA after:

•    other operating income;

•    net depreciation, amortisation and provisions;

•    other operating income and expenses.

To better present the operating performance in the business lines, the equity associates’ net income is shown on a specific line in operating income.

5.1   Revenue

Accounting policies

Revenue from Group activities is recognised when control of the asset is transferred to the buyer, i.e., when the asset is delivered to the customer in accordance with contractual provisions and the customer is in a position to decide how the asset will be used and to benefit from substantially all of the benefits of ownership:

for the income earned from the Retail & Marketing activity, on delivery. For the bitumen business, revenue is mainly recognised when goods leave the bulk tank. In the case of administered margins, revenue is restated by recognising accrued income, if applicable, or deferred income, in order to take into account the substance of the operations;

for the income earned from the Support & Services activity, on delivery and according to the term of the service provision contract. As regards SARA, revenue from the sale of petroleum products is recognised at the bulk tank outlet when the product leaves the refinery or the other depots;

for products from the Renewable Electricity Production division, when the MWh are delivered by photovoltaic power plants. The revenue recorded by each plant is recognised according to the quantities produced and injected during the period. It corresponds to the sale of electricity produced and sold either in accordance with the various contracts whose sale prices are defined by decree or in the context of calls for tenders, or on the market.

Operations carried out on behalf of third parties are excluded from revenue and purchases, in line with industry practices.

Net revenue is detailed in the table below by business segment and region of the consolidated companies.

31/12/2022
(in thousands of euros)
Retail &
Marketing
Support &
Services
Renewable
Electricity
Production
Parent
company
Total
Region          
Europe 832,609   32,558 134 865,301
Caribbean 2,577,392 1,024,356     3,601,748
Africa 2,650,777 16,902     2,667, 679
TOTAL 6,060,778 1,041,258 32,558 134 7,134,728
Business line          
Fuels, liquefied gas and bitumen 6,060,778       6,060,778
Refining   869,358     869,358
Trading, supply, transport and services   171,900     171,900
Photovoltaic electricity     32,558   32,558
Other       134 134
TOTAL 6,060,778 1,041,258 32,558 134 7,134,728
31/12/2021
(in thousands of euros)
Retail &
Marketing
Support &
Services
Parent
company
Total
Region        
Europe 681,726   247 681,973
Caribbean 1,649,382 579,644   2,229,026
Africa 1,661,804 16,643   1,678,447
TOTAL 3,992,912 596,287 247 4,589,446
Business line        
Fuels, liquefied gas and bitumen 3,992,912     3,992,912
Refining   509,118   509,118
Trading, supply, transport and services   87,169   87,169
Other     247 247
TOTAL 3,992,912 596,287 247 4,589,446

5.2    Consumed purchases

(in thousands of euros)   31/12/2022   31/12/2021
Purchases of raw materials, supplies and other materials   452,003   240,265
Change in inventories of raw materials, supplies and other materials   925   (1,316)
Goods-in-process inventory   (71,713)   (29,039)
Other purchases   31,757   22,077
Merchandise purchases   5,286,877   3,262,865
Change in merchandise inventories   (25,172)   (173,911)
Additions to impairment (net of reversals) for raw materials and merchandise   15,703   (1,296)
TOTAL   5,690,380   3,319,645

5.3    Employee benefits expense

The Group’s employee benefits expense break down as follows:

(in thousands of euros)   31/12/2022   31/12/2021
Salaries and wages   164,482   140,536
Management Board compensation   2,408   2,401
Social security contributions   70,075   56,542
TOTAL   236,965   199,479

The Group’s average headcount breaks down as follows:

Average headcount of fully consolidated companies by category   31/12/2022
Executives   719
Employees and workers   2,658
Supervisors and technicians   678
TOTAL   4,055
Average headcount of fully consolidated companies   31/12/2021   New hires   Departures   31/12/2022
TOTAL   3,829   772   (546)   4,055
Share of average headcount of proportionately consolidated companies 31/12/2022
TOTAL   12

5.4    External expenses

(in thousands of euros)   31/12/2022   31/12/2021
Leases and rental expenses   10,854   8,992
Fees   31,560   27,915
Other external services*   360,990   378,554
TOTAL   403,404   415,461
* Also includes expenses for rents (see note 4.1.2 “IFRS 16 right-of-use”; exemptions offered by the standard and retained by the Group).

5.5    Net depreciation, amortisation and provisions

(in thousands of euros)   31/12/2022   31/12/2021
Intangible assets   4,875   3,254
Property, plant and equipment   162,812   140,575
Current assets   4,639   (4,557)
Operating contingencies and expenses   (4,579)   (2,742)
TOTAL   167,747   136,530

5.6    Other operating income and expenses

(in thousands of euros)   31/12/2022   31/12/2021
Operating subsidies   23   614
Other miscellaneous income   13,502   7,530
Other operating income   13,525   8,144
Other miscellaneous expenses   (7,198)   (15,189)
Other operating expenses   (7,198)   (15,189)
TOTAL   6,327   (7,045)

5.7    Other operating income and expenses

Accounting policies

The Group sets aside operating income and expenses which are unusual, infrequent or, generally speaking, non-recurring, and which could impair the readability of the Group’s operational performance.

Other operating income and expenses includes the impact of the following on profit and loss:>

•    acquisitions and disposals of companies (negative goodwill, strategic acquisition costs, capital gains or losses on disposal, etc.);

•    capital gains or losses on disposal or scrapped property, plant and equipment or intangible assets;

•    other unusual and non-recurrent income and expenses;

•    significant additions to provisions and impairment of property, plant and equipment or intangible assets.

(in thousands of euros)   31/12/2022   31/12/2021
Income from disposal of property, plant and equipment and intangible assets   65   139
Strategic acquisition expenses   (22,375)   (271)
Other expenses and provisions   111   1,469
Goodwill impairment (see note 4.2)   (40,000)    
Impact of business disposals   4,063   3,465
TOTAL   (58,136)   4,802

As of 31 December 2022, expenses related to strategic acquisitions correspond to the costs incurred in connection with the acquisition of the Photosol Group.

Impact of business disposals:

•   during January 2022, the Rubis Terminal JV sold its entire stake in its Turkish assets (Rubis Terminal Petrol). Following this transaction, and in accordance with the  agreements previously signed, the Group received an earn-out payment of €4 million from the infrastructure fund I Squared Capital;

•   as of 31 December 2021, the Group had sold Recstar Middleast, an entity with no activity but holding trade receivables.

5.8    Cost of net financial debt

(in thousands of euros)   31/12/2022   31/12/2021
Income from cash and cash equivalents   11,869   9,747
Net proceeds from disposal of marketable securities   (1)   (102)
Interest on borrowings and other financial debt   (42,363)   (22,220)
TOTAL   (30,495)   (12,575)

5.9    Other finance income and expenses

Accounting policies

Transactions denominated in foreign currencies are converted by the subsidiary into its operating currency at the rate applicable on the date of the transaction. Monetary assets and liabilities denominated in foreign currencies are converted at the exchange rate in effect at the reporting date of each accounting period. The corresponding foreign exchange differences are recorded in the income statement under “Other finance income and expenses”.

(in thousands of euros)   31/12/2022   31/12/2021
Foreign exchange losses   (133,205)   (36,353)
Foreign exchange gains   55,353   22,914
Other finance expense   (14,335)   (3,580)
Other finance income   12,071   5,563
TOTAL   (80,116)   (11,456)

5.10    Income tax

5.10.1     INCOME TAX EXPENSE OF FRENCH TAX GROUP COMPANIES

Current income tax expense

Current income tax expense corresponds to the amount of income tax payable to the tax authorities for the period, in accordance with applicable regulations and tax rates in effect in France.

The base tax rate in France is 25%. The Social Security Finance Act No. 99-1140 of 29 December 1999 established an additional tax of 3.3% of the base tax payable; the legal tax rate for French companies was thus increased by 0.83%. As a result, income from the French tax consolidation was taxed at a rate of 25.83% in 2022.

Deferred taxes

The deferred income tax liability is determined using the method described in note 4.6. The corporate income tax rate for all French companies is 25.83%. IFRS require that deferred taxes be measured using the tax rate in effect at the time of their probable use.

5.10.2     RECONCILIATION BETWEEN THE THEORETICAL TAX CALCULATED WITH THE TAX RATE IN FORCE IN FRANCE AND THE ACTUAL TAX EXPENSE

31/12/2022
(in thousands of euros)
  Income   Tax   Rate
Income at the normal rate   330,033   (85,248)   25.83%
Geographic impact       42,508   -12.9%
Distribution tax (share of cost and expenses, withholding tax)       (6,566)   2.0%
Tax credit       1,572   -0.5%
Other permanent differences       (9,503)   2.9%
Tax adjustments and risks/Refunds received       (3,788)   1.1%
Effect of changes in rate       397   -0.1%
Other       (3,234)   1.0%
Profit/(loss) before tax and share of net income from joint ventures   330,033   (63,862)   19.35%
Share of net income from joint ventures   5,732        
Profit (loss) before tax   335,765   (63,862)   19.02%

5.11    Earnings per share

Accounting policies

Basic earnings per share is calculated by dividing net income, Group share by the weighted average number of shares outstanding during the financial year.

The weighted average number of shares outstanding is calculated based on any changes in share capital during the period, multiplied by a weighting factor depending on the time, and adjusted, where applicable, to take into account the Group’s holdings of its own shares.

Diluted net earnings per share is calculated by dividing net income, Group share by the weighted average number of ordinary shares outstanding, increased by the maximum amount of impact from the conversion of all dilutive instruments. The number of shares whose issue is conditional at the reporting date included in the calculation of diluted earnings per share is based on the number of shares (i) that would have to be issued if the closing date of the period were the end of the contingency period, and (ii) which have a dilutive effect.

In both cases, the shares included in the calculation of the weighted average number of shares outstanding during the financial year are those that provide unlimited entitlement to earnings.

The table below presents the income and shares used to calculate basic earnings and diluted earnings per share.

Earnings per share
(in thousands of euros)
  31/12/2022   31/12/2021
Net income, Group share   262,896   292,569
Impact of stock options on income   193   227
Consolidated net income after recognition of the impact of stock options on income   263,089   292,796
Number of shares at the beginning of the period   102,538,186   103,628,083
Company savings plan   106,236   164,470
Dividend in shares       1,308,745
Capital decrease       (2,832,654)
Preferred shares   237,567   18,001
Weighted average number of shares outstanding   102,881,989   102,286,645
Shares free of charge (performance and preferred)   121,852   246,900
Diluted weighted average number of shares   103,003,841   102,533,545
UNDILUTED EARNINGS PER SHARE (in euros)   2.56   2.86
DILUTED EARNINGS PER SHARE (in euros)   2.55   2.86


5.12    Dividends

5.12.1     DIVIDENDS APPROVED

Rubis has always pursued an active dividend payment policy for its shareholders, as illustrated by the dividend payout ratio over the past five years, which has represented an average of 60% of net income, Group share.

Date of distribution Financial year
concerned
Number of shares
concerned
Net dividend paid
(in euros)
Total net amounts
distributed
(in euros)
CSM 09/06/2011 2010 14,534,985 3.05 44,331,704
CSM 07/06/2012 2011 30,431,861 1.67 50,821,208
CSM 07/06/2013 2012 33,326,488 1.84 61,320,738
CSM 05/06/2014 2013 37,516,780 1.95 73,157,721
CSM 05/06/2015 2014 38,889,996 2.05 79,724,492
CSM 09/06/2016 2015 43,324,068 2.42 104,844,245
CSM 08/06/2017 2016 45,605,599 2.68 122,223,005
OSM 07/06/2018 2017 95,050,942 1.50 142,574,358
CSM 11/06/2019 2018 97,185,200 1.59 154,522,276
OSM 11/06/2020 2019 100,348,772 1.75 175,607,076
CSM 10/06/2021 2020 100,955,418 1.80 181,715,083
CSM 09/06/2022* 2021 102,720,955 1.86 191,060,498
* Including 514 preferred shares eligible for only 50% of the net dividend distributed (i.e., €0.93 in 2021).

Note that two-for-one share splits were performed in both 2011 and 2017.

5.12.2    DIVIDEND PER BY-LAWS

In the absence of a positive total shareholder return (TSR) by the Rubis share in 2022, as defined by Article 56 of the by-laws as amended by the Shareholders’ Meeting of 9 December 2020, the General Partners received no dividend in respect of financial year 2022.

Note 6.    Summary segment information

Accounting policies

In accordance with IFRS 8, operating segments are those examined by the Group’s main operational decision-makers (the Managing Partners).This segment analysis is based on internal organisational systems and the Group’s Management structure.

Apart from the Rubis SCA holding company, the Group is managed in three main divisions:

   Retail & Marketing, which specialises in the trading and distribution of fuels (in service stations or to professionals), lubricants, liquefied gas and bitumen;

   Support & Services, which houses all infrastructure, transport, supply and services activities, supporting the development of downstream Retail & Marketing activities;

   Renewable Electricity Production, specialising in photovoltaic electricity.

Since 30 April 2020, the Rubis Terminal activity has been consolidated in the Group’s financial statements using the equity method. The Rubis Terminal joint venture specialises in Bulk Liquid Storage (petroleum products, chemical and agrifood products) for commercial and industrial customers.

The Group has also identified three regions:

  Europe;

  Africa;

  Caribbean.

6.1    Information by business segment

6.1.1     INCOME STATEMENT ITEMS BY BUSINESS SEGMENT

The following table presents, for each business segment, information on income from usual activities and the results for 2022 and 2021. Each column in the table below contains figures specific to each segment as an independent entity; the “Intra-group” column groups together transactions and accounts between the different segments which have been eliminated.

        Reconciliation  

31/12/2022

(in thousands of euros)

Retail &
Marketing
Support &
Services
Renewable
Electricity
Production
Rubis
Terminal
(JV)
Parent
company
Eliminations Total
Revenue 6,060,778 1,041,258 32,558   134   7,134,728
Intersegment revenue 33       8,211 (8,244)  
Revenue 6,060,811 1,041,258 32,558   8,345 (8,244) 7,134,728
EBITDA 503,234 177,082 17,713   (28,535)   669,494
EBIT 396,331 143,623 (853)   (30,087)   509,014
Share of net income from joint ventures 1,145   (69) 4,656     5,732
Operating income after share of net income from joint ventures 357,255 143,966 (23,397) 4,656 (25,870)   456,610
Cost of financial debt (21,752) (1,053) (6,900)   879 1,669 (30,495)
Income tax expense (59,451) (10,065) 2,826   2,828   (63,862)
TOTAL NET INCOME 178,341 135,675 (26,261) 4,656 (20,508)   271,903
      Reconciliation
31/12/2021
(in thousands of euros)
Retail &
Marketing
Support &
Services
Rubis
Terminal
(JV)
Parent
company
Eliminations Total
Revenue 3,992,912 596,287   247   4,589,446
Intersegment revenue 33     2,723 (2,756)  
Revenue 3,992,945 596,287   2,970 (2,756) 4,589,446
EBITDA 386,694 164,630   (19,027)   532,297
EBIT 289,312 122,629   (20,113)   391,828
Share of net income from joint ventures 1,253   4,653     5,906
Operating income after share of net income from joint ventures 295,630 122,616 4,653 (20,363)   402,536
Cost of financial debt (13,622) (1,050)   2,097   (12,575)
Income tax expense (56,685) (11,468)   2,952   (65,201)
TOTAL NET INCOME 205,601 109,921 4,653 (15,436)   304,739


6.1.2     BALANCE SHEET ITEMS BY BUSINESS SEGMENT

        Reconciliation
31/12/2022
(in thousands of euros)
Retail &
Marketing
Support &
Services
Renewable
Electricity
Production
Rubis
Terminal
(JV)
Parent
company
Eliminations Total
Fixed assets 2,363,196 460,098 1,017,295   25,918 (32,636) 3,833,871
Equity interests 351,685 3,835 250   1,455,537 (1,748,000) 63,307
Interests in joint ventures 17,525   (68) 287,670     305,127
Deferred tax assets 11,062 1,975 5,874       18,911
Segment assets 1,737,551 520,015 77,337   607,872 (693,950) 2,248,825
Total assets 4,481,019 985,923 1,100,688 287,670 2,089,327 (2,474,586) 6,470,041
Consolidated equity 1,537,774 383,716 487,809 287,670 1,923,884 (1,760,563) 2,860,290
Financial debt 1,599,624 202,687 511,869   1,577   2,315,757
Deferred tax liabilities 190 948 30,150   61,192   92,480
Segment liabilities 1,343,431 398,572 70,860   102,674 (714,023) 1,201,514
Total liabilities 4,481,019 985,923 1,100,688 287,670 2,089,327 (2,474,586) 6,470,041
Borrowings and financial debt (excluding lease liabilities) 1,448,333 180,868 460,330   1,577   2,091,108
Cash and cash equivalents 475,216 84,148 44,430   201,113   804,907
Net financial debt 973,117 96,720 415,900   (199,536)   1,286,201
Investments 140,592 73,939 43,569   316   258,416
      Reconciliation
31/12/2021
(in thousands of euros)
Retail &
Marketing
Support &
Services
Rubis
Terminal
(JV)
Parent
company
Eliminations Total
Fixed assets 2,335,184 441,516   26,433 (36,571) 2,766,562
Equity interests 416,992 1,636   1,010,531 (1,354,869) 74,290
Interests in joint ventures 17,634   304,537     322,171
Deferred tax assets 7,492 5,421       12,913
Segment assets 1,419,464 361,276   1,085,754 (779,906) 2,086,588
Total assets 4,196,766 809,849 304,537 2,122,718 (2,171,346) 5,262,524
Consolidated equity 1,281,115 477,756 304,537 2,038,228 (1,365,271) 2,736,365
Financial debt 1,346,725 126,531   1,849   1,475,105
Deferred tax liabilities 347 1,006   61,718   63,071
Segment liabilities 1,568,579 204,556   20,923 (806,075) 987,983
Total liabilities 4,196,766 809,849 304,537 2,122,718 (2,171,346) 5,262,524
Borrowings and financial debt (excluding lease liabilities) 1,202,529 108,810   1,849   1,313,188
Cash and cash equivalents 428,077 71,793   375,020   874,890
Net financial debt 774,452 37,017   (373,171)   438,298
Investments 159,135 46,458   89   205,682

6.2     Breakdown by region (after elimination of intersegment transactions)

        Reconciliation
31/12/2022
(in thousands of euros)
Europe Caribbean Africa Rubis
Terminal
(JV)
Parent
company
Total
Revenue 865,167 3,601,748 2,667,679   134 7,134,728
EBITDA 113,238 327,959 256,832   (28,535) 669,494
EBIT 57,003 262,188 219,910   (30,087) 509,014
Operating income after share of net income from joint ventures 35,362 222,289 220,173 4,656 (25,870) 456,610
Investments 77,598 122,446 58,056   316 258,416
        Reconciliation
31/12/2021
(in thousands of euros)
Europe Caribbean Africa Rubis
Terminal
(JV)
Parent
company
Total
Revenue 681,726 2,229,026 1,678,447   247 4,589,446
EBITDA 105,469 261,826 184,029   (19,027) 532,297
EBIT 70,959 189,970 151,012   (20,113) 391,828
Operating income after share of net income from joint ventures 72,559 190,262 155,426 4,653 (20,364) 402,536
Investments 30,392 92,608 82,593   89 205,682

As of 31 December 2022, revenue generated in France (including Overseas territories) amounted to €2,294 million.

As of 31 December 2022, revenue generated in Kenya amounted to €996 million.

        Reconciliation  
31/12/2022
(in thousands of euros)
Europe Caribbean Africa Rubis
Terminal
(JV)
Parent
company
Total
Fixed assets 1,667,990 1,087,106 1,052,857   25,918 3,833,871
Equity interests 3,280 6,833 273   52,921 63,307
Interests in joint ventures 17,457     287,670   305,127
Deferred tax assets 6,854 5,375 6,682     18,911
Segment assets 281,285 798,664 953,018   215,858 2,248,825
TOTAL ASSETS 1,976,866 1,897,978 2,012,830 287,670 294,697 6,470,041
        Reconciliation  
31/12/2021
(in thousands of euros)
Europe Caribbean Africa Rubis
Terminal
(JV)
Parent
company
Total
Fixed assets 631,937 1,065,205 1,042,987   26,433 2,766,562
Equity interests 69,449 4,582 259     74,290
Interests in joint ventures 17,634     304,537   322,171
Deferred tax assets 670 8,037 4,206     12,913
Segment assets 221,930 693,785 784,989   385,884 2,086,588
TOTAL ASSETS 941,620 1,771,609 1,832,441 304,537 412,317 5,262,524

As of 31 December 2022, non-current assets held in France (including overseas territories) amounted to €1,799 million.

Non-current assets held in Kenya amounted to €396 million.

Note 7.    Non-controlling interests


As of 31 December 2022, the primary non-controlling interests are calculated for the following entities or sub-groups:

SARA

The Group consolidates the 71%-owned SARA using the full consolidation method; the 29% non-controlling interests are held by Sol Petroleum Antilles SAS.

EASIGAS ENTITIES

The Easigas entities are consolidated using the full consolidation method, with the Group owning an interest of 55%.

PHOTOSOL ENTITIES

Since 1st April 2022, the Group uses the full consolidation method to consolidate the Photosol entities (France), some of which are less than 100% owned (see scope of consolidation in note 12).

7.1    Condensed financial information – subsidiary with non-controlling interests: SARA

The amounts presented below are before the elimination of intercompany transactions and accounts:

(in thousands of euros)   31/12/2022   31/12/2021
Fixed assets   224,999   227,845
Net financial debt (cash and cash equivalents – liabilities)   (126,154)   (65,954)
Current liabilities (including loans due in less than one year and short-term bank borrowings)   259,075   167,784
(in thousands of euros)   31/12/2022   31/12/2021
Net revenue   1,345,675   787,637
Total net income   17,475   16,735
•   Group share   12,169   11,404
•   share attributable to non-controlling interests   5,306   5,331
Other comprehensive income   7,064   2,471
•   Group share   5,015   1,754
•   share attributable to non-controlling interests   2,049   717
Comprehensive income for the period   24,539   19,206
•   Group share   17,184   13,158
•   share attributable to non-controlling interests   7,355   6,048
Dividends paid to non-controlling interests   6,825   6,798
Cash flows related to operating activities   (9,254)   16,005
Cash flows related to investing activities   (24,496)   (27,609)
Cash flows related to financing activities   39,704   6,291
Change in cash and cash equivalents   5,954   (5,313)

7.2    Condensed financial information – subsidiary with non-controlling interests: Easigas SA and its subsidiaries

The amounts presented below are before the elimination of intercompany transactions and accounts:

(in thousands of euros)   31/12/2022   31/12/2021
Fixed assets   80,706   72,519
Net financial debt (cash and cash equivalents – liabilities)   2,215   2,454
Current liabilities (including loans due in less than one year and short-term bank borrowings)   15,123   16,571
(in thousands of euros)   31/12/2022   31/12/2021
Net revenue   186,730   153,541
Total net income   14,712   11,333
•   Group share   8,016   6,019
•   share attributable to non-controlling interests   6,696   5,314
Other comprehensive income        
•   Group share        
•   share attributable to non-controlling interests        
Comprehensive income for the period   14,712   11,333
•   Group share   8,016   6,019
•   share attributable to non-controlling interests   6,696   5,314
Dividends paid to non-controlling interests   3,347   4,915
Cash flows related to operating activities   18,133   13,922
Cash flows related to investing activities   (12,548)   (11,182)
Cash flows related to financing activities   (6,228)   (8,043)
Impact of exchange rate changes   (158)   (669)
Change in cash and cash equivalents   (801)   (5,972)

7.3    Condensed financial information – subsidiary with non-controlling interests: Photosol (France) and its subsidiaries

The amounts presented below are before the elimination of intercompany transactions and accounts:

(in thousands of euros)   31/12/2022
Fixed assets   406,275
Net financial debt (cash and cash equivalents – liabilities)   (417,213)
Current liabilities (including loans due in less than one year and short-term bank borrowings)   106,545
(in thousands of euros)   31/12/2022
(9 months)
Net revenue   32,558
Total net income   (25,860)
•   Group share   (20,444)
•   share attributable to non-controlling interests   (5,416)
Other comprehensive income   25,411
•   Group share   16,945
•   share attributable to non-controlling interests   8,466
Comprehensive income for the period   (449)
•   Group share   (3,499)
•   share attributable to non-controlling interests   3,050
Dividends paid to non-controlling interests   1
Cash flows related to operating activities   24,928
Cash flows related to investing activities   (44,105)
Cash flows related to financing activities   (3,378)
Change in cash and cash equivalents   (22,555)

Note 8.   Interests in joint operations

Group interests in joint operations were not material as of 31 December 2022.

Note 9.   Interests in joint ventures


Accounting policies

These interests, which are consolidated by the equity method, involve joint ventures and companies in which the Group has significant influence. They are initially recognised at acquisition cost, including any goodwill generated. Their net carrying amount is then increased or decreased to recognise the Group share of the entity’s profits or losses after the date of acquisition. Whenever losses are greater than the value of the Group’s net investment in the equity method, these losses are not recognised unless the Group has entered into a commitment to recapitalise the entity or provide it with funding.

If there is an indication that an investment may be impaired, its recoverable value is tested as described in note 4.2. Impairment losses shown by these impairment tests are recognised as a deduction from the net carrying amount of the corresponding interests.

The Group classifies two partnerships (Rubis Terminal and CLC) as joint ventures within the meaning of IFRS 11. As of 31 December 2022, the Group’s interest in Rubis Terminal amounted to €287.7 million. The interest in CLC amounted to €17.5 million. Only data relating to Rubis Terminal are considered material and detailed below.

The amounts presented below are prepared as if Rubis Terminal were fully consolidated.

CONDENSED FINANCIAL INFORMATION – RUBIS TERMINAL JV

Statement of financial position of joint ventures
(in thousands of euros)
  31/12/2022   31/12/2021
Current assets   198,145   205,085
Non-current assets   1,445,205   1, 441,911
TOTAL ASSETS   1,643,350   1,646,996
Current liabilities   136,114   189,181
Non-current liabilities   955,377   874,141
Non-controlling interests   29,392   29,806
TOTAL LIABILITIES   1,120,883   1,093,128

The current assets and liabilities of the joint ventures specifically include the following:

(in thousands of euros)   31/12/2022   31/12/2021
Cash and cash equivalents   66,978   40,704
Current financial liabilities (excl. trade payables and provisions)   30,232   61,931
Non-current financial liabilities (excl. provisions)   867,956   788,930

The items in the income statement are as follows:

(in thousands of euros)   31/12/2022   31/12/2021
Net revenue   462,434   380,840
Total net income, Group share (before IFRS 2 expense)   8,124   8,354
Total net income, Group share (consolidated share)   4,656   4,653
Other comprehensive income (consolidated share)   11,125   2,267
COMPREHENSIVE INCOME FOR THE PERIOD (CONSOLIDATED SHARE)   15,781   6,920

Net income for the period given above includes the following items:

(in thousands of euros)   31/12/2022   31/12/2021
Depreciation expense   (67,153)   (67,978)
Interest income and expense   (49,096)   (41,029)
Income tax   74   (7,454)

The Group received dividends of €33 million for the period.

Note 10.    Other information


10.1  Financial commitments


COMMITMENTS GIVEN AND RECEIVED

(in thousands of euros)   31/12/2022   31/12/2021
Liabilities secured   701,942   145,409
Commitments given   680,087   315,889
Guarantees and securities   631,264   315,889
Other commitments given   48,823    
Commitments received   568,994   764,581
Confirmed credit facilities   530,959   732,429
Guarantees and securities   30,585   32,152
Other   7,450    

The guarantees and securities given mainly concern:

•   bank guarantees granted on loans obtained by the Group’s subsidiaries;

•   guarantees required by suppliers of petroleum products;

•   guarantees given to customs authorities;

•   environmental guarantees.

Guarantees and securities received largely concern guarantees obtained from customers located in the Caribbean zone.

As of 31 December 2022, the Group had interest rate hedging agreements (caps and floors) in the amount of €882 million on a total of €1,207 million in variable-rate debt representing 73% of that amount.

As part of its acquisition and disposal transactions concerning subsidiaries, the Group gives or receives guarantees on liabilities, with no specific duration or amount.

10.2  Contractual obligations and trade commitments

    Payments due by period  
Contractual obligations as of 31/12/2022
(in thousands of euros)
Total Less than
1 year
Between 1
and 5 years
More than
5 years
Bank loans 1,521,727 267,487 959,664 294,576
Letters of credit 98,919 98,919    
Finance lease commitments 136 9 43 84
Operating leases 2,371 428 1,326 617
Other long-term commitments 220 80 140  
TOTAL 1,623,373 366,923 961,173 295,277

Commercial commitments made or received by the Group are not significant.

10.3  Transactions with related parties

SENIOR MANAGER COMPENSATION

The fixed compensation of the Management Board is governed by Article 54 of the by-laws. It totalled €2,770 thousand for the financial year, including compensation due to the Management Board of the parent company (€2,408 thousand, for which the corresponding social security contributions are entirely borne by the Managing Partners) and compensation due for Management functions in the subsidiaries (i.e., €362 thousand gross).

Shareholders’ and General Partners’ Meetings of 9 June 2022 (17th resolution) approved the compensation policy for the Management Board for the financial year 2022. This included an annual variable portion, the terms of which are described in chapter 5 of the 2021 Universal Registration Document. The annual variable compensation of the Management Board for the financial year 2022 was not subject to a provision, as the triggering condition had not been met.

Compensation paid to members of the parent company’s Supervisory Board totalled €225 thousand in respect of financial year 2022.

10.4  Climate risks

The Group’s main risks related to climate change stem from both a physical risk and a transition risk.

The physical risk relates to the occurrence of extreme events, the intensity of which tends to increase and which could, on the one hand, damage the integrity of the sites and, on the other hand, disrupt the operations of the subsidiaries in question, and in turn cause operating losses. The Group observes that the financial impact of deteriorations directly related to extreme weather events, such as the latest cyclones in the Caribbean, have had a moderate impact on results. The geographical diversification and broadening of the Group’s scope, as well as the non-material nature of its sites individually, greatly limit exposure to climatic hazards that may occur in a given area. The new Renewable Electricity Production division, integrated into the Group since April 2022, is currently concentrated in France and thus less exposed to extreme weather events.

Rubis is also exposed to the challenges of its sector in terms of energy transition. Occasionally rapid shifts in the regulatory environment and policies in support of a low-carbon economy could impose a significant reduction in CO2 emissions and make other less carbon-intensive energies more competitive in the long term. The short-term impact of climate risk is considered low to moderate depending on the products and regions concerned and, to date, to have had no material impact on the Group’s consolidated financial statements. Through the acquisition of a Renewable Electricity Production activity, the Group aims to reduce its exposure to this type of risk.

These risks are managed by the Climate Committee in conjunction with the various subsidiaries and functional departments, with the support of specialised consultants.

The Group has taken into consideration the impacts of potential climate challenges and the consequences of its 2030 ambition as identified to date in connection with the closing of the financial statements as of 31 December 2022. In particular, the Group has:

•   considered the short-term effects of commitments made in determining the recoverable value of goodwill (see note 4.2);

•   considered external market data in setting the long-term growth rate taken into account in determining the recoverable value of goodwill;

•   considered climate risks in the assessment of other provisions (see note 4.11).

To date, the Group has not identified any indication of impairment of its fixed assets and the impact related to climate challenges had no material impact on the Group’s financial statements as of 31 December 2022.

10.5  Fees paid to Statutory Auditors

Fees paid to the Statutory Auditors and members of their networks in respect of 2022 and 2021 break down as follows:

  PricewaterhouseCoopers Audit KPMG
  Amount (excl. tax) % Amount (excl. tax) %
(in thousands of euros) 2022 2021 2022 2021 2022 2021 2022 2021
Certification of financial statements                
Audit, certification and examination of the consolidated and separate financial statements:                
•   issuer 465 370 24% 23% 525   38%  
•   fully consolidated subsidiaries 1,254 1,111 65% 70% 766   56%  
Sub-total 1,719 1,481 88% 93% 1,291   94%  
Services other than certification of financial statements                
•   issuer 57 5 3% 0%        
•   fully consolidated subsidiaries 167 101 9% 6% 76   6%  
Sub-total 224 106 12% 7% 76   6%  
TOTAL 1,943 1,587 100% 100% 1,367   100%  
  Mazars Monnot & Associés*
  Amount (excl. tax) % Amount (excl. tax) %
(in thousands of euros) 2022 2021 2022 2021 2022 2021 2022 2021
Certification of financial statements                
Audit, certification and examination of the consolidated and separate financial statements:                
•   issuer   305   32% 150     80%
•   fully consolidated subsidiaries   580   60% 38     20%
Sub-total   885   92% 188     100%
Services other than certification of financial statements                
•   issuer   60   6%        
•   fully consolidated subsidiaries   16   2%        
Sub-total   76   8%        
TOTAL   961   100% 188     100%


* The terms of office of Mazars and Monnot & Associés expired at the end of the Combined Shareholders’ Meeting of 9 June 2022 and could no longer be renewed.

Services other than the certification of financial statements mainly relate to the issuing of certifications (financial covenants, CSR, etc.).

Note 11.    Events after the reporting period


There were no events after the reporting period that could have a material impact on the consolidated financial statements as of 31 December 2022.

Note 12. List of consolidated companies as of 31 December 2022

The consolidated financial statements for the year ended 31 December 2022 include the Rubis SCA financial statements and those of its subsidiaries listed in the table below.

Name Registered office/
Country
31/12/2022
% control
31/12/2021
% control
31/12/2022
% interest
31/12/2021
% interest
Consolidation
method(1)
Rubis SCA 46, rue Boissière 75116 Paris – France SIREN: 784 393 530 Parent Parent Parent Parent  
Rubis Patrimoine France 100.00% 100.00% 100.00% 100.00% FC
Coparef France 100.00% 100.00% 100.00% 100.00% FC
Rubis Renouvelables (formerly Cimarosa Investissements) France 100.00% 100.00% 100.00% 100.00% FC
Rubis HyDev France 100.00%   100.00%   FC
RT Invest France 55.00% 55.00% 55.00% 55.00% JV (EM)
Rubis Terminal Infra France 55.00% 55.00% 55.00% 55.00% JV (EM)
Rubis Énergie France 100.00% 100.00% 100.00% 100.00% FC
Vitogaz France France 100.00% 100.00% 100.00% 100.00% FC
Sicogaz France 100.00% 100.00% 100.00% 100.00% FC
Sigalnor France 65.00% 65.00% 65.00% 65.00% FC
Starogaz France 100.00% 100.00% 100.00% 100.00% FC
Norgal France 20.94% 20.94% 20.94% 20.94% JO
Frangaz France 100.00% 100.00% 100.00% 100.00% FC
Vito Corse France 100.00% 100.00% 100.00% 100.00% FC
GRD3A France 100.00%   100.00%   FC
Rubis Restauration et Services France 100.00% 100.00% 100.00% 100.00% FC
Vitogaz Switzerland AG Switzerland 100.00% 100.00% 100.00% 100.00% FC
Rubis Energia Portugal SA Portugal 100.00% 100.00% 100.00% 100.00% FC
Sodigas Seixal Sociedade de Distribuição de Gás SA Portugal 100.00% 100.00% 100.00% 100.00% FC
Sodigas Açores SA Portugal 100.00% 100.00% 100.00% 100.00% FC
Sodigas Braga Sociedade de Distribuição de Gás, SA Portugal 100.00% 100.00% 100.00% 100.00% FC
Spelta – Produtos Petrolíferos SA Portugal 100.00% 100.00% 100.00% 100.00% FC
Companhia Logística de Combustíveis SA Portugal 20.00% 20.00% 20.00% 20.00% JV (EM)
Vitogas España SA Spain 100.00% 100.00% 100.00% 100.00% FC
Fuel Supplies Channel Islands Ltd (FSCI) Channel Islands 100.00% 100.00% 100.00% 100.00% FC
La Collette Terminal Ltd Channel Islands 100.00% 100.00% 100.00% 100.00% FC
St Sampson Terminal Ltd Channel Islands 100.00% 100.00% 100.00% 100.00% FC
Vitogaz Maroc Morocco 100.00% 100.00% 100.00% 100.00% FC
Lasfargaz Morocco 82.89% 82.89% 82.89% 82.89% FC
Kelsey Gas Ltd Republic of Mauritius 100.00% 100.00% 100.00% 100.00% FC
Vitogaz Madagascar Madagascar 100.00% 100.00% 100.00% 100.00% FC
Eccleston Co Ltd Republic of Mauritius 100.00% 100.00% 100.00% 100.00% FC
Vitogaz Comores Union of the Comoros Islands 100.00% 100.00% 100.00% 100.00% FC
Gazel Madagascar 49.00% 49.00% 49.00% 49.00% FC(2)
Rubis Antilles Guyane France 100.00% 100.00% 100.00% 100.00% FC
Stocabu France 50.00% 50.00% 50.00% 50.00% JO
Société Industrielle de Gaz et de Lubrifiants France 100.00% 100.00% 100.00% 100.00% FC
Société Anonyme de la Raffinerie des Antilles (SARA) France 71.00% 71.00% 71.00% 71.00% FC
Société Antillaise des Pétroles Rubis France 100.00% 100.00% 100.00% 100.00% FC
Rubis Guyane Française France 100.00% 100.00% 100.00% 100.00% FC
Rubis Caraïbes Françaises France 100.00% 100.00% 100.00% 100.00% FC
Société Réunionnaise de Produits Pétroliers (SRPP) France 100.00% 100.00% 100.00% 100.00% FC
Société d’importation et de distribution de Gaz liquéfiés dans l’Océan Indien (Sigloi) France 100.00% 100.00% 100.00% 100.00% FC
Rubis Energy Bermuda Ltd Bermuda 100.00% 100.00% 100.00% 100.00% FC
Sinders Ltd Bermuda 100.00% 100.00% 100.00% 100.00% FC
Bermuda Gas & Utility Company Ltd Bermuda 100.00% 100.00% 100.00% 100.00% FC
Rubis Eastern Caribbean SRL Barbados 100.00% 100.00% 100.00% 100.00% FC
Rubis Caribbean Holdings Inc. Barbados 100.00% 100.00% 100.00% 100.00% FC
Renewstable Barbados Barbados 51.00%   51.00%   FC
Rubis West Indies Ltd United Kingdom 100.00% 100.00% 100.00% 100.00% FC
Rubis Guyana Inc. Guyana 100.00% 100.00% 100.00% 100.00% FC
Rubis Bahamas Ltd The Bahamas 100.00% 100.00% 100.00% 100.00% FC
Rubis Cayman Islands Ltd Cayman Islands 100.00% 100.00% 100.00% 100.00% FC
Rubis Turks & Caicos Ltd Turks and Caicos Islands 100.00% 100.00% 100.00% 100.00% FC
Rubis Energy Jamaica Ltd Jamaica 100.00% 100.00% 100.00% 100.00% FC
Easigas (Pty) Ltd South Africa 55.00% 55.00% 55.00% 55.00% FC
Easigas Botswana (Pty) Ltd Botswana 55.00% 55.00% 55.00% 55.00% FC
Easigas Swaziland (Pty) Ltd Swaziland 55.00% 55.00% 55.00% 55.00% FC
Easigas Lesotho (Pty) Ltd Lesotho 55.00% 55.00% 55.00% 55.00% FC
Rubis Asphalt South Africa South Africa 74.00% 74.00% 74.00% 74.00% FC
Ringardas Nigeria Ltd Nigeria 100.00% 100.00% 100.00% 100.00% FC
European Railroad Established Services SA (Eres Sénégal) Senegal 100.00% 100.00% 100.00% 100.00% FC
European Railroad Established Services Togo SA (Eres Togo) Togo 100.00% 100.00% 100.00% 100.00% FC
Eres Cameroun Cameroon 100.00% 100.00% 100.00% 100.00% FC
Eres Libéria Inc. Republic of Liberia 100.00% 100.00% 100.00% 100.00% FC
Eres Gabon Gabon 100.00% 100.00% 100.00% 100.00% FC
REC Bitumen SRL Barbados 100.00% 100.00% 100.00% 100.00% FC
Bahama Blue Shipping Company Barbados 100.00% 100.00% 100.00% 100.00% FC
Morbihan Shipping Corporation Barbados 100.00% 100.00% 100.00% 100.00% FC
Bitu River Shipping Corp. Panama 100.00%   100.00%   FC
Demerara Shipping Corp. Barbados 100.00%   100.00%   FC
Pickett Shipping Corp. Republic of Panama 100.00% 100.00% 100.00% 100.00% FC
Blue Round Shipping Corp. Republic of Panama 100.00% 100.00% 100.00% 100.00% FC
Saunscape International Inc. (liquidated) Republic of Panama   100.00%   100.00% FC
Biskra Shipping SA Republic of Panama 100.00% 100.00% 100.00% 100.00% FC
Atlantic Rainbow Shipping Company SA Republic of Panama 100.00% 100.00% 100.00% 100.00% FC
Woodbar Co Ltd Republic of Mauritius 85.00% 85.00% 85.00% 85.00% FC
Rubis Énergie Djibouti Republic of Djibouti   85.00% 85.00% 85.00% 85.00% FC
Distributeurs Nationaux SA (Dinasa) Haiti 100.00% 100.00% 100.00% 100.00% FC
Chevron Haïti Inc. British Virgin Islands 100.00% 100.00% 100.00% 100.00% FC
Société de Distribution de Gaz SA (Sodigaz) Haiti 100.00% 100.00% 100.00% 100.00% FC
Terminal Gazier de Varreux SA Haiti 50.00% 50.00% 50.00% 50.00% JO
RBF Marketing Ltd Jamaica 100.00% 100.00% 100.00% 100.00% FC
Galana Distribution Pétrolière Company Ltd Republic of Mauritius 100.00% 100.00% 100.00% 100.00% FC
Galana Distribution Pétrolière SA Madagascar 90.00% 90.00% 90.00% 90.00% FC
Galana Raffinerie Terminal Company Ltd Republic of Mauritius 100.00% 100.00% 100.00% 100.00% FC
Galana Raffinerie et Terminal SA Madagascar 90.00% 90.00% 90.00% 90.00% FC
Plateforme Terminal Pétrolier SA Madagascar 80.00% 80.00% 80.00% 80.00% FC
Rubis Middle East Supply DMCC United Arab Emirates 100.00% 100.00% 100.00% 100.00% FC
Rubis Asphalt Middle East DMCC United Arab Emirates 100.00% 100.00% 100.00% 100.00% FC
Maritec Tanker Management Private Ltd India 100.00% 100.00% 100.00% 100.00% FC
Gulf Energy Holdings Ltd Kenya 100.00% 100.00% 100.00% 100.00% FC
Rubis Energy Kenya PLC Kenya 100.00% 100.00% 100.00% 100.00% FC
Kobil Petroleum Limited United States 100.00% 100.00% 100.00% 100.00% FC
Rubis Energy Ethiopia Ltd Ethiopia 100.00% 100.00% 100.00% 100.00% FC
Rubis Energy Rwanda Ltd Rwanda 100.00% 100.00% 100.00% 100.00% FC
Rubis Energy Uganda Ltd Uganda 100.00% 100.00% 100.00% 100.00% FC
Rubis Energy Zambia Ltd Zambia 100.00% 100.00% 100.00% 100.00% FC
Rubis Energy Zimbabwe (Private) Ltd Zimbabwe 55.00% 55.00% 55.00% 55.00% FC
Rubis Photosol France 79.97%   79.97%   FC
Aedes & Photosol Développement France 39.99%   39.99%   JV (EM)
Airefsol Énergies 1 France 67.88%   67.88%   FC
Airefsol Énergies 7 France 67.88%   67.88%   FC
Alpha Énergies Renouvelables France 66.22%   66.22%   FC
Centrale Photovoltaïque de Ychoux France 47.78%   47.78%   FC(2)
Centrale Photovoltaïque Lagune de Toret France 67.88%   67.88%   FC
Centrale Photovoltaïque le Bouluc de Fabre France 67.88%   67.88%   FC
Cilaos France 67.88%   67.88%   FC
Clotilda France 67.88%   67.88%   FC
Cpes de L’Ancienne Cokerie France 67.88%   67.88%   FC
Dynamique Territoires Développement France 79.97%   79.97%   FC
EPV France 67.88%   67.88%   FC
Euroridge Solar Holding SARL Luxembourg 79.97%   79.97%   FC
Firinga France 67.88%   67.88%   FC
Inti SAS France 67.88%   67.88%   FC
Maïdo France 67.88%   67.88%   FC
Phoebus France 67.88%   67.88%   FC
Photom Services France 45.95%   45.95%   FC(2)
Photosol France 67.88%   67.88%   FC
Photosol Bordezac Développement France 67.88%   67.88%   FC
Photosol Bourbon France 67.88%   67.88%   FC
Photosol Brossac France 66.52%   66.52%   FC
Photosol CRE 4 France 67.88%   67.88%   FC
Photosol Développement France 79.97%   79.97%   FC
Photosol Hermitage France 79.97%   79.97%   FC
Photosol Invest 2 France 28.48%   28.48%   FC(2)
Photosol Maransin France 79.97%   79.97%   FC
Photosol Roullet France 79.97%   79.97%   FC
Photosol Sarrazac Développement France 67.88%   67.88%   FC
Photosol SPV 1 France 67.88%   67.88%   FC
Photosol SPV 2 France 67.88%   67.88%   FC
Photosol SPV 3 France 67.88%   67.88%   FC
Photosol SPV 4 France 67.88%   67.88%   FC
Photosol SPV 5 France 67.88%   67.88%   FC
Photosol SPV 6 France 67.88%   67.88%   FC
Photosol SPV 7 France 67.88%   67.88%   FC
Photosol SPV 9 France 48.83%   48.83%   FC(2)
Photosol SPV 10 France 67.88%   67.88%   FC
Photosol SPV 13 France 67.88%   67.88%   FC
Photosol SPV 14 France 67.88%   67.88%   FC
Photosol SPV 15 France 45.55%   45.55%   FC(2)
Photosol SPV 16 France 67.88%   67.88%   FC
Photosol SPV 18 France 67.88%   67.88%   FC
Photosol SPV 22 France 67.88%   67.88%   FC
Photosol SPV 27 France 65.51%   65.51%   FC
Photosol SPV 28 France 67.88%   67.88%   FC
Photosol SPV 29 France 79.97%   79.97%   FC
Photosol SPV 31 France 79.97%   79.97%   FC
Photosol SPV 32 France 62.85%   62.85%   FC
Photosol SPV 33 France 67.88%   67.88%   FC
Photosol SPV 34 France 61.71%   61.71%   FC
Photosol SPV 35 France 67.88%   67.88%   FC
Photosol SPV 36 France 57.04%   57.04%   FC
Photosol SPV 37 France 62.27%   62.27%   FC
Photosol SPV 38 France 79.97%   79.97%   FC
Photosol SPV 39 France 55.64%   55.64%   FC
Photosol SPV 40 France 79.97%   79.97%   FC
Photosol SPV 43 France 58.01%   58.01%   FC
Photosol SPV 44 France 79.97%   79.97%   FC
Photosol SPV 45 France 79.97%   79.97%   FC
Photosol SPV 46 France 79.97%   79.97%   FC
Photosol SPV 48 France 79.97%   79.97%   FC
Photosol SPV 49 France 79.97%   79.97%   FC
Photosol SPV 50 France 79.97%   79.97%   FC
Photosol SPV 51 France 79.97%   79.97%   FC
Photosol SPV 52 France 79.97%   79.97%   FC
Photosol SPV 53 France 79.97%   79.97%   FC
Photosol SPV 54 France 79.97%   79.97%   FC
Photosol SPV 55 France 79.97%   79.97%   FC
Photosol SPV 56 France 79.97%   79.97%   FC
Photosol SPV 57 France 79.97%   79.97%   FC
Photosol SPV 58 France 79.97%   79.97%   FC
Photosol SPV 59 France 79.97%   79.97%   FC
Photosol SPV 60 France 79.97%   79.97%   FC
Photosol SPV 61 France 79.97%   79.97%   FC
Photosol SPV 63 France 79.97%   79.97%   FC
Photosol SPV 65 France 79.97%   79.97%   FC
Photosol Villefranche sur Cher Développement France 67.88%   67.88%   FC
PV Ecarpiere France 67.88%   67.88%   FC
Société du Parc Photovoltaïque de la Commanderie France 67.88%   67.88%   FC
Solaire du Lazaret France 67.88%   67.88%   FC
SPV 11 France 67.88%   67.88%   FC
SPV 12 France 67.88%   67.88%   FC
SPV 17 France 67.88%   67.88%   FC
SPV 25 France 67.88%   67.88%   FC
SPV 26 France 79.97%   79.97%   FC
SPV 30 France 53.71%   53.71%   FC
Territoires Énergies            
Nouvelles France 79.97%   79.97%   FC
Thorenc PV France 67.88%   67.88%   FC
Thorenc PV            
Holding SARL Luxembourg 79.97%   79.97%   FC
(1) FC: Full consolidation; JO: joint operations; JV: joint venture (EM); EM: equity method.
(2) See note 3.

Rubis Antilles Guyane holds a non-controlling interest in five economic interest groupings (EIG) in the French Antilles; as these entities are not material, they are not consolidated.

Rubis Energia Portugal, SARA and Photosol Développement currently hold non-material and non-consolidated interests.

In view of the political and monetary problems in Burundi, the Group has decided since 2019 not to consolidate Kobil Burundi due to the lack of effective control over this activity. The corresponding securities were fully impaired. The political and monetary situation did not improve in financial year 2022.

7.2 2022 separate financial statements and notes

Balance sheet

ASSETS

(in thousands of euros) Notes Gross Depreciation, amortisation and impairment Net 31/12/2022 Net 31/12/2021
Fixed assets          
Property, plant and equipment and intangible assets   2,404 1,250 1, 154 1,172
Equity interests 4.1 1,424,718   1,424,718 1,032,856
Other financial investments 4.2 2,194   2,194 2, 165
Total fixed assets (I)   1,429,316 1,250 1,428,066 1,036,193
Current assets          
Trade and other receivables 4.4 488,496 208 488,288 713,439
Investment securities 4.3 139,521 278 139,243 138,337
Cash   58,707   58,707 234,243
Prepaid expenses   223   223 178
Total current assets (II)   686,947 486 686,461 1,086,197
TOTAL ASSETS (I + II)   2,116,263 1,736 2,114,527 2,122,390

EQUITY AND LIABILITIES

(in thousands of euros)   Notes   31/12/2022   31/12/2021
Equity            
Share capital       128,692   128,177
Share premiums       1,550,120   1,547,236
Legal reserve       12,954   12,954
Restricted reserve       1,763   1,763
Other reserves       94,626   94,626
Retained earnings       128,948   165,359
Earnings for the financial year       187,183   154,649
Regulated provisions       1,242   1,043
Total equity (I)   4.5   2,105,528   2,105,807
Provisions for contingencies and expenses (II)       710   376
Liabilities            
Bank loans       169   441
Trade and other payables       716   847
Taxes and social security payables       4,274   2,364
Other liabilities       3,130   12,555
Total liabilities (III)   4.6   8,289   16,207
TOTAL EQUITY AND LIABILITIES (I + II + III)       2,114,527   2,122,390

Income statement

(in thousands of euros)   Notes   31/12/2022   31/12/2021
Sales of services       12,461   2,972
Other income and expense transfers           8
Operating income       12,461   2,980
Other purchases and external expenses       (15,054)   (7,113)
Taxes, duties and similar payments       (332)   (296)
Employee benefits expense       (7,081)   (5,381)
Additions to depreciation of non-current assets       (195)   (180)
Additions to and reversals of provisions for contingencies and expenses       (334)   (77)
Other expenses       (2,641)   (2,635)
Operating expenses       (25,637)   (15,682)
Profit (loss) from operating activities       (13,176)   (12,702)
Finance income from equity interests       193,785   156,204
Finance income from other securities       1,247   903
Other interest income       1,859   192
Net income from disposal of marketable securities       (40)   (613)
Additions to financial provisions       (278)   (7)
Reversals of financial provisions       7   1,725
Interest and similar expenses       (969)   (2,308)
Net finance income/(expense)       195,611   156,096
Profit (loss) from ordinary activities before tax       182,435   143,394
Extraordinary items   5.1   3,652   (251)
Income tax   5.2   1,096   11,506
TOTAL NET INCOME       187,183   154,649

Statement of cash flows

(in thousands of euros)   31/12/2022   31/12/2021
Operating activity        
Profit (loss) for the period   187,183   154,649
Depreciation, amortisation and provisions   1,208   (1,212)
Capital gains or losses on disposals of non-current assets   (4,060)   3
Cash flow (A)   184,331   153,440
Change in working capital requirement (B):   217,250   (133,830)
•  trade and other receivables   224,896   (130,851)
•  trade and other payables   (7,646)   (2,979)
Operating cash flows (A+B) (I)   401,581   19,610
Investments        
Acquisitions of equity interests:        
•  Rubis Renouvelables   (392,110)    
Acquisition expenses on securities (ongoing project)       (248)
Disposals of equity interests:        
•  Rubis Terminal division   4,063    
Other   40   (61)
Cash flow allocated to investments (II)   (388,007)   (309)
Cash flow from operating activities (I+II)   13,574   19,306
Financing        
Increase/(decrease) in financial debt   (272)   216
Increase (decrease) in equity   3,400   (146,165)
Dividend paid   (191,061)   (83,577)
Cash from financing activities (III)   (187,933)   (229,526)
Overall change in cash flow (I + II + III)   (174,359)   (210,225)
Opening cash and cash equivalents   372,587   582,812
Overall change in cash flow   (174,359)   (210,225)
Closing cash and cash equivalents   198,228   372,587
Financial debt   (169)   (441)
CLOSING CASH AND CASH EQUIVALENTS NET OF FINANCIAL DEBT   198,059   372,146

Notes to the separate financial statements as of 31 December 2022

Note 1.    Presentation of the Company

Rubis SCA is a Partnership Limited by Shares registered and domiciled in France. Its registered office is located at 46, rue Boissière 75116 Paris, France.

Rubis SCA is a parent holding company of the Rubis Group (“the Group”).

The Rubis Group operates three activities in the energy sector:

•   the Retail & Marketing activity, which specialises in the distribution of fuels (in service stations or to professionals), lubricants, liquefied gas and bitumen;

•   the Support & Services activity, which houses all infrastructure, transport, supply and services activities that support the development of downstream retail and marketing activities;

•   the Renewable Electricity Production division (Rubis Renouvelables), developed since April 2022 with the acquisition of 80% of Photosol, one of the main independent producers of photovoltaic electricity in France.;

Rubis SCA also holds an equity interest in the Rubis Terminal joint venture, which specialises in Bulk Liquid Storage (fuels, chemicals and agrifood products) for commercial and industrial customers.

The Group is present in Europe, Africa and the Caribbean.

Note 2.    Significant events of the financial year


ACQUISITION OF PHOTOSOL FRANCE

On 14 April 2022, Rubis completed the acquisition of 80% of Photosol (France), one of the independent leaders in photovoltaic energy in France. This acquisition forms the basis for the development of the Group’s renewable energy activities, alongside its historical activities.

Photosol (France) has a capacity of 384 MWp in operation, 119 MWp under construction, a project portfolio of more than 3.5 GWp at the end of December 2022, and has 112 employees in France. Retaining a 20% stake, Photosol’s founders and Senior Managers remain committed to the development of the company.

Note 3.    Accounting policies and rules


The financial statements as of 31 December 2022 have been prepared and presented in accordance with the accounting policies, standards and methods in force in France pursuant to the provisions of the general chart of accounts (PCG) (ANC Regulation 2014-03 on the PCG).

The accounting conventions for the preparation and presentation of the separate financial statements were applied in accordance with the principle of prudence, and the following basic assumptions:

•   going concern;

•   consistency of accounting policies from one financial year to the next;

•   independence of financial years.

Only significant information is mentioned in these notes.

The valuation rule used to prepare these financial statements is that of historical cost.

The annual financial statements of Rubis SCA are presented in thousands of euros.

3.1    Property, plant and equipment and intangible assets

Property, plant and equipment and intangible assets are valued at their acquisition cost.

Acquisition cost includes the purchase price, as well as all costs directly attributable to the acquisition of the non-current assets in question. Acquisition expenses (transfer taxes, fees, etc.) are recognised directly as expenses.

Depreciation is calculated according to the pattern of consumption of the economic benefits expected from the asset. In this respect, depreciation is calculated according to the straight-line method as follows:

    Duration
Intangible assets   1 to 10 years
Facilities and fixtures   4 to 10 years
Office equipment   3 to 10 years
Movable property   4 to 10 years

When a fixed asset is intended to be sold, or when it no longer has potential, it is tested only at its level. In this case, when its net carrying amount is significantly higher than its estimated present value, the net carrying amount of the asset is immediately impaired to its present value.

3.2    Equity Interests

Equity interests are recorded at their acquisition cost or contribution value. The Company has opted for the recognition of acquisition expenses in the cost price of equity interests.

At the end of the year, equity interests are estimated at their value in use, determined on the basis of a multi-criteria analysis taking into account, in particular, the share of the subsidiary’s equity that said securities represent, forecasts of future cash flows or market value. If their value in use is lower than their carrying amount, an impairment expense is recognised in net finance income/(expense).

3.3    Other financial investments

The main items included in this are Rubis SCA treasury shares held under a liquidity agreement.

Shares are recognised at purchase cost, which includes any acquisition expenses. In the event of disposal, the cost price of the shares sold is determined using the “First In – First Out” (FIFO) method.

3.4    Receivables and liabilities

Receivables and liabilities are valued at their nominal value.

Receivables are impaired when the present value, determined with regard to the risk of non-recovery, is lower than the carrying amount.

3.5    Investment securities

Investment securities are recognised at their acquisition cost. In the event of disposals of securities of the same kind giving the same rights, the cost of the securities disposed of is determined using the “First In – First Out” (FIFO) method.

At the end of each financial year, a provision for impairment is recognised if the carrying amount is higher than:

•   their market value for listed securities or units of UCITS;

•   their probable realisable value for negotiable debt securities.

3.6    Cash

Cash includes cash or equivalent bank securities.

Cash is valued at nominal value.

3.7     Pension obligations

The only pension commitments borne by the Company are employee retirement benefits, as legislation stipulates that benefits are paid to employees at the time of their retirement, depending on their length of service and their salary at retirement age. These retirement benefits are recognised as off-balance sheet commitments (note 6.2.1).

Pursuant to the amendment to ANC recommendation 2013-02 of 7 November 2013, amended on 5 November 2021, the Company decided to adopt the new method for allocating entitlements to its defined-benefit plans under which an indemnity is due only if the employee is present at the date of his/her retirement, the amount of which depends on seniority and is capped at a certain number of consecutive years of service. The impact of this change in accounting policy is a non-material decrease in the amount of the pension obligation.

The evaluation of the amount of retirement benefits in respect of Rubis SCA employees was determined using the projected unit credit method.

3.8    Provisions for contingencies and expenses

Provisions for contingencies and expenses are recognised when there is an obligation to a third party and it is likely that an outflow of resources will be necessary to settle the obligation, the amount of which can be estimated in a sufficiently reliable manner, in favour of said third party and with no counterparty of at least an equivalent amount expected in return.

Contingent liabilities are not recognised but are disclosed in the notes to the financial statements unless the probability of an outflow of resources is very low.

3.9    Revenue

Revenue mainly consists of management fees invoiced to subsidiaries.

These fees are recognised when the revenue is certain in principle and amount.

3.10    Tax calculation

Rubis SCA is the head of the tax consolidation group that it forms with its subsidiaries in France. Subsidiaries in the tax consolidation scope contribute to the tax expense of the consolidation group in the amount of tax they would have been liable for in the absence of consolidation. The additional income tax savings or expense, resulting from the difference between the tax due by the consolidated subsidiaries and the tax resulting from the determination of the overall result, is recorded by the Rubis SCA Group parent company.

3.11    Extraordinary items

Extraordinary income and expenses include the impact of major events that are not related to the Company’s current activity or that correspond to unusual, significant, and infrequent items.

3.12    Identity of the consolidating company

As of 31 December 2022, Rubis SCA (SIREN: 784 393 530) is the parent company for the preparation of the consolidated financial statements of the Rubis Group.

Note 4.    Notes relating to selected balance sheet items


4.1    Equity Interests

(in thousands of euros)   Net value as of 31/12/2022   Net value as of 31/12/2021
Equity interests   1,424,718   1,032,856
Impairment of securities        
TOTAL   1,424,718   1,032,856

As part of the acquisition of Photosol (see note 2), Rubis SCA subscribed to the capital increase of its subsidiary Rubis Renouvelables (formerly Cimarosa Investissements) in the amount of €392 million.

4.2    Other financial investments

The Shareholders’ Meeting authorises the Management Board annually, with the option to delegate such powers, to buy back the Company’s own shares in order to increase the liquidity or market activity of Rubis shares as part of a liquidity agreement, in compliance with the Association des Entreprises d’Investissement (French Association of Investment Companies) Code of Ethics.

As of 31 December 2022, Rubis SCA held 84,987 Rubis shares, representing a purchase price of €1,990 thousand. No impairment was recognised as of 31 December 2022.

Changes during the financial year were as follows:

(in thousands of euros) Gross value as of
31/12/2021
Acquisitions Disposals Gross value as of
31/12/2022
Treasury shares 1,949 13,111 (13,070) 1,990
TOTAL 1,949 13,111 (13,070) 1,990

4.3    Investment securities portfolio

As of 31 December 2022, the investment securities portfolio had a gross value of €139,521 thousand, and a net value of €139,243 thousand:

(in thousands of euros) Gross value as
of 31/12/2022
  Impairment Net value as
of 31/12/2022
Market value as
of 31/12/2022*
Net value as
of 31/12/2021
UCITS 23,858 (264) 23,594 23,595 23,921
Other funds 115,085 (14) 115,071 118,073 114,174
Interest receivable on other funds 578   578 578 242
TOTAL 139,521 (278) 139,243 142,246 138,337
* Estimated market value as of 31 December 2022.

4.4    Receivables

Trade and other receivables, amounting to €488,496 thousand, are all due in less than one year and break down as follows:

•   €474,568 thousand in intra-group receivables;

•   €13,615 thousand in receivables from the French Treasury. This item notably includes a tax settlement of €7,019 thousand that Rubis SCA expects to obtain from the tax authorities, €2,450 thousand in receivables related to the tax consolidation and €4,010 thousand relating to the VAT credit deferred to 31 December 2022;

•   €312 thousand in miscellaneous receivables.

4.5    Equity

STATEMENT OF CHANGES IN EQUITY

(in thousands of euros)   31/12/2022   31/12/2021
Equity at the beginning of the financial year   2,104,764   2,179,858
Capital increase (decrease)   515   (1,361)
Increase (decrease) in share premium   2,885   (46,666)
Dividend payment   (191,061)   (181,716)
Profit (loss) for the period   187,183   154,649
Equity at the end of the financial year*   2,104,286   2,104,764
* Excluding regulated provisions.

As of 31 December 2022, the share capital consisted of 102,953,566 fully paid-up shares, with a par value of €1.25 each, i.e., a total amount of €128,692 thousand.

As of 31 December 2022, Rubis SCA held 84,897 treasury shares.

The various transactions impacting the share capital in the period are set out in the table below:

  Number of shares Share capital
(in thousands of euros)
Share premium
(in thousands of euros)
As of 1st January 2022 102,541,281 128,177 1,547,236
Company savings plan 171,576 214 3,229
Preferred shares acquired 226    
Preferred shares converted into ordinary shares 244,431 306 (306)
Capital decrease by cancelling shares bought back (3,948) (5)  
Capital increase expenses     (39)
AS OF 31 DECEMBER 2022 102,953,566 128,692 1,550,120

EQUITY LINE AGREEMENT WITH CRÉDIT AGRICOLE CIB OF NOVEMBER 2021

In November 2021, the Group signed an equity line agreement with Crédit Agricole CIB for a period of 37 months and up to the authorised limit of 4,400,000 shares with a par value of €1.25. The share subscription price will show a discount of 5% compared to the volume-weighted average of the share prices of the two trading days preceding its setting. Crédit Agricole CIB acts as a financial intermediary and does not intend to remain in the Company’s share capital. As of 31 December 2022, the Group had not yet made use of this equity line.

STOCK OPTIONS AND SHARES FREE OF CHARGE

The terms of the stock-option and performance and preferred share plans outstanding as of 31 December 2022 are set out in the tables below:

Stock options
Date of Management Board
Outstanding as
of 31/12/2021
Rights issued Rights exercised Rights cancelled Outstanding as
of 31/12/2022
17 December 2019 150,276       150,276
6 November 2020 87,502       87,502
1st April 2021 5,616       5,616
TOTAL 243,394       243,394
           
Stock options
Date of Management Board
Number of
outstanding options
  Exercise
expiry date
Exercise price
(in euros)
Options
exercisable
17 December 2019 150,276   Mar.-33 52.04  
6 November 2020 87,502   Mar.-34 29.71  
1st April 2021 5,616   Mar.-34 40.47  
TOTAL 243,394        
           
Free performance shares
Date of Management Board
Outstanding as
of 31/12/2021
Rights issued Rights exercised Rights cancelled Outstanding as
of 31/12/2022
17 December 2019 385,759       385,759
6 November 2020 787,697       787,697
1st April 2021 43,516       43,516
13 December 2021 160,072       160,072
20 July 2022   514,770     514,770
TOTAL 1,377,044 514,770     1,891,814

The vesting period for beneficiaries’ free of charge shares is a minimum of three years from the date on which they are allocated by the Management Board. The conditions for awarding shares free of charge are set by the Management Board.

Free preferred shares
Date of Management Board
Outstanding as
of 31/12/2021
Rights
issued
Rights
exercised
Rights
cancelled
Outstanding as
of 31/12/2022
11 July 2016 2,469   (2,469)    
13 March 2017 1,932     (1,932)  
19 July 2017 374     (374)  
2 March 2018 345     (345)  
5 March 2018 1,157     (1,157)  
19 October 2018 140     (140)  
7 January 2019 62       62
17 December 2019 662     (662)  
TOTAL 7,141   (2,469) (4,610) 62

Preferred shares will be converted into ordinary shares at the end of a retention or vesting period based on the extent to which the performance conditions have been achieved.

4.6    Debt and expenses payable

Expenses payable totalled €4,224 thousand, breaking down as €290 thousand relating to suppliers, €169 thousand to accrued interest and €3,540 thousand to tax and social security payables. These expenses payable are operating expenses and finance expenses.

Trade payables recognised on the balance sheet, in a total amount of €427 thousand, all mature in less than three months. All other liabilities recognised on the balance sheet are due in less than one year.

4.7    Items concerning related companies

All transactions with related parties concern transactions carried out with subsidiaries wholly owned by Rubis SCA and are concluded under arm’s length conditions.

(in thousands of euros)   31/12/2022
Receivables   474,547
Liabilities   (3,163)
Income from investments   193,785

Note 5.  Notes related to selected income statement items

5.1   Extraordinary items

During January 2022, the Rubis Terminal JV sold its entire stake in its Turkish assets (Rubis Terminal Petrol). Following this transaction, and in accordance with the agreements signed, the Group received an earn-out payment of €4 million from the infrastructure fund I Squared Capital.

(in thousands of euros)   31/12/2022   31/12/2021
Disposals of non-current assets   4,065    
Other extraordinary income   1    
EXTRAORDINARY INCOME   4,066    
Net carrying amount of non-current assets disposed of   (6)   (3)
Other extraordinary expenses        
Additions to accelerated depreciation expenses   (200)   (248)
Extraordinary provisions   (208)    
EXTRAORDINARY EXPENSES   (414)   (251)

5.2   Income tax

(in thousands of euros) Tax base Rate Gross tax Credit Net tax
Corporation tax on extraordinary items at standard rate   25.83%   (636) (636)
Corporation tax calculated on expenses related to capital increases allocated to share premiums 53 25.83% 14   14
Tax refunds          
Expense (income) relating to tax consolidation     (474)   (474)
TOTAL     (460) (636) (1,096)

Rubis SCA is taxed under the system for parent companies and subsidiaries. Eligible dividends are subject to taxation on a share of fees and expenses amounting to 1% or 5%.

Rubis SCA has opted for the tax consolidation regime since 1st January 2001. The scope of consolidation is as follows:

DATE OF INCLUSION OF COMPANIES IN THE TAX CONSOLIDATION SCOPE AT THE REPORTING DATE

1st January 2001 Rubis
1st January 2006 Rubis Énergie
Rubis Antilles Guyane
SIGL
Sicogaz
Starogaz
1st January 2011 Frangaz
Vito Corse
1st January 2012 Société Antillaise des Pétroles Rubis (SAPR)
Rubis Guyane Française (RGF)
Rubis Caraïbes Françaises (RCF)
1st January 2013 Coparef
Vitogaz France
1st January 2014 Rubis Restauration et Services (RRS)
1st January 2016 Société Réunionnaise de Produits Pétroliers (SRPP)
1st January 2018 Rubis Patrimoine
1st January 2019 Rubis Renouvelables (formerly Cimarosa Investissements)

The agreed breakdown of tax is as follows (unless otherwise agreed):

•   tax expenses are paid by the companies as if there were no tax consolidation;

•   tax savings made by the Group are recognised in the income statement by the parent company;

•   tax savings are not reallocated to subsidiaries, except in the event of an exit from the Group.

Note 6.    Other information

6.1   Headcount

The average headcount for the financial year 2022 was 22 people (21 in 2021).

6.2   Off-balance sheet commitments

6.2.1     PENSION OBLIGATIONS

Retirement benefits for Rubis SCA employees totalled €226 thousand, including social security contributions. The evaluation method is described in note 3.7.

6.2.2     FINANCIAL COMMITMENTS AND CONTRACTUAL OBLIGATIONS

Commitments received        
(in thousands of euros)   31/12/2022   31/12/2021
Confirmed and unused credit facilities       732,429
TOTAL       732,429
Contractual obligations        
(in thousands of euros)   31/12/2022   31/12/2021
Operating leases*   3,351   3,828
TOTAL   3,351   3,828
* For the Rubis Patrimoine subsidiary.

6.3   Compensation of Senior Managers and members of the Supervisory Board

The fixed compensation of the Management Board is governed by Article 54 of the by-laws. For the financial year 2022, it totalled €2,408 thousand.

Shareholders’ and General Partners’ Meetings of 9 June 2022 (17th resolution) approved the compensation policy for the Management Board for the financial year 2022. This included an annual variable portion, the terms of which are described in chapter 5 of the 2021 Universal Registration Document. The annual variable compensation of the Management Board for the financial year 2022 was not subject to a provision, as the triggering condition had not been met.

Compensation paid to members of the Supervisory Board for financial year 2022 totalled €225 thousand.

6.4   Subsidiaries and equity interests

Subsidiaries: at least 50% of share capital held by Rubis SCA.

(in thousands of euros) Rubis
Énergie SAS
RT
Invest SA
Kelsey* Coparef SA Rubis
Patrimoine
SARL
Rubis
Renouvelables
(formerly Cimarosa
Invest. SAS)
Share capital 335,000 529,326 1 40 1,402 39,126
Equity other than share capital 488,219 59,305 157 (21) (678) 352,491
Government grants and regulated provisions 18,017          
Share of capital held 100.00% 55.00% 100.00% 100.00% 100.00% 100.00%
Gross carrying amount of the securities held 685,503 323,151 4 34 23,911 392,115
Net carrying amount of the securities held 685,503 323,151 4 34 23,911 392,115
Loans and advances from Rubis SCA not repaid 385,871       3,349 78,575
Revenue for the last financial year ended 378,809 1,350 1,274   759  
Net income for the last financial year ended 228,575 55,911 60 (2) (100) (401)
Dividends received by Rubis SCA during financial year 2022 160,800 32,985        
* The Company’s accounting records are kept in US dollars. The following exchange rates were used:

•   equity: closing rate (€1 = US$1.0666);
•   revenue and net profit: average rate (€1 = US$1.0539).

6.5   Inventory of equity interests and securities

(in thousands of euros)   Net value as of 31/12/2022
I – Shares and interests    
French equity interests:    
Coparef   34
Rubis Énergie   685,502
Rubis Patrimoine   23,911
Rubis Renouvelables (formerly Cimarosa Investissements)   392,115
RT Invest   323,151
Foreign equity interests:    
Kelsey   4
TOTAL EQUITY INTERESTS   1,424,717
II – UCITS and similar    
UCITS    
Sicav BNP SUS BD   19,696
Sicav BNP PAR Money 3M   321
CMC-CIC Equival Cash C fund   3,578
Other    
Agipi fund   19,845
Open Capital fund   29,492
HR Patrimoine Capitalisation fund   43,818
Open Perspectives Capitalisation fund   22,493
TOTAL UCITS AND SIMILAR   139,243


6.6   Fees paid to Statutory Auditors

The fees paid to the Statutory Auditors during the financial year are set out in note 10.5 to the 2022 consolidated financial statements.

6.7   Events after the reporting period

No significant events occurred after the closing date.

7.3 Other information relating to the separate financial statements

7.3.1 Financial results of Rubis SCA over the last five financial years

(in thousands of euros) 2018 2019 2020 2021 2022
Financial position at the reporting date               
Share capital 121,017 125,222 129,538 128,177 128,692
Number of shares issued 96,813,744 100,177,432 103,630,677 102,541,281 102,953,566
Comprehensive income from transactions carried out          
Revenue excluding tax 5,073 5,670 7,496 2,972 12,461
Earnings before tax, depreciation and provisions 154,187 176,071 324,540 141,930 187,295
Income tax 12,102 8,997 14,211 11,507 1,096
Earnings after tax, depreciation and provisions 165,590 184,739 336,674 154,649 187,183
Earnings distributed to partners 154,522 197,964 181,715 191,061 197,671*
Earnings from operations reduced to a single share (in euros)          
Earnings after tax but before depreciation and provisions 1.72 1.85 3.27 1.50 1.83
Earnings after tax, depreciation and provisions 1.71 1.84 3.25 1.51 1.82
Dividend awarded to each share 1.59 1.75 1.80 1.86 1.92*
Workforce          
Number of employees 16 19 22 21 22
Total payroll 2,607 2,261 3,488 3,037 3,359
Amount paid in respect of employee benefits 1,315 1,774 1,933 1,759 1,796
* Amount proposed to the Shareholders’ Meeting of 8 June 2023.

7.3.2 Information on payment deadlines

As of 31 December 2022, no trade receivables were due. Information on trade payables is presented below:

  Invoices received and not paid on the reporting date
of the financial year and whose term was due
  0 days
(indicative)
1 to
30 days
31 to
90 days
91 days
and more
  Total
(1 day or more)
(A) Late payment categories            
Number of invoices concerned   2       2
Total amount of invoices concerned incl. VAT
(in thousands of euros)
  44       44
Percentage of total purchases (incl. VAT) for the financial year   0.2%       0.2%
(B) Invoices excluded from (A) relating to disputed or unrecognised liabilities and receivables      
Number of invoices excluded            
Total amount of excluded invoices
(in thousands of euros)
           
(C) Reference payment terms used (contractual or legal term)          
Reference payment terms used to calculate late payments   Legal terms      

7.4 Statutory Auditors’ reports

7.4.1 Statutory Auditors’ report on the consolidated financial statements

This is a free translation into English of the Statutory Auditors’ report issued in French and is provided solely for the convenience of English-speaking readers. This report includes information specifically required by European regulations or French law, such as information about the appointment of Statutory Auditors. This report should be read in conjunction with, and construed in accordance with, French law and professional auditing standards applicable in France.

To the Shareholders,

Opinion

In compliance with the engagement entrusted to us by your Annual General Meeting, we have audited the accompanying consolidated financial statements of Rubis for the year ended December 31, 2022.

In our opinion, the consolidated financial statements give a true and fair view of the assets and liabilities and of the financial position of the Group at December 31, 2022 and of the results of its operations for the year then ended in accordance with International Financial Reporting Standards as adopted by the European Union.

The audit opinion expressed above is consistent with our report to the Accounts and Risk Monitoring Committee.

Basis for opinion

AUDIT FRAMEWORK

We conducted our audit in accordance with professional standards applicable in France. We believe that the audit evidence we have obtained is sufficient and appropriate to provide a basis for our opinion.

Our responsibilities under these standards are further described in the “Responsibilities of the Statutory Auditors relating to the audit of the consolidated financial statements” section of our report.

INDEPENDENCE

We conducted our audit engagement in compliance with the independence rules provided for in the French Commercial Code (Code de commerce) and the French Code of Ethics (Code de déontologie) for Statutory Auditors for the period from January 1, 2022 to the date of our report, and, in particular, we did not provide any non-audit services prohibited by Article 5(1) of Regulation (EU) No. 537/2014.

Justification of assessments – Key audit matters

In accordance with the requirements of Articles L. 823-9 and R. 823-7 of the French Commercial Code relating to the justification of our assessments, we inform you of the key audit matters relating to the risks of material misstatement that, in our professional judgment, were the most significant in our audit of the consolidated financial statements, as well as how we addressed those risks.

These matters were addressed as part of our audit of the consolidated financial statements as a whole, and therefore contributed to the opinion we formed as expressed above. We do not provide a separate opinion on specific items of the consolidated financial statements.

Measurement of the recoverable amount of goodwill
(Note 4.2 “Goodwill” to the consolidated financial statements)

Description of risk   How our audit addressed this risk

As of December 31, 2022, the carrying amount of goodwill totaled €1,719 million.

The Group tests goodwill for impairment at least once a year, and more frequently if there are indications of impairment. An impairment loss amounting to €40 million was recognised as of 31 December 2022.

An impairment loss is recognized when the recoverable amount is less than the carrying amount, the recoverable amount corresponding to the higher of value in use, determined on the basis of discounted expected future cash flows, and fair value less costs of disposal (as described in Note 4.2 “Goodwill” to the consolidated financial statements).

We considered the measurement of the recoverable amount of goodwill to be a key audit matter because of the significant value of goodwill on the balance sheet and the high degree of judgment exercised by management in determining future cash flow projections and key assumptions.


We examined the methods used by Rubis to carry out impairment tests in accordance with current accounting standards.

We assessed the process used by management to develop the cash flow projections used to determine the value in use. With the assistance of our valuation experts, we reviewed the mathematical models used and verified the correct calculation of these models.

We assessed the reasonableness of the main estimates, and in particular:

•   the consistency of the projected future cash flows with management’s business plans. We also compared, where appropriate, management’s forecasts with past performance and the market outlook, in conjunction with our own analyses;

•   the discount rates applied to future cash flows, by comparing their inputs with external references, with the assistance of our valuation experts.

We reviewed the sensitivity analyses performed by management and performed our own sensitivity calculations on the key assumptions to assess the potential impact of these assumptions on the conclusions of the impairment tests.

We also assessed the appropriateness of the disclosures provided in Note 4.2 “Goodwill” to the consolidated financial statements.

Acquisition of Photosol: measurement of the fair value of assets acquired and liabilities assumed
(Note 3.2 “Changes in the scope of consolidation - Acquisition of Photosol France” to the consolidated financial statements)

Description of risk   How our audit addressed this risk

On April 14, 2022, Rubis acquired 80% of the ordinary shares issued by Photosol, one of the leading independent photovoltaic energy producers in France.

The Group considered that this transaction, described in Note 3.2 to the consolidated financial statements, meets the definition of a business combination within the meaning of IFRS 3 – Business Combinations.

As part of the preliminary purchase price allocation, management identified and determined the fair value of the assets acquired and liabilities assumed, with the assistance of independent valuation experts.

The amount of identified assets acquired less liabilities assumed amounted to -€102 million and the provisional goodwill was valued at €541 million.

Given the materiality of the acquisition of Photosol on Rubis Group’s consolidated financial statements at December 31, 2022, and the importance of the judgments made by management in this respect, we considered the assessment of the fair value of the assets acquired and liabilities assumed to be a key audit matter.


As part of our audit, we reviewed and analyzed the legal documentation relating to the transaction.

Our other audit work consisted in:

•   assessing the compliance of the accounting treatment of the transaction with IFRS 3 – Business Combinations;

•   performing substantive procedures on the opening balance sheet of Photosol;

•   regarding the fair value of assets acquired and liabilities assumed, and the determination of preliminary goodwill:

•   obtaining an understanding of the methods used and key assumptions made by the Group for its valuation, in particular by obtaining the report of the independent expert appointed by management to assist in their identification and measurement,

•   assessing the process implemented, the methodologies used, the main underlying assumptions and the accuracy of the calculations;

•   verifying the arithmetical accuracy of the amount of goodwill recognized;

•   assessing the appropriateness of the disclosures relating to the acquisition of Photosol provided in Note 3.2 to the consolidated financial statements.

Specific verifications

We have also performed, in accordance with professional standards applicable in France, the specific verifications required by laws and regulations of the information pertaining to the Group presented in the Management Board’s management report.

We have no matters to report as to its fair presentation and its consistency with the consolidated financial statements.

We attest that the information pertaining to the Group presented in the management report includes the consolidated non-financial performance statement required under Article L. 225-102-1 of the French Commercial Code. However, in accordance with Article L. 823-10 of the French Commercial Code, we have not verified the fair presentation and consistency with the consolidated financial statements of the information given in that statement, which will be the subject of a report by an independent third party.

Other verifications and information pursuant to legal and regulatory requirements

PRESENTATION OF THE CONSOLIDATED FINANCIAL STATEMENTS TO BE INCLUDED IN THE ANNUAL FINANCIAL REPORT

In accordance with professional standards applicable to the Statutory Auditors’ procedures for annual and consolidated financial statements presented according to the European single electronic reporting format, we have verified that the presentation of the consolidated financial statements to be included in the annual financial report referred to in paragraph I of Article L. 451-1-2 of the French Monetary and Financial Code (Code monétaire et financier) and prepared under the Management Board’s responsibility, complies with this format, as defined by European Delegated Regulation No. 2019/815 of December 17, 2018. As it relates to the consolidated financial statements, our work included verifying that the markups in the financial statements comply with the format defined by the aforementioned Regulation.

On the basis of our work, we conclude that the presentation of the consolidated financial statements to be included in the Annual Financial Report complies, in all material respects, with the European single electronic reporting format.

Due to the technical limitations inherent in the macro-tagging of the consolidated financial statements in accordance with the European single electronic reporting format, the content of certain tags in the notes to the financial statements may not be rendered identically to the consolidated financial statements attached to this report.

In addition, it is not our responsibility to ensure that the consolidated financial statements to be included by the Company in the annual financial report filed with the AMF correspond to those on which we carried out our work.

APPOINTMENT OF THE STATUTORY AUDITORS

We were appointed Statutory Auditors of Rubis by the Annual General Meetings held on June 11, 2020 for PricewaterhouseCoopers Audit and on June 9, 2022 for KPMG SA.

At December 31, 2022, PricewaterhouseCoopers Audit and KPMG SA were in the third and first consecutive year of their engagement, respectively.

Responsibilities of management and those charged with governance for the consolidated financial statements

Management is responsible for preparing consolidated financial statements giving a true and fair view in accordance with International Financial Reporting Standards as adopted by the European Union and for implementing the internal control procedures it deems necessary for the preparation of consolidated financial statements that are free of material misstatement, whether due to fraud or error.

In preparing the consolidated financial statements, management is responsible for assessing the Company’s ability to continue as a going concern, disclosing, as applicable, matters related to going concern, and using the going concern basis of accounting, unless it expects to liquidate the Company or to cease operations.

The Accounts and Risk Monitoring Committee is responsible for monitoring the financial reporting process and the effectiveness of internal control and risk management systems, as well as, where applicable, any internal audit systems, relating to accounting and financial reporting procedures.

The consolidated financial statements were approved by the Management Board.

Responsibilities of the Statutory Auditors relating to the audit of the consolidated financial statements

OBJECTIVE AND AUDIT APPROACH

Our role is to issue a report on the consolidated financial statements. Our objective is to obtain reasonable assurance about whether the consolidated financial statements as a whole are free of material misstatement. Reasonable assurance is a high level of assurance, but is not a guarantee that an audit conducted in accordance with professional standards will always detect a material misstatement when it exists. Misstatements can arise from fraud or error and are considered material if, individually or in the aggregate, they could reasonably be expected to influence the economic decisions taken by users on the basis of these consolidated financial statements.

As specified in Article L. 823-10-1 of the French Commercial Code, our audit does not include assurance on the viability or quality of the Company’s management.

As part of an audit conducted in accordance with professional standards applicable in France, the Statutory Auditors exercise professional judgment throughout the audit.

They also:

•   identify and assess the risks of material misstatement in the consolidated financial statements, whether due to fraud or error, design and perform audit procedures in response to those risks, and obtain audit evidence considered to be sufficient and appropriate to provide a basis for their opinion. The risk of not detecting a material misstatement resulting from fraud is higher than for one resulting from error, as fraud may involve collusion, forgery, intentional omissions, misrepresentations, or the override of internal control;

•   obtain an understanding of the internal control procedures relevant to the audit in order to design audit procedures that are appropriate in the circumstances, but not for the purpose of expressing an opinion on the effectiveness of the internal control;

•   evaluate the appropriateness of accounting policies used and the reasonableness of accounting estimates made by management and the related disclosures in the notes to the consolidated financial statements;

•   assess the appropriateness of management’s use of the going concern basis of accounting and, based on the audit evidence obtained, whether a material uncertainty exists related to events or conditions that may cast significant doubt on the Company’s ability to continue as a going concern. This assessment is based on the audit evidence obtained up to the date of the audit report. However, future events or conditions may cause the Company to cease to continue as a going concern. If the Statutory Auditors conclude that a material uncertainty exists, they are required to draw attention in the audit report to the related disclosures in the consolidated financial statements or, if such disclosures are not provided or are inadequate, to issue a qualified opinion or a disclaimer of opinion;

•   evaluate the overall presentation of the consolidated financial statements and assess whether these statements represent the underlying transactions and events in a manner that achieves fair presentation;

•   obtain sufficient appropriate audit evidence regarding the financial information of the entities or business activities within the Group to express an opinion on the consolidated financial statements. The Statutory Auditors are responsible for the management, supervision and performance of the audit of the consolidated financial statements and for the opinion expressed thereon.

REPORT TO THE ACCOUNTS AND RISK MONITORING COMMITTEE

We submit a report to the Accounts and Risk Monitoring Committee, which includes, in particular, a description of the scope of the audit and the audit program implemented, as well as the results of our audit. We also report any significant deficiencies in internal control that we have identified regarding the accounting and financial reporting procedures.

Our report to the Accounts and Risk Monitoring Committee includes the risks of material misstatement that, in our professional judgment, were the most significant for the audit of the consolidated financial statements and which constitute the key audit matters that we are required to describe in this report.

We also provide the Accounts and Risk Monitoring Committee with the declaration provided for in Article 6 of Regulation (EU) No. 537/2014, confirming our independence within the meaning of the rules applicable in France, as defined in particular in Articles L. 822-10 to L. 822-14 of the French Commercial Code and in the French Code of Ethics for Statutory Auditors. Where appropriate, we discuss any risks to our independence and the related safeguard measures with the Accounts and Risk Monitoring Committee.

Neuilly-sur-Seine and Paris-La Défense, 26 April 2023

The Statutory Auditors

  PricewaterhouseCoopers Audit KPMG SA  
  Cédric Le Gal Frédéric Nusbaumer Jacques-François Lethu François Quédiniac  

7.4.2 Statutory Auditors’ report on the financial statements

This is a free translation into English of the Statutory Auditors’ report issued in French and is provided solely for the convenience of English-speaking readers. This report includes information specifically required by European regulations or French law, such as information about the appointment of Statutory Auditors. This report should be read in conjunction with, and construed in accordance with, French law and professional auditing standards applicable in France.

To the Shareholders,

Opinion

In compliance with the engagement entrusted to us by your Annual General Meeting, we have audited the accompanying financial statements of Rubis for the year ended December 31, 2022.

In our opinion, the financial statements give a true and fair view of the assets and liabilities and of the financial position of the Company at December 31, 2022 and of the results of its operations for the year then ended in accordance with French accounting principles.

The audit opinion expressed above is consistent with our report to the Accounts and Risk Monitoring Committee.

Basis for opinion

AUDIT FRAMEWORK

We conducted our audit in accordance with professional standards applicable in France. We believe that the audit evidence we have obtained is sufficient and appropriate to provide a basis for our opinion.

Our responsibilities under these standards are further described in the “Responsibilities of the Statutory Auditors relating to the audit of the financial statements” section of our report.

INDEPENDENCE

We conducted our audit engagement in compliance with the independence rules provided for in the French Commercial Code (Code de commerce) and the French Code of Ethics (Code de déontologie) for Statutory Auditors for the period from January 1, 2022 to the date of our report, and, in particular, we did not provide any non-audit services prohibited by Article 5(1) of Regulation (EU) No. 537/2014.

Justification of assessments – Key audit matters

In accordance with the requirements of Articles L. 823-9 and R. 823-7 of the French Commercial Code relating to the justification of our assessments, we inform you of the key audit matters relating to the risks of material misstatement that, in our professional judgment, were the most significant in our audit of the financial statements, as well as how we addressed those risks.

These matters were addressed as part of our audit of the financial statements as a whole, and therefore contributed to the opinion we formed as expressed above. We do not provide a separate opinion on specific items of the financial statements.

Measurement of investments
(Note 3.2 “Investments” to the financial statements)

Description of risk   How our audit addressed this risk

At December 31, 2022, investments were carried in the balance sheet for a net amount of €1,425 million, representing 67% of total assets.

Investments are recorded at their acquisition cost or contribution value. At the end of the year, investments are estimated at their value in use, determined on the basis of a multi-criteria analysis taking into account, in particular, the share of the subsidiary’s equity that said securities represent, forecasts of future cash flows or market value. If their value in use is lower than their carrying amount, an impairment expense is recognized in net financial income or expense.

We considered the measurement of investments to be a key audit matter given their material amount on Rubis’ balance sheet and the high degree of judgment exercised by management, both in the choice of measurement method and in the assumptions used.


As part of our assessment of the accounting rules and methods applied by your Company, we assessed the appropriateness of the measurement methods used to determine the value in use of investments at December 31, 2022.

For measurements based on historical data, we assessed the consistency of the shareholders, equity used in measuring investments with the financial statements of the entities for which an audit or analytical procedures were performed and we verified the arithmetical calculation performed.

For measurements based on forecast data, we assessed the reasonableness of the assumptions used and estimates made by management in determining the present value of future cash flows.

Specific verifications

In accordance with professional standards applicable in France, we have also performed the specific verifications required by French legal and regulatory provisions.

INFORMATION GIVEN IN THE MANAGEMENT REPORT AND IN THE OTHER DOCUMENTS PROVIDED TO THE SHAREHOLDERS WITH RESPECT TO THE COMPANY’S FINANCIAL POSITION AND THE FINANCIAL STATEMENTS

We have no matters to report as to the fair presentation and the consistency with the financial statements of the information given in the management report prepared by the Management Board and in the other documents provided to the shareholders with respect to the Company’s financial position and the financial statements.

We attest to the fair presentation and the consistency with the financial statements of the information about payment terms referred to in Article D. 441-6 of the French Commercial Code.

REPORT ON CORPORATE GOVERNANCE

We attest that the Management Board’s report on corporate governance sets out the information required by Articles L. 225-37-4, L. 22-10-10 and L. 22-10-9 of the French Commercial Code.

Concerning the information given in accordance with the requirements of Article L. 22-10-9 of the French Commercial Code relating to compensation and benefits paid or awarded to corporate officers and any other commitments made in their favor, we have verified its consistency with the financial statements or with the underlying information used to prepare these financial statements, and, where applicable, with the information obtained by the Company from controlled companies within its scope of consolidation. Based on this work, we attest to the accuracy and fair presentation of this information.

Concerning the information given in accordance with the requirements of Article L. 22-10-11 of the French Commercial Code relating to those items the Company has deemed liable to have an impact in the event of a takeover bid or exchange offer, we have verified its consistency with the underlying documents that were disclosed to us. Based on this work, we have no matters to report with regard to this information.

OTHER INFORMATION

In accordance with French law, we have verified that the required information concerning the identity of shareholders and holders of the voting rights has been properly disclosed in the management report.

Other verifications and information pursuant to legal and regulatory requirements

PRESENTATION OF THE FINANCIAL STATEMENTS TO BE INCLUDED IN THE ANNUAL FINANCIAL REPORT

In accordance with professional standards applicable to the Statutory Auditors’ procedures for annual and consolidated financial statements presented according to the European single electronic reporting format, we have verified that the presentation of the financial statements to be included in the annual financial report referred to in paragraph I of Article L. 451-1-2 of the French Monetary and Financial Code (Code monétaire et financier) and prepared under the Management Board’s responsibility, complies with this format, as defined by European Delegated Regulation No. 2019/815 of December 17, 2018.

On the basis of our work, we conclude that the presentation of the financial statements to be included in the annual financial report complies, in all material respects, with the European single electronic reporting format.

It is not our responsibility to ensure that the financial statements to be included by the Company in the annual financial report filed with the AMF correspond to those on which we carried out our work.

APPOINTMENT OF THE STATUTORY AUDITORS

We were appointed Statutory Auditors of Rubis by the Annual General Meetings held on June 11, 2020 for PricewaterhouseCoopers Audit and on June 9, 2022 for KPMG SA.

At December 31, 2022, PricewaterhouseCoopers Audit and KPMG SA were in the third and first consecutive year of their engagement, respectively.

Responsibilities of management and those charged with governance for the financial statements

Management is responsible for preparing financial statements giving a true and fair view in accordance with French accounting principles, and for implementing the internal control procedures it deems necessary for the preparation of financial statements that are free of material misstatement, whether due to fraud or error.

In preparing the financial statements, management is responsible for assessing the Company’s ability to continue as a going concern, disclosing, as applicable, matters related to going concern, and using the going concern basis of accounting, unless it expects to liquidate the Company or to cease operations.

The Accounts and Risk Monitoring Committee is responsible for monitoring the financial reporting process and the effectiveness of internal control and risk management systems, as well as, where applicable, any internal audit systems, relating to accounting and financial reporting procedures.

The financial statements were approved by the Management Board.

Responsibilities of the Statutory Auditors relating to the audit of the financial statements

OBJECTIVE AND AUDIT APPROACH

Our role is to issue a report on the financial statements. Our objective is to obtain reasonable assurance about whether the financial statements as a whole are free of material misstatement. Reasonable assurance is a high level of assurance, but is not a guarantee that an audit conducted in accordance with professional standards will always detect a material misstatement when it exists. Misstatements can arise from fraud or error and are considered material if, individually or in the aggregate, they could reasonably be expected to influence the economic decisions taken by users on the basis of these financial statements.

As specified in Article L. 823-10-1 of the French Commercial Code, our audit does not include assurance on the viability or quality of the Company’s management.

As part of an audit conducted in accordance with professional standards applicable in France, the Statutory Auditors exercise professional judgment throughout the audit. They also:

•   identify and assess the risks of material misstatement in the financial statements, whether due to fraud or error, design and perform audit procedures in response to those risks, and obtain audit evidence considered to be sufficient and appropriate to provide a basis for their opinion. The risk of not detecting a material misstatement resulting from fraud is higher than for one resulting from error, as fraud may involve collusion, forgery, intentional omissions, misrepresentations, or the override of internal control;

•   obtain an understanding of the internal control procedures relevant to the audit in order to design audit procedures that are appropriate in the circumstances, but not for the purpose of expressing an opinion on the effectiveness of the internal control;

•   evaluate the appropriateness of accounting policies used and the reasonableness of accounting estimates made by management and the related disclosures in the notes to the financial statements;

•   assess the appropriateness of management’s use of the going concern basis of accounting and, based on the audit evidence obtained, whether a material uncertainty exists related to events or conditions that may cast significant doubt on the Company’s ability to continue as a going concern. This assessment is based on the audit evidence obtained up to the date of the audit report. However, future events or conditions may cause the Company to cease to continue as a going concern. If the Statutory Auditors conclude that a material uncertainty exists, they are required to draw attention in the audit report to the related disclosures in the financial statements or, if such disclosures are not provided or are inadequate, to issue a qualified opinion or a disclaimer of opinion;

•   evaluate the overall presentation of the financial statements and assess whether these statements represent the underlying transactions and events in a manner that achieves fair presentation.


REPORT TO THE ACCOUNTS AND RISK MONITORING COMMITTEE

We submit a report to the Accounts and Risk Monitoring Committee which includes, in particular, a description of the scope of the audit and the audit program implemented, as well as the results of our audit. We also report any significant deficiencies in internal control that we have identified regarding the accounting and financial reporting procedures.

Our report to the Accounts and Risk Monitoring Committee includes the risks of material misstatement that, in our professional judgment, were the most significant for the audit of the financial statements and which constitute the key audit matters that we are required to describe in this report.

We also provide the Accounts and Risk Monitoring Committee with the declaration provided for in Article 6 of Regulation (EU) No. 537/2014, confirming our independence within the meaning of the rules applicable in France, as defined in particular in Articles L. 822-10 to L. 822-14 of the French Commercial Code and in the French Code of Ethics for Statutory Auditors. Where appropriate, we discuss any risks to our independence and the related safeguard measures with the Accounts and Risk Monitoring Committee.

Neuilly-sur-Seine and Paris-La Défense, 26 April 2023

The Statutory Auditors

  PricewaterhouseCoopers Audit KPMG SA  
  Cédric Le Gal Frédéric Nusbaumer Jacques-François Lethu François Quédiniac  

7.4.3 Statutory Auditors’ special report on related-party agreements

In our capacity as Statutory Auditors of your company, we hereby report to you on related-party agreements.

It is our responsibility to report to shareholders, based on the information provided to us, on the main terms and conditions of agreements that have been disclosed to us or that we may have identified as part of our engagement, as well as the reasons given as to why they are beneficial for the Company, without commenting on their relevance or substance or identifying any undisclosed agreements. Under the provisions of Article R. 226-2 of the French Commercial Code, it is the responsibility of shareholders to determine whether the agreements are appropriate and should be approved.

Where applicable, it is also our responsibility to provide you with the information required by Article R. 226-2 of the French Commercial Code in relation to the implementation during the financial year ended of agreements already approved by the Shareholders’ Meeting.

We performed the procedures that we deemed necessary in accordance with the professional guidance of the French National Association of Statutory Auditors (Compagnie Nationale des Commissaires aux Comptes) relating to this assignment. These procedures consisted in verifying that the information provided to us was consistent with the source documents from which it was taken.

Agreements to be submitted for the approval of the Shareholders’ Meeting

AGREEMENTS AUTHORISED AND ENTERED INTO DURING THE FINANCIAL YEAR ENDED

In accordance with Article L. 226-10 of the French Commercial Code, we were informed of the following agreement that was entered into during the financial year ended and authorised in advance by your Supervisory Board.

Transitional Services Agreement for consolidation, IT resources and compliance signed on 30 April 2020 with RT Invest SA

Entities concerned: Rubis SCA; RT Invest SA.

Person concerned: Jacques Riou: Chairman of Agena SAS, co-Managing Partner of your Company, and Director of RT Invest SA.

Nature, purpose and conditions: On 12 March 2020, your Supervisory Board authorised the signing of a Transitional Services Agreement for consolidation, IT resources and compliance that was entered into with RT Invest SA on 30 April 2020. It defines the nature of the services provided by the Company to RT Invest SA, as well as the amount and terms of the compensation paid to the Company.

The agreement was entered into for a term of 12 months. It is automatically renewable for a period of one year unless terminated by either of the contracting parties. On 10 March 2022, the Supervisory Board authorised its renewal for a further 12-month period.

In return for said assistance services, the Company receives income from RT Invest SA, calculated on the basis of the costs generated by the provision of the assistance services, corresponding to a percentage of EBIT and a margin of 5%.

For the financial year ended 31 December 2022, income related to these assistance services amounted to €96,000 incl. VAT.

Purpose: the conclusion of the assistance agreement between Rubis SCA and RT Invest SA follows the reorganisation of the intra-group assistance agreements as part of the implementation of the partnership with Cube Storage Europe HoldCo Ltd and the subsequent termination of the technical assistance agreement between Rubis SCA, Rubis Énergie and Rubis Terminal entered into on 30 September 2014 and its amendment No. 1 dated 1 October 2018.

AGREEMENTS ALREADY APPROVED BY THE SHAREHOLDERS’ MEETING

In accordance with Article R. 226-2 of the French Commercial Code, we were informed of the following agreements, approved by the Shareholders’ Meeting in previous years, which remained in force during the financial year ended.

Trademark licence agreement signed on 30 April 2020 with Rubis Terminal SA and Rubis Terminal Infra SAS

Entities concerned: Rubis SCA; Rubis Terminal SA; Rubis Terminal Infra SAS.

Person concerned: Jacques Riou: Chairman of Agena SAS, co-Managing Partner of Rubis SCA, Chairman of Board of Directors of Rubis Terminal SA (until 30 April 2020) and Director of RT Invest SA, company acting as Chairman of Rubis Terminal Infra SAS.

Nature, purpose and conditions: On 12 March 2020, the Supervisory Board authorised the signing of a trademark licence agreement aimed at formalising the use of the “Rubis” trademark by Rubis Terminal Infra SAS in its corporate name and commercial documents. The agreement has a five-year term from the signing date.

The licence is granted free of charge.

Purpose: the trademark license agreement with Rubis Terminal Infra SAS was signed following the structural and capital reorganisation of Rubis Terminal SA and the various entities in which it holds a stake, directly or indirectly, as part of the partnership agreement with Cube Storage Europe HoldCo Ltd, to replace the agreement signed on 25 September 2019 with Rubis Terminal SA.

Current account agreement with Agena SAS dated 17 September 2020

Entities concerned: Rubis SCA; Agena SAS.

Person concerned: Jacques Riou: Chairman of Agena SAS, co-Managing Partner of your Company and Limited Partner of GR Partenaires, itself co-Managing Partner and General Partner of Rubis SCA.

Nature, purpose and conditions: On 17 September 2020, the Supervisory Board authorised the signing of a current account agreement with Agena SAS. The purpose of the agreement is to defer the payment of 50% of the dividends due in respect of 2019 to the General Partners under the Company’s by-laws to June 2022 or to an earlier date, provided that the price of the Rubis share reaches an average of €50 over 20 consecutive trading days (opening price).

Consequently, 50% of the General Partner dividend paid by your Company, via GR Partenaires, to Jacques Riou, in his capacity as General Partner of GR Partenaires, and to Agena SAS and other members of the Riou family group, in their capacity as Limited Partners of GR Partenaires, was held in a shareholders’ current account at your Company in the name of Agena SAS, in an amount of €3,353,541.

The funds will bear interest, until full repayment, at a rate of 0.2001%, revisable every two years.

For the financial year ended 31 December 2022, your Company recognised an expense of €3,272.49 in respect of interest due to Agena SAS between 1 January and 30 June 2022.

This agreement expired on 30 June 2022.The €3,353,541 blocked in the shareholders’ current account were therefore repaid to Agena SAS.

Purpose: the conclusion of the current account agreement followed the announcement by the General Partners at the Shareholders’ Meeting on 11 June 2020 of their decision to defer the payment of 50% of their dividend per the by-laws in respect of the 2019 financial year, given the global economic situation in the first half of 2020, which impacted the Rubis share price.

Current account agreement with Sorgema SARL (now Sorgema SAS) dated 17 September 2020

Entities concerned: Rubis SCA; Sorgema SAS.

Person concerned: Gilles Gobin: Managing Partner and General Partner of your Company and Chairman of Sorgema SAS, co-Managing Partner and General Partner of your Company and General Partner of GR Partenaires.

Nature, purpose and conditions: On 17 September 2020, your Supervisory Board authorised the signing of a current account agreement with Sorgema SAS.The purpose of the agreement is to defer the payment of 50% of the dividends due in respect of 2019 to the General Partners under the Company’s by-laws to June 2022 or to an earlier date, provided that the price of the Rubis share reaches an average of €50 over 20 consecutive trading days (opening price).

Consequently, 50% of the General Partner dividend paid by your Company, via GR Partenaires, to Gilles Gobin, Sorgema SAS and Thornton and Magerco (two companies in the Gobin family group) was held in a shareholders’ current account in the name of Sorgema SAS, covering the entire commitment for the Gobin family group companies, in an amount of €7,824,929.

The funds will bear interest, until full repayment, at a rate of 0.2001%, revisable every two years.

For the financial year ended December 31, 2022, your Company recognised an expense of €7,635.80 in respect of interest due to Sogerma SAS between 1 January and 30 June 2022.

This agreement expired on 30 June 2022.The €7,824,929 blocked in the shareholders’ current account was therefore repaid to Sogerma SAS.

Purpose: the conclusion of the current account agreement followed the announcement by the General Partners at the Shareholders’ Meeting on 11 June 2020 of their decision to defer the payment of 50% of their dividend per the by-laws in respect of the 2019 financial year, given the global economic situation in the first half of 2020, which impacted the Rubis share price.

Neuilly-sur-Seine and Paris-La Défense, 26 April 2023

The Statutory Auditors

  PricewaterhouseCoopers Audit KPMG SA  
  Cédric Le Gal Frédéric Nusbaumer Jacques-François Lethu François Quédiniac  

8. ADDITIONAL INFORMATION


8.1 Declaration of responsible officers

Responsible officers for the Universal Registration Document

Gilles Gobin: Managing Partner

Jacques Riou: Chairman of Agena, co-Managing Partner company of Rubis SCA

Declaration of responsible officers for the Universal Registration Document

We declare that the information contained in the Universal Registration Document is, to the best of our knowledge, in accordance with the facts and contains no omission likely to affect its import.

We declare that, to the best of our knowledge, the financial statements have been prepared in compliance with applicable accounting standards and give a true and fair view of the assets, liabilities, financial position and results of the Company and all companies included in its consolidated group, and that the management report, of which the various headings are mentioned in the cross-reference table in chapter 8, section 8.4.2 of this Universal Registration Document, on pages 321 to 323, gives a true and fair view of the performance of the business, results and financial position of the Company and the companies in its consolidated scope, and that it describes the main risks and uncertainties that it faces.

Signed in Meudon and Paris on 28 April 2023

Jacques Riou Gilles Gobin
Chairman of Agena, Managing Partner
co-Managing Partner company of Rubis SCA

Information concerning the Principal Statutory Auditors and Alternate Auditor

Principal Statutory Auditors

  Date of appointment   Expiration date
PricewaterhouseCoopers Audit Shareholders’ Meeting
11 June 2020
  financial year 2025 –
Shareholders’ Meeting 2026
63, rue de Villiers 92208 Neuilly-sur-Seine Cedex – France      
represented by Cédric Le Gal and Frédéric Nusbaumer      
KPMG Shareholders’ Meeting
9 June 2022
  financial year 2027 –
Shareholders’ Meeting 2028
Tour Eqho – 2 avenue Gambetta
CS 60055
92066 Paris-La-Défense Cedex – France
     
represented by Jacques-François Lethu and François Quédiniac      

Alternate Auditor

  Date of appointment   Expiration date
Patrice Morot Shareholders’ Meeting
11 June 2020
  financial year 2025 –
Shareholders’ Meeting 2026
63, rue de Villiers
92208 Neuilly-sur-Seine Cedex – France
     

8.2 Incorporation by reference

In accordance with Article 19 of Regulation (EU) 2017/1129 of 14 June 2017, the following information is included by reference in this Universal Registration Document:

•   the consolidated financial statements for the financial year ended 31 December 2021 and the corresponding Statutory Auditors’ report are included in the 2021 Universal Registration Document filed with the French Financial Market Authority (Autorité des Marchés Financiers – AMF) on 28 April 2022, under number D. 22-0373, on pages 230 to 285 and pages 301 to 304;

•   the consolidated financial statements for the financial year ended 31 December 2020 and the corresponding Statutory Auditors’ report are included in the 2020 Universal Registration Document filed with the French Financial Market Authority (Autorité des Marchés Financiers – AMF) on 29 April 2021, under number D. 21-0392, on pages 206 to 259 and pages 273 to 276.

8.3 Cross-reference table for the Universal Registration Document

The cross-reference table below shows the headings provided for in Annexes I and II of Delegated Regulation (EU) 2019/980 of 14 March 2019 supplementing Regulation (EU) 2017/1129 of 14 June 2017 and provides references to the pages on which the relevant information appears in this Universal Registration Document.

Headings of Annexes I and II of Delegated Regulation (EU) 2019/980 of 14 March 2019   Chapter   Page
1   Persons responsible, third-party information, experts’ reports and competent authority approval        
1.1   Name and position of responsible officers   8.1   316
1.2   Declaration of responsible officers   8.1   316
1.3   Name, address, qualifications and material interests of persons acting as experts   NA   NA
1.4   Declaration relating to third-party information   NA   NA
1.5   Declaration of filing with the competent authority   -   Inside fr. cover
2   Statutory Auditors   8.1   317
3   Risk factors   3.1   40 to 54
4   Information about the issuer        
4.1   Legal and commercial name   6.6   228
4.2   Place of registration, registration number and legal entity identifier (LEI)   6.6   228
4.3   Date of incorporation and duration   6.1.4   201
4.4     Domicile, legal form, applicable legislation, country of incorporation, address and telephone number of registered office, website   6.1 – 6.6   200 – 228
5   Business overview        
5.1   Principal activities   1   18 to 27
5.2   Principal markets   1   11 to 13
5.3   Important events in the development of the business   2.1 to 2.2 – 7.1   30 to 37
240 to 242
5.4   Strategy and objectives   1 – 2.1   11 to 13 – 30 to 37
5.5     Dependence on patents or licenses, industrial, commercial or financial contracts, or new manufacturing processes   NA     NA  
5.6   Competitive position   1   19 to 27
5.7   Investments   2.1   30 to 37
5.7.1   Main historical investments   2.1 – 7.1   30 to 37
240 to 242
5.7.2   Main ongoing investments   2.1   30 to 37
5.7.3   Joint ventures and undertakings in which the issuer holds a proportion of the capital likely to have a significant effect on the assessment of its own assets and liabilities, financial position or profits and losses   7.1   278 to 281
5.7.4   Environmental issues liable to affect the use of property, plant and equipment   4.2.2   84 to 98
6   Organisational structure        
6.1   Brief description of the Group   1   6 to 27
6.2   List of significant subsidiaries   1 – 7.1   18
284 to 289
7   Operating and financial review        
7.1   Financial condition   2.1 – 7.1   30 to 37
232 to 289
7.1.1   Review of the development and performance of the issuer’s business   7.3.1   304
7.2   Operating results   1 – 2.1 – 7.1   8 – 30 – 234
7.2.1   Information regarding material changes in net sales or revenues   2.1   30 to 37
7.2.2   Reasons for any material changes in net sales or revenues disclosed by historical financial information   2.1 – 3.1   30 to 37
40 to 54
8   Capital resources        
8.1   Information on capital resources   7.1   254 to 255
8.2   Source, amount and description of cash flows   2.1 – 7.1   31 – 236 to 237
8.3   Information on borrowing requirements and funding structure   2.1 – 7.1   31 – 258 to 263
8.4   Restrictions on the use of capital resources that have or could have a material effect on the issuer’s operations   NA   NA
8.5   Anticipated sources of funds needed to fulfil commitments referred to in item 5.7.2   2.1 – 7.1   30 to 37
242 to 244
9   Regulatory environment   3.1.2.3   49 to 51
10   Trend information   2.2   37
11   Profit forecasts or estimates   NA   NA
12   Management and Supervisory bodies        
12.1   Information on members of the Management and Supervisory bodies   5.2 – 5.3   153 to 165
12.2   Conflicts of interest, commitments relating to appointments, restrictions on the disposal of equity interests in the issuer’s share capital   5.5   195 to 196
13   Remuneration and benefits        
13.1   Remuneration paid and benefits in kind   5.4.4   180 to 194
13.2   Amounts set aside or accrued for pension, retirement or similar benefits   7.1   265 to 267
14   Board practices        
14.1   Expiration date of current terms of office and periods served   5.3.1   157
14.2   Service contracts linking members of the Supervisory Board   5.5   195
14.3   Information on Committees   5.3.2   170 to 173
14.4   Statement of compliance with the corporate governance regime in effect   5.1   152
14.5   Potential material impacts on the corporate governance   NA   NA
15   Employees        
15.1   Headcount   4.4 – 7.1   117 to 118 – 270
15.2   Shareholdings and stock options   6.2.2 – 6.4 – 6.5
– 7.1
  206 – 215
216 to 227
255 to 257
15.3   Agreements providing for employee shareholding   4.4.4 – 6.4 – 7.1   127 to 128 – 215
255 to 257
16   Major shareholders        
16.1   Shareholders holding notifiable interests or voting rights   6.2.2   206
16.2   Voting rights of major shareholders exceeding their share of share capital   NA   NA
17   Related-party transactions   5.5 – 7.1   195 – 282
18   Financial information concerning the issuer’s assets and liabilities, financial position, and profits and losses        
18.1   Historical financial information   7.3.1   304
18.2   Interim and other financial information   NA   NA
18.3   Audit of historical annual financial information   7.4   305 to 313
18.4   Pro forma financial information   NA   NA
18.5   Dividend policy   6.3   214 to 215
18.6   Legal and arbitration proceedings   3.1.2.3 – 3.1.2.4   49 to 51 - 52 to 54
18.7   Significant change in the issuer’s financial position   NA   NA
19   Additional information        
19.1   Share capital   6.2 – 7.2   205 to 213
298 to 299
19.1.1   Issued and authorised share capital   6.2 – 7.2   205 to 213
298 to 299
19.1.2   Shares not representing share capital   NA   NA
19.1.3   Shares held by the issuer or its subsidiaries   6.2.2 – 6.2.5 – 7.1   206 – 209 to
210 254
19.1.4   Securities giving future access to the issuer’s share capital   6.2.6 – 6.5.5   211 – 222
19.1.5   Terms of any acquisition rights and/or obligations over authorised but unissued capital or an undertaking to increase the capital   6.2.5 – 6.5   209 to 210
216 to 227
19.1.6   Capital of any member of the Group under option or subject to an agreement   NA   NA
19.1.7   History of the share capital of the issuer   6.2.7 – 7.3.1   212 to 213 – 304
19.2   Memorandum and Articles of Association   6.1.4   201 to 204
19.2.1   Corporate purpose of the issuer   6.1.4   201
19.2.2   Rights, preferences, and restrictions attached to each class of existing shares   6.1.4   202
19.2.3   By-laws’ provisions, charter or rules of the issuer that may delay, defer or prevent a change of control   NA   NA
20   Material contracts   NA   NA
21   Documents available   6.6   227

8.4 Cross-reference tables for the Annual Financial Report and the management report

8.4.1 Cross-reference table for the Annual Financial Report

The Annual Financial Report, prepared in accordance with Article L. 451-1-2 of the French Monetary and Financial Code and Article 222-3 of the General Regulation of the French Financial Market Authority (Autorité des Marchés Financiers), includes the documents, reports and information in this Universal Registration Document as detailed below.

The Management Board presents the draft resolutions that are submitted for vote by the shareholders in a separate document (the Notice of Combined Shareholders’ Meeting to be held on 8 June 2023), as well as their presentation.

    Chapter   Page
2022 Annual financial statements   7.2   290 to 303
2022 Consolidated financial statements   7.1   232 to 289
Management report   8.4.2   321 to 323
Report on corporate governance, attached to the management report   5 – 6.1.4
6.2.4 – 8.4.2
  152 to 197 – 203
207 to 209
321 to 323
Non-Financial Information Statement, attached to the management report   4   68 to 149
Declaration of persons responsible for the Annual Financial Report   8.1   316
Statutory Auditors’ report on the annual financial statements   7.4.2   309 to 311
Statutory Auditors’ report on the consolidated financial statements   7.4.1   305 to 308

8.4.2 Cross-reference table for the management report and the report on corporate governance attached to the management report

The management report (Articles L. 225-100 et seq., L. 232-1 I and II and R. 225-102 et seq. of the French Commercial Code) consists of the information presented in this Universal Registration Document containing the Annual Financial Report in chapters 1 to 7, with the exception of chapter 5, which constitutes the report on corporate governance.

    Chapter   Page
Group position and activity        
Position of the Company during the past financial year, analysis of business development, results and financial position of the Company and the Group   1 - 2.1 to 2.2 – 7.1   6 to 27 - 30 to 37
232 to 289
Financial key performance indicators   2.1   30 to 37
Non-financial key performance indicators, including information on environmental and personnel issues   4.2 to 4.4   81 to 129
Significant events occurring between the reporting date of the financial year and the date on which the management report was prepared   2.2 – 7.1   37 – 283
Identity of the main shareholders and holders of voting rights at Shareholders’ Meetings, changes made during the financial year   6.2.2   206 to 207
Existing branches   NA   NA
Significant equity interests in companies with their registered office in France   7.1 – 7.2   240 to 242 294
Disposals of cross-shareholdings   NA   NA
Foreseeable changes in the position of the Company and the Group and future prospects   1   11 to 15 - 19 to 27
Research and development activities   NA   NA
Table of income and expenses over the last five financial years   7.3.1   304
Information on supplier and customer payment terms   7.3.2   304
Amount of inter-company loans granted and Statutory Auditors’ statement   NA   NA
Internal control and risk management        
Description of the main risks and contingencies   3.1   40 to 54
Information on financial risks related to the effects of climate change, measures taken to reduce them   3.1.2.2 – 7.1   47 – 282 to 283
Main characteristics of the internal control and risk management procedures relating to the preparation and processing of accounting and financial information   3.2   55 to 62
Objectives and hedging policy and exposure to price, credit, liquidity and cash risks   3.1.2.4 – 7.1   61 to 63
248 to 252
58 to 263
Anti-corruption system   4.5.1.1   131 to 132
Vigilance plan and report on its effective implementation   NA   NA
Report on corporate governance        
Corporate officer compensation policy   5.4.1 to 5.4.3   175 to 179
Compensation and benefits of any kind paid during the financial year or allocated for the financial year to each corporate officer   5.4.4   180 to 194
Proportion relating to fixed and variable compensation   5.4.2   176 to 179
Use of the option to request the return of variable compensation   5.4.2   177
Commitments made by the Company for the benefit of corporate officers corresponding to elements of compensation, indemnities or benefits in respect of the assumption, termination or change of their positions   NA   NA
Compensation paid or allocated by a company included in the scope of consolidation   5.4.4   186 - 194
Ratios between the level of compensation of each executive corporate officer and the average and median compensation of the Company’s employees   5.4.4   180 to 182
Annual change in compensation, the Company’s performance, average employee compensation and the aforementioned ratios over the last five financial years   5.4.4   180 to 182
The manner in which the total compensation complies with the adopted compensation policy, contributes to the long-term performance of the Company and in which the performance criteria have been applied   5.4.1   175 to 176
The manner in which the vote of the last Ordinary Shareholders’ Meeting was taken into account   5.4.1   176
Deviation from the procedure for implementing the compensation policy and any exceptions   NA   NA
Application of the suspension of payment of the compensation of the members of the Supervisory Board in the event of non-compliance with gender balance   NA   NA
Allocation and retention of options by corporate officers   5.4.2   178
Allocation and retention of shares free of charge by corporate officers   5.4.2   178
List of all offices and positions held in any company by each of the corporate officers during the financial year   5.2.1 – 5.3.1   153 to 154
157 to 165
Agreements entered into between a Senior Manager or a significant shareholder and a subsidiary   5.5   195
Summary table of valid delegations granted by the Shareholders’ Meeting for capital increases   5.5 – 6.2.4   196 – 207 to 209
Composition, conditions of preparation and organisation of the work of the Supervisory Board   5.3   156 to 174
Application of the principle of balanced representation of women and men on the Supervisory Board   5.3.1   156 to 157
167
Reference to a Corporate Governance Code and application of the “comply or explain” principle   5.1   152
Ways of taking part in the Shareholders’ Meeting   5.5 – 6.1.4   197 – 203
Procedure for evaluating current agreements – Implementation   5.5   196
Information liable to have an impact in the event of a takeover bid or exchange offer   5.5   197
Shareholders and capital        
Structure, changes in the Company’s share capital and crossing of thresholds   6.2   205 to 213
Acquisition and disposal by the Company of its own shares   6.2.5   209 to 210
Statement of employee shareholding on the last day of the financial year   6.2.2 – 6.4   206 – 215
Note of any adjustments for securities giving access to the share capital in the event of share buybacks or financial transactions   6.5.6   222 to 227
Information on the transactions of Senior Managers and related persons in the Company’s securities   5.5   196
Amount of dividends distributed in respect of the three previous years   6.3   214 to 215
Non-Financial Information Statement (NFIS)        
See detailed cross-reference table   4.6.4   145
Other information        
Additional tax information   NA   NA
Injunctions or financial penalties for anti-competitive practices   NA   NA

8.5 Taxonomy Appendix

REVENUE

            Substantial contribution
criteria
Do No Significant Harm criteria
(DNSH)
         
Economic activities (1)     Code(s) (2) Absolute revenue (3) Share of revenue (4) Climate change mitigation (5) Climate change adaptation (6) Water and marine resources (7) Circular economy (8) Pollution (9) Biodiversity and ecosystems (10) Climate change mitigation (11) Climate change adaptation (12) Water and marine resources (13) Circular economy (14) Pollution (15) Biodiversity and ecosystems (16) Minimum safeguards (17) Share of revenue aligned
under the taxonomy, year Y (18)

Share of revenue aligned

under the taxonomy, year Y-1 (19)


Category (enabling activity) (20) Category (transitional activity) (21)
        €k % % % % % % % Y/N Y/N Y/N Y/N Y/N Y/N Y/N Percent Percent E T
A. Activities eligible under the taxonomy                        
A1 Environmentally sustainable activities (aligned under the taxonomy)                                            
4.1 Electricity generation using solar photovoltaic technology     4.1 32,171 0.45% 100% 0% - - - - Yes Yes Yes Yes Yes Yes Yes 0.45% - / /
7.6 Installation, maintenance and repair of renewable energy technologies     7.6 185 0.00% 100% 0% - - - - Yes Yes Yes Yes Yes Yes Yes 0.00% - E /
Revenue from environmentally sustainable activities (aligned under the taxonomy) (A.1)       32,356 0.45% 100% 0% - - - -               0.45% -    
A2 Activities eligible under the taxonomy but not environmentally sustainable (not aligned under the taxonomy)          
Revenue from activities eligible under the taxonomy but not environmentally sustainable (not aligned under the taxonomy) (A.2)       0 0.00%                           0% -    
TOTAL (A.1+A.2)       32,356 0.45%                           0% -    
B. Activities not eligible under the taxonomy                                  
Revenue from activities not eligible under the taxonomy (B)       7,102,372 99.55%                                  
TOTAL (A+B)       7,134,728 100%                                  

CAPEX

            Substantial contribution
criteria
Do No Significant Harm criteria
(DNSH)
         
Economic activities (1)     Code(s) (2) Absolute revenue (3) Share of revenue (4) Climate change mitigation (5) Climate change adaptation (6) Water and marine resources (7) Circular economy (8) Pollution (9) Biodiversity and ecosystems (10) Climate change mitigation (11) Climate change adaptation (12) Water and marine resources (13) Circular economy (14) Pollution (15) Biodiversity and ecosystems (16) Minimum safeguards (17) Share of revenue aligned
under the taxonomy, year Y (18)

Share of revenue aligned

under the taxonomy, year Y-1 (19)


Category (enabling activity) (20) Category (transitional activity) (21)
        €k % % % % % % % Y/N Y/N Y/N Y/N Y/N Y/N Y/N Percent Percent E T
A. Activities eligible under the taxonomy
A1 Environmentally sustainable activities (aligned under the taxonomy)                                            
4.1 Electricity generation using solar photovoltaic technology     4.1 413.230 60.84% 100% 0% - - - - Yes Yes Yes Yes Yes Yes Yes 60.84% - / /
7.6 Installation, maintenance and repair of renewable energy technologies     7.6 741 0.11% 100% 0% - - - - Yes Yes Yes Yes Yes Yes Yes 0.11% - E /
Capex of environmentally sustainable activities (aligned under the taxonomy) (A.1)       413.971 60.95% 100% 0% - - - -             60.95% -    
A2 Activities eligible under the taxonomy but not environmentally sustainable (not aligned under the taxonomy)
1.2 Rehabilitation and restoration of forests, including reforestation and natural forest regeneration after an extreme event     1.2 100 0.01%                                  
4.1 Electricity generation using solar photovoltaic technology     4.1 3.182 0.47%                                  
5.1 Construction, extension and operation of water collection, treatment and supply systems     5.1 1.163 0.17%                                  
6.5 Transport by motorbikes, passenger cars and light commercial vehicles     6.5 474 0.07%                                  
6.10 Sea and coastal freight water transport, vessels for port operations and auxiliary activities     6.10 48 0.01%                                  
6.15 Infrastructure enabling low-carbon road transport and public transport     6.15 83 0.01%                                  
7.2 Renovation of existing buildings     7.2 372 0.05%                                  
7.3 Installation, maintenance and repair of energy efficiency equipment     7.3 164 0.02%                                  
7.6 Installation, maintenance and repair of renewable energy technologies     7.6 87 0.01%                                  
7.7 Acquisition and ownership of buildings     7.7 3.754 0.55%                                  
Capex of activities eligible under the taxonomy but not environmentally sustainable (not aligned under the taxonomy) (A.2)       9.427 1.39%                           0% -    
TOTAL (A.1+A.2)       423.398 62.34%                           61% -    
B. Activities not eligible under the taxonomy                                  
Capex of activities not eligible under the taxonomy (B)       255.772 37.66%                                  
TOTAL (A+B)       679.170 100%                                  

OPEX

            Substantial contribution
criteria
Do No Significant Harm criteria
(DNSH)
         
Economic activities (1)     Code(s) (2) Absolute revenue (3) Share of revenue (4) Climate change mitigation (5) Climate change adaptation (6) Water and marine resources (7) Circular economy (8) Pollution (9) Biodiversity and ecosystems (10) Climate change mitigation (11) Climate change adaptation (12) Water and marine resources (13) Circular economy (14) Pollution (15) Biodiversity and ecosystems (16) Minimum safeguards (17) Share of revenue aligned
under the taxonomy, year Y (18)

Share of revenue aligned

under the taxonomy, year Y-1 (19)


Category (enabling activity) (20) Category (transitional activity) (21)
        €k % % % % % % % Y/N Y/N Y/N Y/N Y/N Y/N Y/N Percent Percent E T
A. Activities eligible under the taxonomy
A1 Environmentally sustainable activities (aligned under the taxonomy)                                            
4.1 Electricity generation using solar photovoltaic technology     4.1 673 0.41% 100% 0% - - - - Yes Yes Yes Yes Yes Yes Yes 0.41% - / /
7.6 Installation, maintenance and repair of renewable energy technologies     7.6 1.515 0.92% 100% 0% - - - - Yes Yes Yes Yes Yes Yes Yes 0.92% - E /
Opex of environmentally sustainable activities (aligned under the taxonomy) (A.1)       2.188 1.33% 100% 0% - - - -               1.33% -    
A2 Activities eligible under the taxonomy but not environmentally sustainable (not aligned under the taxonomy)
6.5 Transport by motorbikes, passenger cars and light commercial vehicles     6.5 156 0.09%                                  
7.2 Renovation of existing buildings     7.2 148 0.09%                                  
7.6 Installation, maintenance and repair of renewable energy technologies     7.6 539 0.33%                                  
7.7 Acquisition and ownership of buildings     7.7 53 0.03%                                  
11.1 Education     11.1 108 0.07%                                  
Opex of activities eligible under the taxonomy but not environmentally sustainable (not aligned under the taxonomy) (A.2)       1.005 0.61%                           0% -    
TOTAL (A.1+A.2)       3.193 1.94%                           1% -    
B. Activities not eligible under the taxonomy                                            
Opex of activities not eligible under the taxonomy (B)       161.433 98.06%                                  
TOTAL (A+B)       164.626 100%                                  

Photo credits

© Rubis photo library - © Gilles Dacquin - © iStock

Registered office:

46, rue Boissière - 75116 Paris - France

Paris Trade and Companies

Register 784 393 530

Tel.: +33 (0)1 44 17 95 95

Investor Relations

Tel.: +33 (0)1 45 01 87 44

The management system governing the printing of this document is certified ISO 14001:2014.