URD 2021
-
Glossary
These terms refer to Rubis SCA, Rubis Énergie, the Rubis Terminal JV, and their respective subsidiaries as presented in the organisational chart on page 32.
These terms refer to the holding company set up in the form of a Partnership Limited by Shares (Société en Commandite par Actions), and whose shares are listed on Euronext Paris.
This term refers to Rubis Énergie SAS, a subsidiary of Rubis SCA, and its subsidiaries, whose two activities are the distribution (Retail & Marketing) of energies and the supply, shipping and refining (Support & Services).
This term refers to Rubis Terminal Infra, the operating subsidiary of RT Invest, and its subsidiaries, whose activity is bulk liquid storage.
This term refers to the parent company of Rubis Terminal Infra, owned 55% by Rubis SCA and 45% by Cube Storage Europe HoldCo Ltd (an investment vehicle set up by I Squared Capital).
This Universal Registration Document was filed on 28 April, 2022 with the AMF (the French financial market authority, Autorité des marchés financiers) in its position as the competent authority in respect of Regulation (EU) 2017/1129, without prior approval, in accordance with Article 9 of said Regulation. The Universal Registration Document may be used for the purpose of a public offer of financial securities or the admission of financial securities to trading on a regulated market if it is supplemented by a securities note (note d’opération) and, where relevant, a summary and all the amendments made to the Universal Registration Document. This set of documents is then approved by the AMF in accordance with Regulation (EU) 2017/1129.
This document was prepared by the issuer and is binding upon its signatories. It may be consulted and downloaded from the website www.rubis.fr/en. This document is a translation of the original French document and is provided for information purposes only. In all matters of interpretation of information, views or opinions expressed therein, the original French version takes precedence over this translation.
-
Message from General Management
This year, Rubis became a multi-energy group, returned to sustained growth and once again demonstrated the strength of its business model in a market context that remained tight.
The dynamism shown by Rubis in 2021, its ability to implement the announced strategy, as well as the very good results achieved for the financial year, demonstrate the Group’s resilience and its ability to position itself in a changing energy market.
In a context of continued restrictions related to Covid-19 and despite the increase in the prices of petroleum products, all the Group’s activities are growing significantly and are back to a level close to the record performance of 2019.
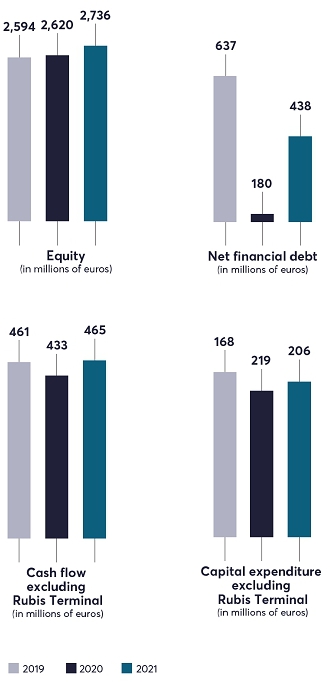
Our multi-country and multi-segment positioning as well as the breakdown of our businesses between Retail & Marketing and upstream Support & Services have enabled us to overcome many types of difficulties. In 2021, the Group generated growth of 4% in its net income, Group share and 7% in its cash flow (excluding the Rubis Terminal JV) compared to 2020. Net income, Group share, excluding the contribution of Rubis Terminal and non-recurring items, was up by 16% compared to 2020 and almost stable compared to the record level observed in 2019. The Rubis Terminal joint venture successfully consolidated its Spanish subsidiary Tepsa and generated growth of 6% in EBITDA.
2021 was also the year of a strategic shift towards renewable energies. We completed two significant transactions:
• the acquisition of an 18.5% stake in the share capital of HDF Energy, as well as the signature of a strategic priority and majority investment agreement in hydrogen-electricity power plant projects; • the announcement of the acquisition of 80% of Photosol, one of the leading independent producers of photovoltaic energy in France. This investment will enable the Group to reach a target of 25% of its EBITDA in renewable energies in the medium term, with a minimum of 2.5 GW of photovoltaic capacity installed in France by 2030. These two investments make Rubis one of the sector players that is the most committed to renewable energies, given its size. 2022 will see the creation of a new business dedicated specifically to the production of renewable or low-carbon energy, alongside the Group’s two historical pillars: Rubis Énergie and the Rubis Terminal JV. The Group’s objective is to balance the capital invested in the energy transition with that invested in its traditional businesses in the medium/long term.
“The very good results achieved for the financial year demonstrate the Group’s resilience and its ability to position itself in a changing energy market.
Committed to corporate social responsibility (CSR), in 2021, we continued to integrate CSR issues into the Group’s strategy and reached a new milestone, notably with:
• the publication of our first CSR Roadmap,Think Tomorrow 2022-2025, with quantitative targets for better management of our performance, including a target to reduce our CO2 emissions by 30% (scopes 1 and 2, 2019 baseline); • membership of the United Nations Global Compact, enabling us to reaffirm our commitment to the principles relating to the protection of human rights and the environment, compliance with international labour standards and the fight against corruption; • the strengthening of the Group’s transparency for our stakeholders by responding to the non-financial rating agencies that best match the profile of the Group’s investors (B rating obtained on the CDP Climate Change questionnaire); • our ongoing support for local communities via community investment actions carried out by all Group employees. In 2021, Rubis demonstrated its ability to return to good results and to initiate a shift towards renewable energies with leading players. Building on our responsible and entrepreneurial commitment, we are confident in our ability to continue this development while building a new balance between our new renewable activities and our historical businesses, guaranteeing our solidity during the energy transition period.
All this progress would not have been possible without the full involvement of all our employees and we thank them for their commitment to the Group.
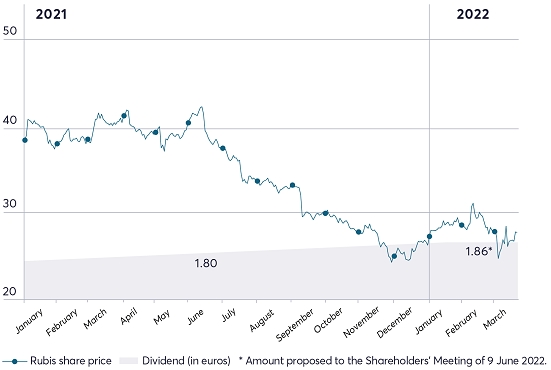
Lastly, we would like to thank our shareholders for their loyalty in these troubled times. Rubis has always been keen to maintain the payment of a rising dividend in order to share the creation of value with its shareholders and, in general, to continue to earn their trust for the future.
-
History
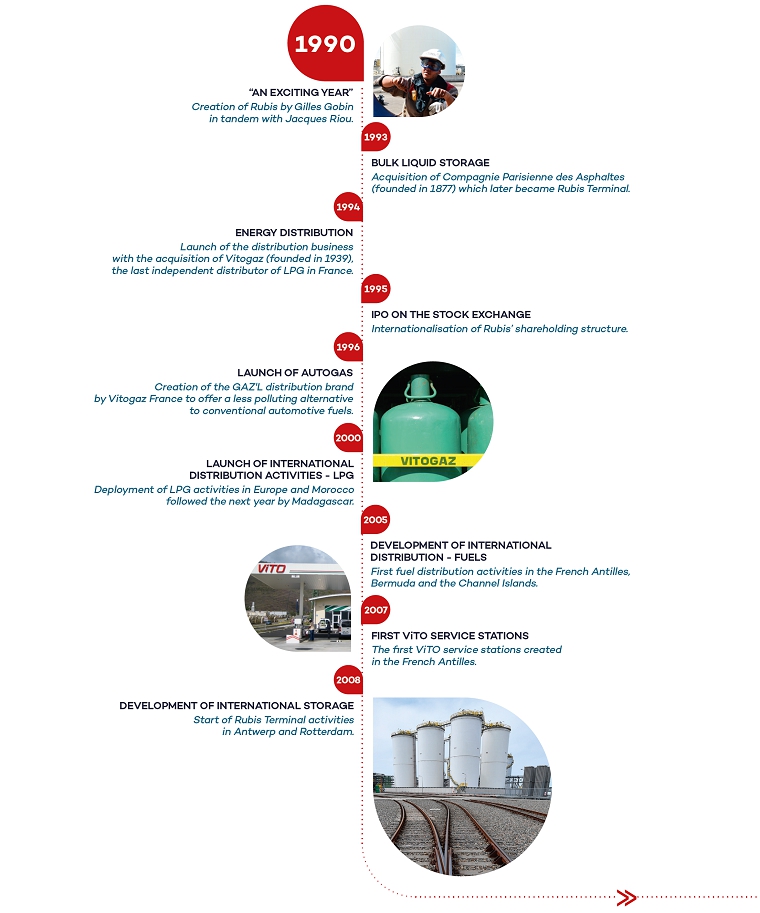
1990 “AN EXCITING YEAR” Creation of Rubis by Gilles Gobin in tandem with Jacques Riou. 1993 BULK LIQUID STORAGE Acquisition of Compagnie Parisienne des Asphaltes (founded in 1877) which later became Rubis Terminal. 1994 ENERGY DISTRIBUTION Launch of the distribution business with the acquisition of Vitogaz (founded in 1939), the last independent distributor of LPG in France. 1995 IPO ON THE STOCK EXCHANGE Internationalisation of Rubis’ shareholding structure. 1996 LAUNCH OF AUTOGAS Creation of the GAZ’L distribution brand by Vitogaz France to offer a less polluting alternative to conventional automotive fuels. 2000 LAUNCH OF INTERNATIONAL DISTRIBUTION ACTIVITIES - LPG Deployment of LPG activities in Europe and Morocco followed the next year by Madagascar. 2005 DEVELOPMENT OF INTERNATIONAL DISTRIBUTION - FUELS First fuel distribution activities in the French Antilles, Bermuda and the Channel Islands. 2007 FIRST ViTO SERVICE STATIONS The first ViTO service stations created in the French Antilles. 2008 DEVELOPMENT OF INTERNATIONAL STORAGE Start of Rubis Terminal activities in Antwerp and Rotterdam.
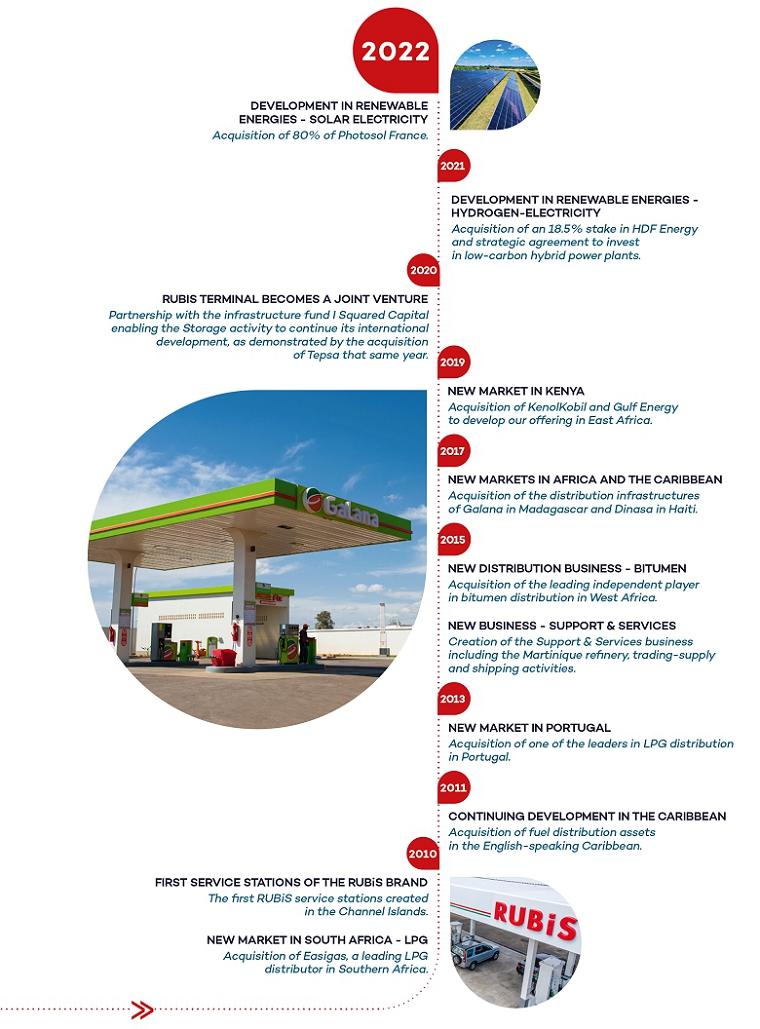
2022 DEVELOPMENT IN RENEWABLE ENERGIES - SOLAR ELECTRICITY Acquisition of 80% of Photosol France. 2021 DEVELOPMENT IN RENEWABLE ENERGIES - HYDROGEN-ELECTRICITY Acquisition of an 18.5% stake in HDF Energy and strategic agreement to invest in low-carbon hybrid power plants. 2020 RUBIS TERMINAL BECOMES A JOINT VENTURE Partnership with the infrastructure fund I Squared Capital enabling the Storage activity to continue its international development, as demonstrated by the acquisition of Tepsa that same year. 2019 NEW MARKET IN KENYA Acquisition of KenolKobil and Gulf Energy to develop our offering in East Africa. 2017 NEW MARKETS IN AFRICA AND THE CARIBBEAN Acquisition of the distribution infrastructures of Galana in Madagascar and Dinasa in Haiti. 2015 NEW DISTRIBUTION BUSINESS - BITUMEN Acquisition of the leading independent player in bitumen distribution in West Africa. NEW BUSINESS - SUPPORT & SERVICES Creation of the Support & Services business including the Martinique refinery, trading-supply and shipping activities. 2013 NEW MARKET IN PORTUGAL Acquisition of one of the leaders in LPG distribution in Portugal. 2011 CONTINUING DEVELOPMENT IN THE CARIBBEAN Acquisition of fuel distribution assets in the English-speaking Caribbean. 2010 FIRST SERVICE STATIONS OF THE RUBiS BRAND The first RUBiS service stations created in the Channel Islands. NEW MARKET IN SOUTH AFRICA - LPG Acquisition of Easigas, a leading LPG distributor in Southern Africa.


Retail & Marketing
(Rubis Énergie)Business Customers Distribution of energy and bitumen The customers of our service stations, private individuals, professionals in industry, services and public works 

Support & Services
(Rubis Énergie)Business Customers Trading-supply, logistics, shipping and refining (SARA) Our distribution subsidiaries and energy distribution professionals 

Equity method (EM) since 30 April 2020
Storage
(Rubis Terminal JV)Business Customers Bulk liquid product handling and storage Supermarkets, oil companies, chemical and petrochemical groups, agricultural cooperatives and traders -
Strategy
Our business lines
Rubis, a company listed on Euronext Paris (SBF 120) with market capitalisation of €2.7 billion at the end of 2021, specialises in the distribution of energy and bitumen, from supply to the end customer, and, through its Rubis Terminal JV, in bulk liquid storage.
With revenue of €4.6 billion and distributed volumes of 5.4 millionm3, the Group is recognised in the market for its expertise and the quality of its services. Thanks to its international development strategy, the Group now occupies strong market positions in diversified segments, in more than 40 countries in three regions: Africa, the Caribbean and Europe.
Rubis aims to give as many people as possible access to reliable and sustainable energy while developing less carbon-intensive solutions, thereby promoting sustainability.
the Retail & Marketing of fuels (in service stations or to professionals), lubricants, liquefied gas and bitumen activity through its subsidiary Rubis Énergie. This is the Company’s core business, representing 87% of the Group’s consolidated revenue in 2021;
the Support & Services activity, upstream of Retail & Marketing, which includes the trading-supply and shipping activities. This activity represented 13% of the Group’s consolidated revenue in 2021;
Retail & Marketing activities are aimed at both professional and individual customers, via our service stations, butane and propane cylinders or home deliveries of fuels or liquefied gas for heating, hot water production or cooking. The Support & Services and Storage activities are intended exclusively for professional customers (BtoB).
The products sold are essential for the economies of the countries in which the Group operates and Rubis generally controls the entire logistics chain, notably through its Support & Services activity. Rubis favours a dominant local positioning in which its competitive advantage is protected by the control of its logistics. This strategic choice guarantees its customers sustainable access to the energy they need on a daily basis.
In its Retail & Marketing activity, Rubis is positioned on markets that allow it to transfer price volatility to the end customer and thus to see stable margins over a long period. In addition, Rubis both operates on regulated markets (40% of the volumes distributed and around 34% of the business’ gross profit) and on open markets. Regulated markets are mainly located in the Caribbean and Africa and serve the end consumer, both in the residential liquefied gas segment or service stations. The BtoB segment is not concerned by regulated prices.
Conscious of the challenges of the energy transition, the Group is developing a range of less carbon-intensive energies (biofuels, hybrid systems, etc.) and is also raising awareness among consumers on this subject, for mobility, heating or industrial uses.
Rubis is thus approaching the energy transition confidently thanks to its role as a key link in the logistics chain, equally capable of storing, shipping and transporting new energy to the end consumer.The Group also made a strategic choice in 2021 by deciding to invest in the production of low-carbon energy.
While for several years, the Group has looked to diversify its offering and propose lower-carbon energies to its customers, in 2021, Rubis finalised a strategic shift towards renewable energies. By investing in hydrogen-electricity projects with HDF Energy and acquiring Photosol France, the Group is now a producer of low-carbon energy.
In 2020, the Group sold 45% of Rubis Terminal and created a joint venture with the infrastructure fund I Squared Capital enabling it to almost completely deleverage. This transaction gave the Group the resources to invest in new growth drivers. The acquisition of Tepsa, a leader in storage in Spain, particularly in biofuels, followed by the disposal of the terminal in Turkey in January 2022, enabled the Rubis Terminal JV to increase the share of chemicals, biofuels and other non-petroleum products in its portfolio.
At the end of 2021, the Company announced a decisive acquisition, Photosol France, and thus accelerated its development in the renewable energy segment with significant growth opportunities.
Photosol is one of the independent leaders in photovoltaic production in France with 330 MW of operational capacity (78 plants) and 145 MW under construction. The Company is very well positioned to seize the opportunity of the French solar energy market with an identified project pipeline of around 3.4 GW. It ranks among the leading independent players in terms of megawatts won from CRE(1) projects during the last 10 calls for tenders in France.
The Company has deliberately focused on less-competitive strategic locations and on the development of complex projects to stand out from the major groups present in this market, a strategy very similar to that developed by Rubis internationally. Numerous synergies exist to develop this activity in areas where the Rubis Group is present.
Following this acquisition, Rubis wishes to create a new division dedicated to the production of renewable or low-carbon energy. This division, which will also bring together projects developed in cooperation with HDF Energy, will accelerate the Group’s growth by relying on long-term secured contracts and growth opportunities.
In the medium term, the objective for this renewable division is to contribute 25% of the Group’s EBITDA.
In 2021, Rubis acquired an 18.5% stake in the capital of HDF Energy (a global pioneer in hydrogen-electricity) and entered into an industrial and financial agreement that provides for a majority investment priority in the projects that HDF Energy is developing in Africa/Indian Ocean, the Caribbean and Europe. This allows Rubis to position itself as a majority direct investor in renewable electricity production projects with the objective of achieving a double-digit Internal Rate of Return (IRR) on the equity invested.
The Group has already invested in two Renewstable® plants developed by HDF Energy in French Guiana and Barbados. In the long term, each of these plants will produce 100% renewable electricity, from the sun and water, to supply the equivalent of 10,000 to 15,000 households all year round, at a lower cost than the diesel power plants in these regions. This technology will avoid the combustion of approximately 12 million litres of diesel and the emission of approximately 40,000 tonnes of CO2 per year and per plant compared to an equivalent thermal plant.
Rubis is positioned in confidential-sized markets that do not interest the major oil companies (Shell, BP, Exxon, TotalEnergies) or international traders (Vitol, Trafigura, Glencore, Mercuria). These global players tend to focus on large markets, in order to benefit from economies of scale. It is precisely in these smaller-sized markets that Rubis has chosen to develop, where it can occupy leading positions while competing with major oil companies, regional operators (Parkland/Sol, Vivo Energy, Repsol) and local independent players (particularly in Africa).
Rubis has been built on an acquisition model, with niche product positions (liquefied gas in Europe, bitumen in West Africa) or geographical niches (island positions in the Caribbean or the Indian Ocean) where the Group has strong positions. Rubis’ success in these markets is ensured by a number of factors, including control of import logistics facilities, to guarantee advantages in terms of costs and supply quality. This robust logistics (shipping, storage, refining) also allows it to be present in trading and supply vis-a-vis third parties.
Region
Principal marketsInfrastructure Market
position(2)Main
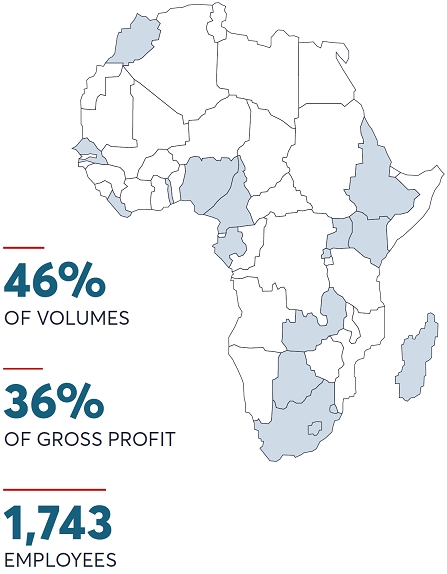
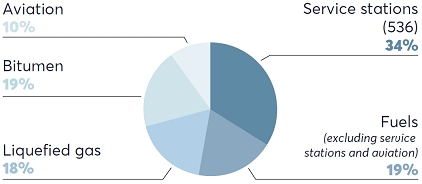
competitorsAFRICA 36% of gross profit(1)
Service stations, commercial, aviation fuel, liquefied gas, bitumen, lubricants
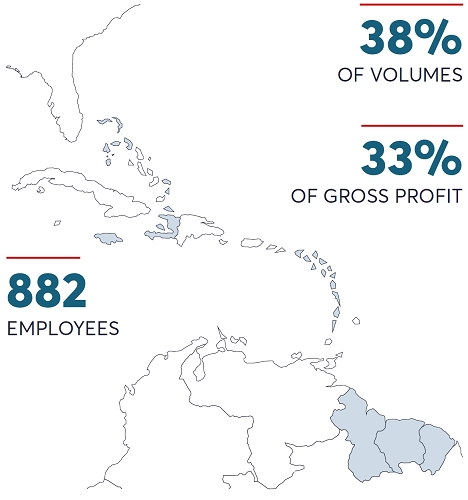
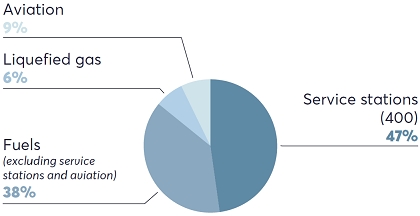
Control of the supply chain (purchasing, transport, distribution) thanks to fully-owned vessels, import terminals, gas cylinder filling plants and a network of service stations No. 1 or 2 in most countries and all markets TotalEnergies, Vivo Energy (Shell and Engen brands), NOC, Oilibya, as well as independent local players CARIBBEAN 33% of gross profit(1)
Service stations, commercial, aviation fuel, liquefied gas, lubricants
• Control of the supply chain (purchasing, transport, distribution) thanks to fully-owned vessels, import terminals, gas cylinder filling plants and a network of service stations
• 71% stake in the French Antilles refinery (SARA)
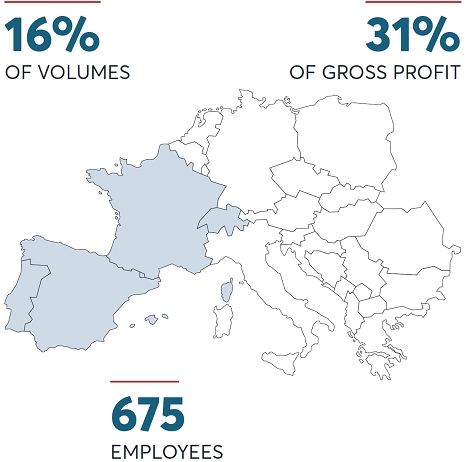
No. 1 or 2 in most countries and all markets Parkland (Sol), GB Group, TotalEnergies, Guyoil, as well as independent local players EUROPE 31% of gross profit(1)
Mostly liquefied gas, a small number of service stations
Gas cylinder filling plants, storage terminals No. 1, 2 or 3 in most countries UGI, DCC, Cepsa, Galp, Repsol, SHV The markets in which the Group operates are deep, and energy needs are essential and growing, particularly in the regions where Rubis has strengthened its presence in recent years (Africa and the Caribbean, representing 47% and 28% respectively of the Retail & Marketing division’s contribution to EBIT).
In Europe, Rubis is positioned in sensitive markets, such as liquefied gas (butane and propane), synonymous with high barriers to entry, and where growth stems from efficiency, reactivity and market share gains.
The Group operates within a defined Quality, Health, Safety & Environment (QHSE) framework to prevent risks and limit the environmental impact of its activity. The QHSE policy framework, referred to in the Group’s Code of Ethics, states that each employee must act responsibly when performing their duties, comply with the health, safety and environmental protection procedures on site, and pay particular attention to compliance by all parties (colleagues, suppliers, external service providers, etc.). This common framework is shared by all Group activities.
Its business lines are subject to regulatory and safety constraints requiring constant investments, making supply scarce while increasing the cost of entering the sector. As such, in 2021 the Group invested €133 million in the safety/maintenance and adaptation of its facilities.
Training is another key area. As some of the products distributed transit by road, driver training programmes (defensive driving) have been implemented for both Group employees and external staff, particularly in countries where this risk is increased.
For the past 30 years, Rubis has pursued an external growth strategy based on strict financial discipline, including modest acquisition multiples and financial leverage, and a clear strategic approach (niche positioning, strong market positions backed by control of resource access infrastructure, and prospects for earnings growth) to ensure value creation for all stakeholders.
With each acquisition, the implementation of a strategy, the provision of skills, capital and a new organisation, not forgetting the Company’s flexibility, have made it possible to form a multi-local, decentralised and independent group with sound market positions protected by concrete assets, guaranteeing its long-term profitability.
Through its business lines, by offering its customers regular and reliable access to everyday energy, thereby limiting its exposure to economic cycles and ensuring resilience and stability for its activities, Rubis posts solid performance.
The strategic shift to the production of renewable energies and the creation of a new division allows the Group to contribute to a more sustainable world, to support the evolution of the energy market and to offer growth for its stakeholders.
Acquisition-led growth, the very core of the Group’s DNA, is one of the chief drivers of Rubis’ development, and would not have been possible without:
the importance given to the human dimension in its structure: the Group sees People as the bedrock of its organisation and one of its key success factors.
Its motto, “The will to undertake, the corporate commitment” expresses this essential value, which is the foundation of the motivation, loyalty and engagement of its 4,335 employees.
Driven by “the will to undertake”, Rubis is constantly on the move, developing and positioning itself as a vector of progress in all areas (governance, social, environmental). From this viewpoint, 2021 will have been an exceptional year of transition.
-
Business model
• A Climate Committee to support our energy transition • 45%* of sites certified • €1.31M donated to community investment and social engagement initiatives • 35* Compliance Advisors • Supply control of our Retail & Marketing businesses • 1,026 service stations in 23 countries • 113* industrial sites worldwide • €206M in capital expenditure • 6 fully-owned vessels and 9 time charters • €2.7Bn: Group market capitalisation • €465M: free cash flow (after cost of net financial debt and tax) • 0.9: ratio of net financial debt to EBITDA Give as many people as possible regular and reliable access to energy to meet their basic needs (mobility, cooking, heating, etc.).
Provide the energy necessary for the operation of industry and professionals.
Distributing energy for everyday life
80 operational subsidiaries in Africa, the Caribbean and Europe.
A decentralised system as close as possible to local challenges.
Support the energy transition by offering our customers less carbon-intensive solutions.

RETAIL & MARKETING
Fuels, liquefied gases, bitumen
87% OF SALES REVENUE
90% of the service station network is located in Africa and the Caribbean.
100% of bitumen is distributed to develop infrastructure in Africa.
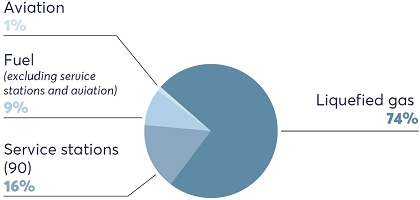
74% of sales revenue in Europe comes from the distribution of liquefied gases.
SUPPORT & SERVICES
Trading, supply, shipping
13% OF SALES REVENUE
Ensure the reliability and sustainability of our Retail & Marketing activities in areas where supply is complex.
Operate a refinery to supply energy to the French Antilles.
STORAGE
Activity carried out as a joint venture and accounted for under the equity method since 30 April 2020
3.9 MILLION M3
OF STORAGE CAPACITY45% for fuels.
55% for chemicals, biofuels and agrifood products.
4 countries in Europe.
INDIVIDUALS
• Customers of our service stations for their mobility and related services (shops, car washing, etc.).
• Users of liquefied gas in tanks (home delivery) or in cylinders for heating and cooking.
PROFESSIONALS
A very broad and diversified spectrum of customers, including the following sectors:
• manufacturing
• farming
• services
• utilities
• public works
• Promotion of less carbon-intensive energies (liquefied gases, biofuels, etc.) • €188M: taxes
• 0* major industrial accidents
• Nearly 200,000 people benefiting from our community investment actions
• Continuity of supply essential to the economies of the countries where the Group operates
• 15% of cash flow allocated to growth investments • Geographic diversity of business lines and products • Geographic diversity of business lines and products • No. 1 or 2 in market share depending on the region
• €293M: net income, Group share • €182M distributed to shareholders • €153M: share buybacks • €2.86: earnings per share • €1.86**: amount of dividend per share • 9%: compound growth over 10 years in earnings per share • 8%: compound growth over 10 years in dividend per share • 12%: ROCE over 2017-2021 (average over 5 years) CORPORATE SOCIAL RESPONSIBILITY
Through its goal of providing access to energy to as many people as possible, particularly in regions where a large part of the population lacks access to energy, Rubis contributes first and foremost to the United Nations Sustainable Development Goal (SDG) 7 “Affordable and clean energy.”
More generally, the Group conducts its activities in accordance with a CSR approach that contributes to the SDGs. The implementation of demanding HSE standards to limit the impact of its activities on people (SDG 3) and the environment (SDGs 6 and 15), commitments to combat climate change (SDG 13), policies to promote team diversity (SDG 5) and increase the sharing of value created (SDG 8), and anti-corruption standards in line with the best international standards (SDG 16) are some practical examples.
The Group’s community investment and social engagement complement this commitment by contributing to regional development.

Target of 30% reduction in CO2 emissions by 2030 (reference year 2019, covering Rubis Énergie - scopes 1 and 2) 
Target of an average of at least 30% women on the Management Committees of Rubis Énergie and its subsidiaries by 2025 
-
Key figures
The Group once again demonstrated the strength of its business model, succeeding in generating growth of 4% in its net income, Group share and 7% in its cash flow (excluding Rubis Terminal) compared to 2020. 2021 adjusted net income, Group share (excluding non-recurring items, IFRS 2 expenses and the contribution of Rubis Terminal) is almost back to the pre-pandemic level (record level observed in 2019), despite the constraints that weighed on overall mobility.
“This year, Rubis became a multi-energy group, returned to sustained growth and once again demonstrated the strength of its business model in a market context that remains tight.
-
Stock market and shareholding structure
Securities services
Caceis Corporate Trust
12 place des États-Unis
CS 40083
92549 Montrouge Cedex - France
Shareholder services
Shareholders wishing to contact the Company may call the dedicated hotline at: +33 (0)1 45 01 99 51
Investor services
Anna Patrice –
Head of Investor Relations
investors@rubis.fr
Tel.: +33 (0)1 45 01 72 32
Brokerage firms following the stock
Berenberg, CM-CIC, Exane BNP Paribas, Gilbert Dupont, Kepler Cheuvreux, Oddo, Portzamparc and Société Générale
2022 agenda Thursday 10 March
2021 annual results
Thursday 5 May
First quarter 2022 revenue
Thursday 9 June
2022 Shareholders’ Meeting
Tuesday 14 June
Ex-dividend date and listing of ex-dividend shares
Thursday 16 June
Payment of the dividend in cash
Thursday 7 September
2022 half-year results
Tuesday 8 November
Third quarter 2022 revenue
Tuesday 7 February
Fourth quarter 2022 revenue
• Listing market
Euronext Paris - compartment A
(since 11 January 1995)• ISIN code
FR0013269123• Nominal value
€1.25• Average price in 2021
€34.69 (average closing price, source: Euronext)• Average daily volume traded
487,468 shares
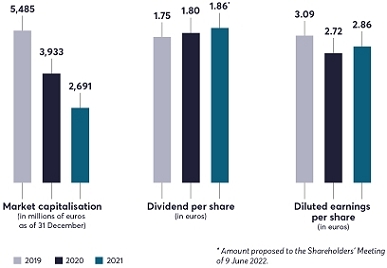
(source: Bloomberg)• Market capitalisation
€2,691 million
(as of 31 December 2021)• Member of stock market indices
SBF 120 - CAC MID 60• Others
Eligible for share savings plans (PEA) -
Activities
Our mission is to meet the essential energy needs of populations in Africa/Indian Ocean, the Caribbean and Europe, for mobility (through a network of more than 1,000 service stations) and for cooking or heating (thanks to liquefied gas sold in bulk or in cylinders).
We also distribute our products to professional customers (marine and aviation fuels, fuel for electricity production, liquefied gas for industry or hotels, etc.).
Lastly, in Africa, we distribute bitumen in markets where demand for road infrastructure is growing.
The Retail & Marketing activity represents 87% of the Group’s revenue and 70% of the Group’s EBIT.This business benefits from diversification both geographically and by segment/product, ensuring stable and resilient performance, little affected by economic cycles.
Our strength lies in our decentralised organisation, with each profit centre corresponding to a Group subsidiary.This system ensures that local Managers have a deep understanding of their region and provides for an appropriate investment policy. This organisation has been in place for many years within Rubis Énergie, and has consistently demonstrated its effectiveness. It results in motivated and responsible teams, flexibility allowing reactivity and efficiency, and market share gains.
The regions in which Rubis operates do not have uniform economic development and differ in terms of their market structure, their opportunities and their challenges. The decentralised approach appears to us to be the most suitable for adjusting Rubis’ approach and being better positioned to meet local needs in compliance with the rigorous HSE and ethics standards defined by the Group.
Aware of the major contribution its industry sector can make to tackle climate change, Rubis Énergie is developing a carbon reduction programme to reduce the CO2 emissions related to its activities and to diversify the range of products distributed. This diversification is based on three focuses:
The climate constraint can also be a source of innovation and business opportunities. For example, Rubis was one of Europe’s pioneers in the distribution of HVO, a second-generation biofuel that reduces CO2 emissions by at least 50% compared to conventional diesel. The Group intends to expand the development of biofuels, while continuing to be a driving force in Africa to popularise the use of liquefied gas, which is the transition energy recommended by the public authorities and the WHO as a cooking method, rather than charcoal or kerosene, to combat deforestation and prevent respiratory diseases.
• East Africa
Ongoing rebranding of service stations and improvement to the customer offering (170 stations already rebranded at the end of 2021).• Suriname
Development of a network of service stations bearing the RUBiS colours.• Bitumen
Ongoing development in this growing market in Africa.• Solarisation
Continuation of the solarisation programme for service stations and administrative premises initiated in 2021.Market position*
(main segment)Liquefied
gasNumber of
service stationsCommercial
fuelAviation
fuelBitumen Total RUBIS ÉNERGIE (RETAIL & MARKETING) 1,026 Volumes (‘000 m3) 1,226 1,965 1,316 428 467 5,401 Terminals/storage (‘000 m3) 175 White products: 1,060 203 102 1,539 AFRICA 
536 46% volume; 36% gross profit Volumes (‘000 m3) 453 848 456 238 464 2,459 Terminals/storage (‘000 m3) 42 505 92 99 738 • South Africa 2 • Botswana 2 • Comoros Islands 1 • Djibouti 1 11 • Ethiopia 29 • Kenya 3 240 • Réunion Island 1 52 • Lesotho 2 • Madagascar 1 73 • Morocco 3 • Nigeria 1 • Uganda 53 • Rwanda 2 41 • Senegal 1 • Swaziland 2 • Togo 1 • Zambia 37 CARIBBEAN 400 38% volume; 33% gross profit Volumes (‘000 m3) 126 978 778 187 2 2,070 Terminals/storage (‘000 m3) 19 532 108 3 661 • Antilles - French Guiana 2 86 • Bermuda 1 12 • Eastern Caribbean 2 77 • Barbados 2 18 • Grenada 1 11 • Guyana 3 11 • Antigua 1 7 • St. Lucia 1 16 • Dominica 2 7 • Saint-Vincent 2 6 • Suriname 1 • Western Caribbean 2 31 • Bahamas 22 • Turks and Caicos Islands 9 • Haiti 1 135 • Jamaica 2 48 • Cayman Islands 1 - 2 11 EUROPE 90 16% volume; 31% gross profit Volumes (‘000 m3) 647 139 82 3 872 Terminals/storage (‘000 m3) 114 24 3 141 • Spain 3 • France 4 of which Corsica 62 • Channel Islands 1 28 • Portugal 2 • Switzerland 1 * Rubis estimates. Rubis has been present in Africa for more than 20 years, with a very diversified product offering: liquefied gas in Morocco and South Africa; bitumen in West and South Africa; multi-product (liquefied gas, fuels, etc.) in East Africa, Réunion Island and Madagascar.
A vast programme of renovations and rebranding to the RUBiS colours is underway in our 400 service stations in East Africa. On this occasion, we are improving the customer offering by proposing additional services (convenience stores, restaurant services, car washing, etc.) in order to increase footfall.
We also launched a solarisation programme for several service stations and administrative premises, particularly in Kenya and Madagascar.
Rubis benefits from its strong position in the region (usually No. 1 or No. 2), its control of the supply chain and its positioning in growing markets.
Liquefied gas is considered the best energy alternative to charcoal and wood for cooking and heating. Thus, for example, the governments of South Africa, Madagascar and Kenya are targeting a significant increase in market penetration by liquefied gas.
The strong demand for road infrastructure and current investments have favoured the bitumen distribution business, which has been growing strongly for two years. The Group has thus expanded in three new countries, South Africa, Gabon and Liberia.
Rubis has been in the region since 2005 via numerous acquisitions and has a significant market share. The Group is active in the main product segments, service stations, aviation and commercial fuels, liquefied gas and lubricants.
To meet the needs of companies and manufacturers, we are strengthening our commercial activity, particularly in new peripheral markets such as Guyana and Suriname.The latter country, where we commissioned a storage terminal in 2019, has just welcomed a first service station under the RUBiS colours.
For several years, the focus has been on the additional services offered to our customers in our network and, today, the 400 service stations in the region, most of them bearing the RUBiS or ViTO colours, benefit from a very good brand image widely recognised in the islands.
In Europe, Rubis is mainly present in the liquefied gas segment, the Group’s historical activity with residential and professional customers, which represents more than 90% of the region’s net income.
Liquefied gas stands out for its ease of transport and storage. It is, therefore, a practical solution for rural areas not connected to the natural gas network. For several years now, more and more consumers have also chosen to replace their old fuel oil boilers with gas boilers, which emit less CO2. Rubis is present in this market in France, Spain, Portugal and Switzerland.
In Corsica and the Channel Islands, Rubis distributes its fuels through a network of service stations (62 and 28 service stations respectively), and also offers aviation and commercial fuels.
The Group has a strong presence in the autogas (LPG motor fuel) segment in France and in Spain. Autogas is an alternative to conventional fossil fuels, generating lower CO2 and virtually zero particulate emissions.
Rubis is also developing new products to meet the challenges of the energy transition, with the medium-term objective of distributing them in all of its subsidiaries.These include HVO (used oil-based biofuel) and the EcoHeat100, a 100% renewable domestic fuel currently marketed in the Channel Islands.
The Support & Services activity includes all infrastructure, transportation, supply and service activities supporting downstream Retail & Marketing activities.
We currently operate nine vessels on time charter and own six vessels, four of which are bitumen tankers and two are fuel tankers. The order for a new fuel tanker (the Demerara) and a bitumen tanker (the Bitu River) was launched to meet our future shipping needs.
An important milestone was achieved this year since Rubis Énergie joined the Sea Cargo Charter, an initiative to promote responsible shipping, greater transparency in climate reporting and better decision-making for the chartering of vessels, in line with the carbon reduction objectives of the United Nations.
In conjunction with the Group Climate Committee, we are studying the various alternatives to optimise our journeys and limit the environmental impact of shipping in order to achieve the CO2 emission reduction targets set in the Group’s CSR Roadmap, Think Tomorrow 2022-2025.
The Antilles refinery (SARA), 71% owned by Rubis Énergie, is located in Martinique and is the sole supplier of fuels to three French departments in the Americas: French Guiana, Guadeloupe and Martinique. Its prices and profitability are regulated by government decree. It has a production capacity of 800,000 tonnes per year and produces a full range of products complying with European environmental standards: fuels for road, sea, air mobility (jet, kerosene, diesel), liquefied gas (LPG), etc. adapted to local needs. SARA wants to go even further and is positioning itself as both a producer and supplier of low-carbon fuels for land, air and maritime mobility such as hydrogen and bioNGV.
SARA has approximately 330 direct employees and more than 300 subcontractors. Its facilities are distributed as follows:
With the implementation of the Group’s CSR policy and in line with the vision of its shareholders, SARA is investing in three major areas:
• the operational excellence of its core business, including the reduction of its carbon footprint by 2030; • its consistent and pragmatic positioning within the French departments in the Americas on issues relating to new energies, such as hydrogen fuel cells or the production of bioNGV; • its involvement, in close collaboration with local authorities, universities in the French Antilles-French Guiana, and private stakeholders, in actions related to health, education and the environment, particularly in low-carbon and environmental projects such as the fight against the proliferation of Sargassum. • Delivery of the Morbihan vessel that arrived in the Caribbean at the end of 2021. • Rubis Énergie becomes a signatory to the Sea Cargo Charter. • Installation of four new furnaces during the Major Shutdown, improving efficiency and therefore reducing CO2 emissions. • ISO 50001 certification (energy management system). • Delivery of the bitumen tanker, Bitu River. • Construction of a new tanker, the Demerara, identical to the Morbihan. • Launch of the SOLARé project, a rooftop photovoltaic power plant enabling 70% self-consumption at the Jarry terminal in Guadeloupe. • Design and construction of a green hydrogen production unit for mobility purposes in Martinique. The Rubis Terminal JV specialises in the storage and handling of bulk liquid and liquefied products, such as fuels, chemical and agrifood products. Its role is to act as an essential link in the logistics chain of its customers (supermarkets, oil groups, chemical and petrochemical companies, traders, etc.) by storing their local or imported products, for short or long periods according to their needs.
Following the signing of a partnership with the infrastructure fund I Squared Capital, Rubis Terminal is now 55%-owned by Rubis SCA and accounted for under the equity method since 30 April 2020. The acquisition of Tepsa in 2020 and the disposal of the oil terminal in Turkey in early 2022 have made it possible to refocus its activities on Western Europe, with the Company now the fourth largest(1) terminal operator in Europe and the leading operator in France.
With storage revenues of €222 million and EBITDA of €121 million (including 50% of Antwerp and excluding Turkey), the joint venture has a storage capacity of 3.9 million m3. Its 14 terminals, designed to meet the requirements of its customers while guaranteeing a safe working environment, are located in strategic hubs in France, the Netherlands, Belgium and Spain. To ensure effective integration into supply chains, they are all multimodal, with maritime, river, rail and road connections and pipelines. Each has its own history and areas of specialisation. The terminals mainly serve as regional distribution centres, supplying retail markets and industrial customers.
Determined to work for a more sustainable future, the Rubis Terminal JV is diversifying its range of products by developing biofuels, chemical and agrifood products, which today represent more than 50% of 2021 storage revenue. It offers its customers solutions to support them in the energy transition and carbon reduction of their supply chains by using innovative logistics tools and drawing on its know-how. The Company was also the first in France to successfully store E85 bioethanol, a less polluting fuel that is increasingly used and contains 85% ethanol.
Today, the increasing storage volumes dedicated to UCO (used cooking oils) in Spain, biofuels (such as B100 and E85) in France and Spain, and the launch of our ethanol hub in the Netherlands illustrate this shift towards less carbon-intensive products. The integration of new products, including green hydrogen in the medium term, will be among the next major steps.
maintaining a good level of competitiveness in a safe and secure environment by continuing to respond to market needs and changing demands;
continuing to develop terminals in the ARA-D zone (Amsterdam, Rotterdam, Antwerp and Dunkirk) and in the Mediterranean.
BREAKDOWN OF STORAGE REVENUE BY PRODUCT CATEGORY FUELS Fuels (motor and heating fuels) such as diesel and petrol distributed in service stations, 45 aviation fuels, marine fuels and household % fuels used for individual and collective heating systems CHEMICALS Chemical products for the manufacture 39% of plastics, polystyrenes and common household products BIOFUELS Alternatives to petroleum products, of vegetable origin 10% AGRIFOOD Agro-industrial products, including liquid fertilisers, 6% edible vegetable oils, biofuels and molasses for various industrial applications
-
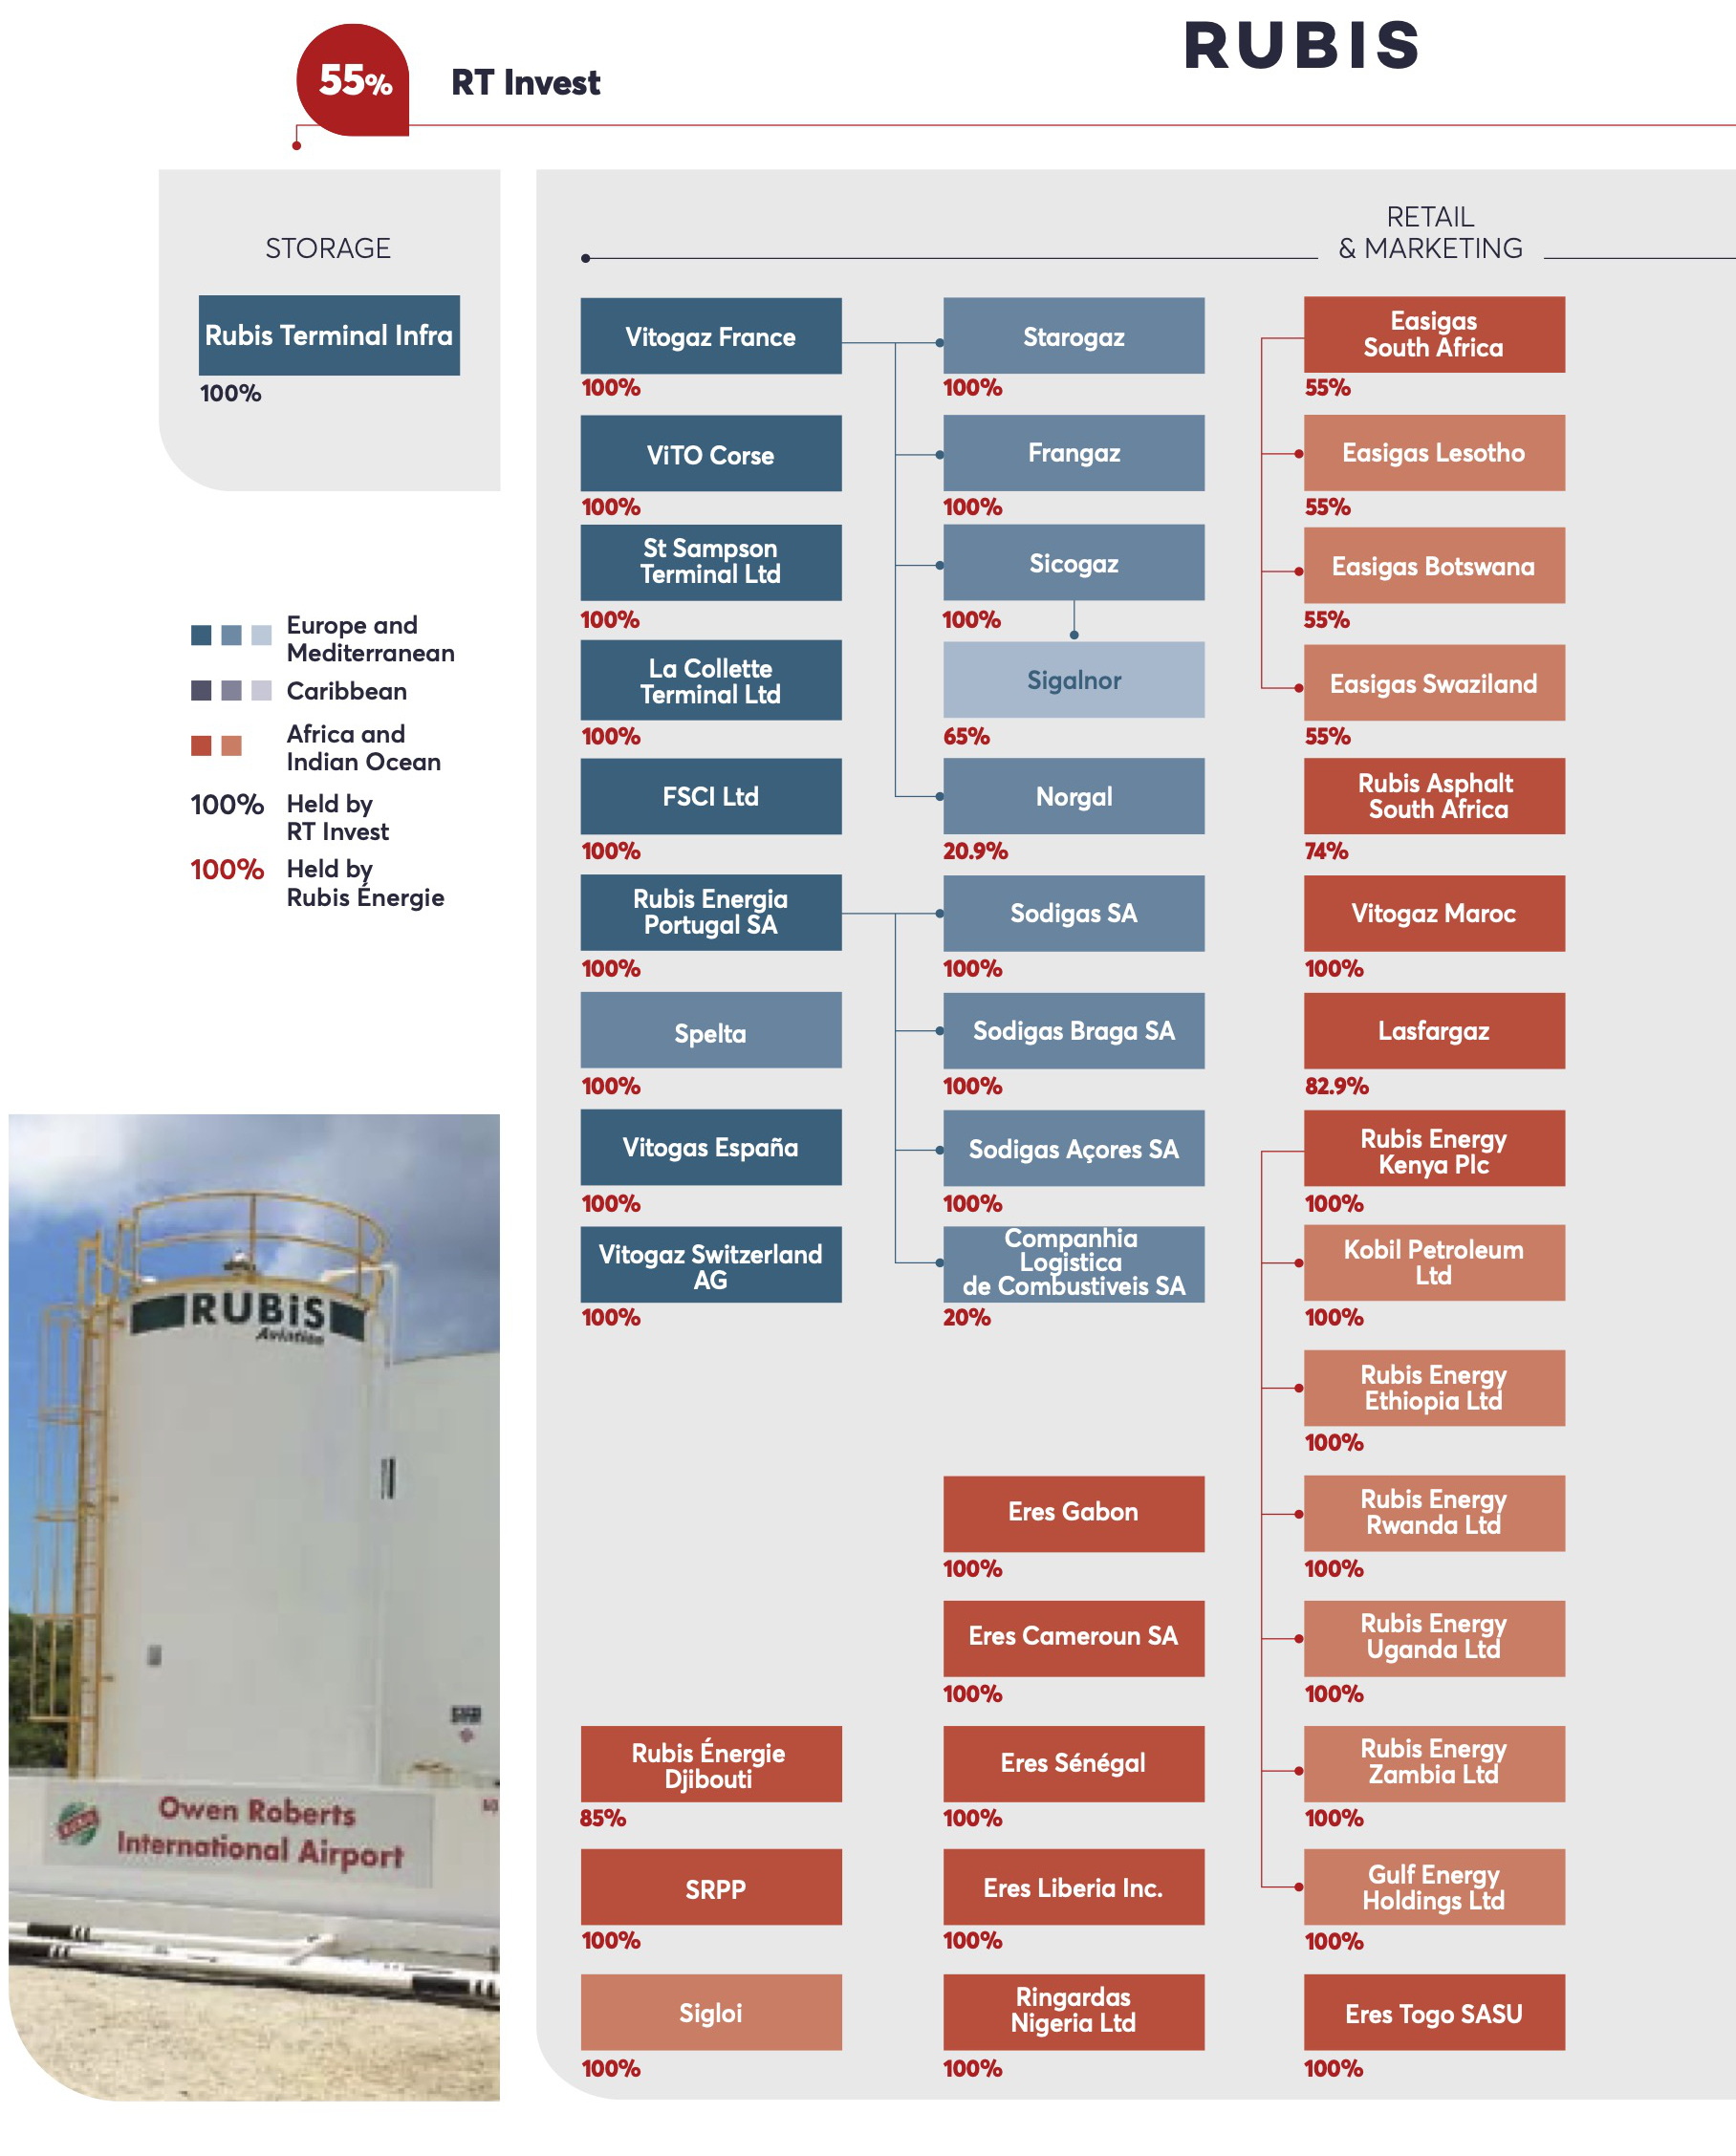
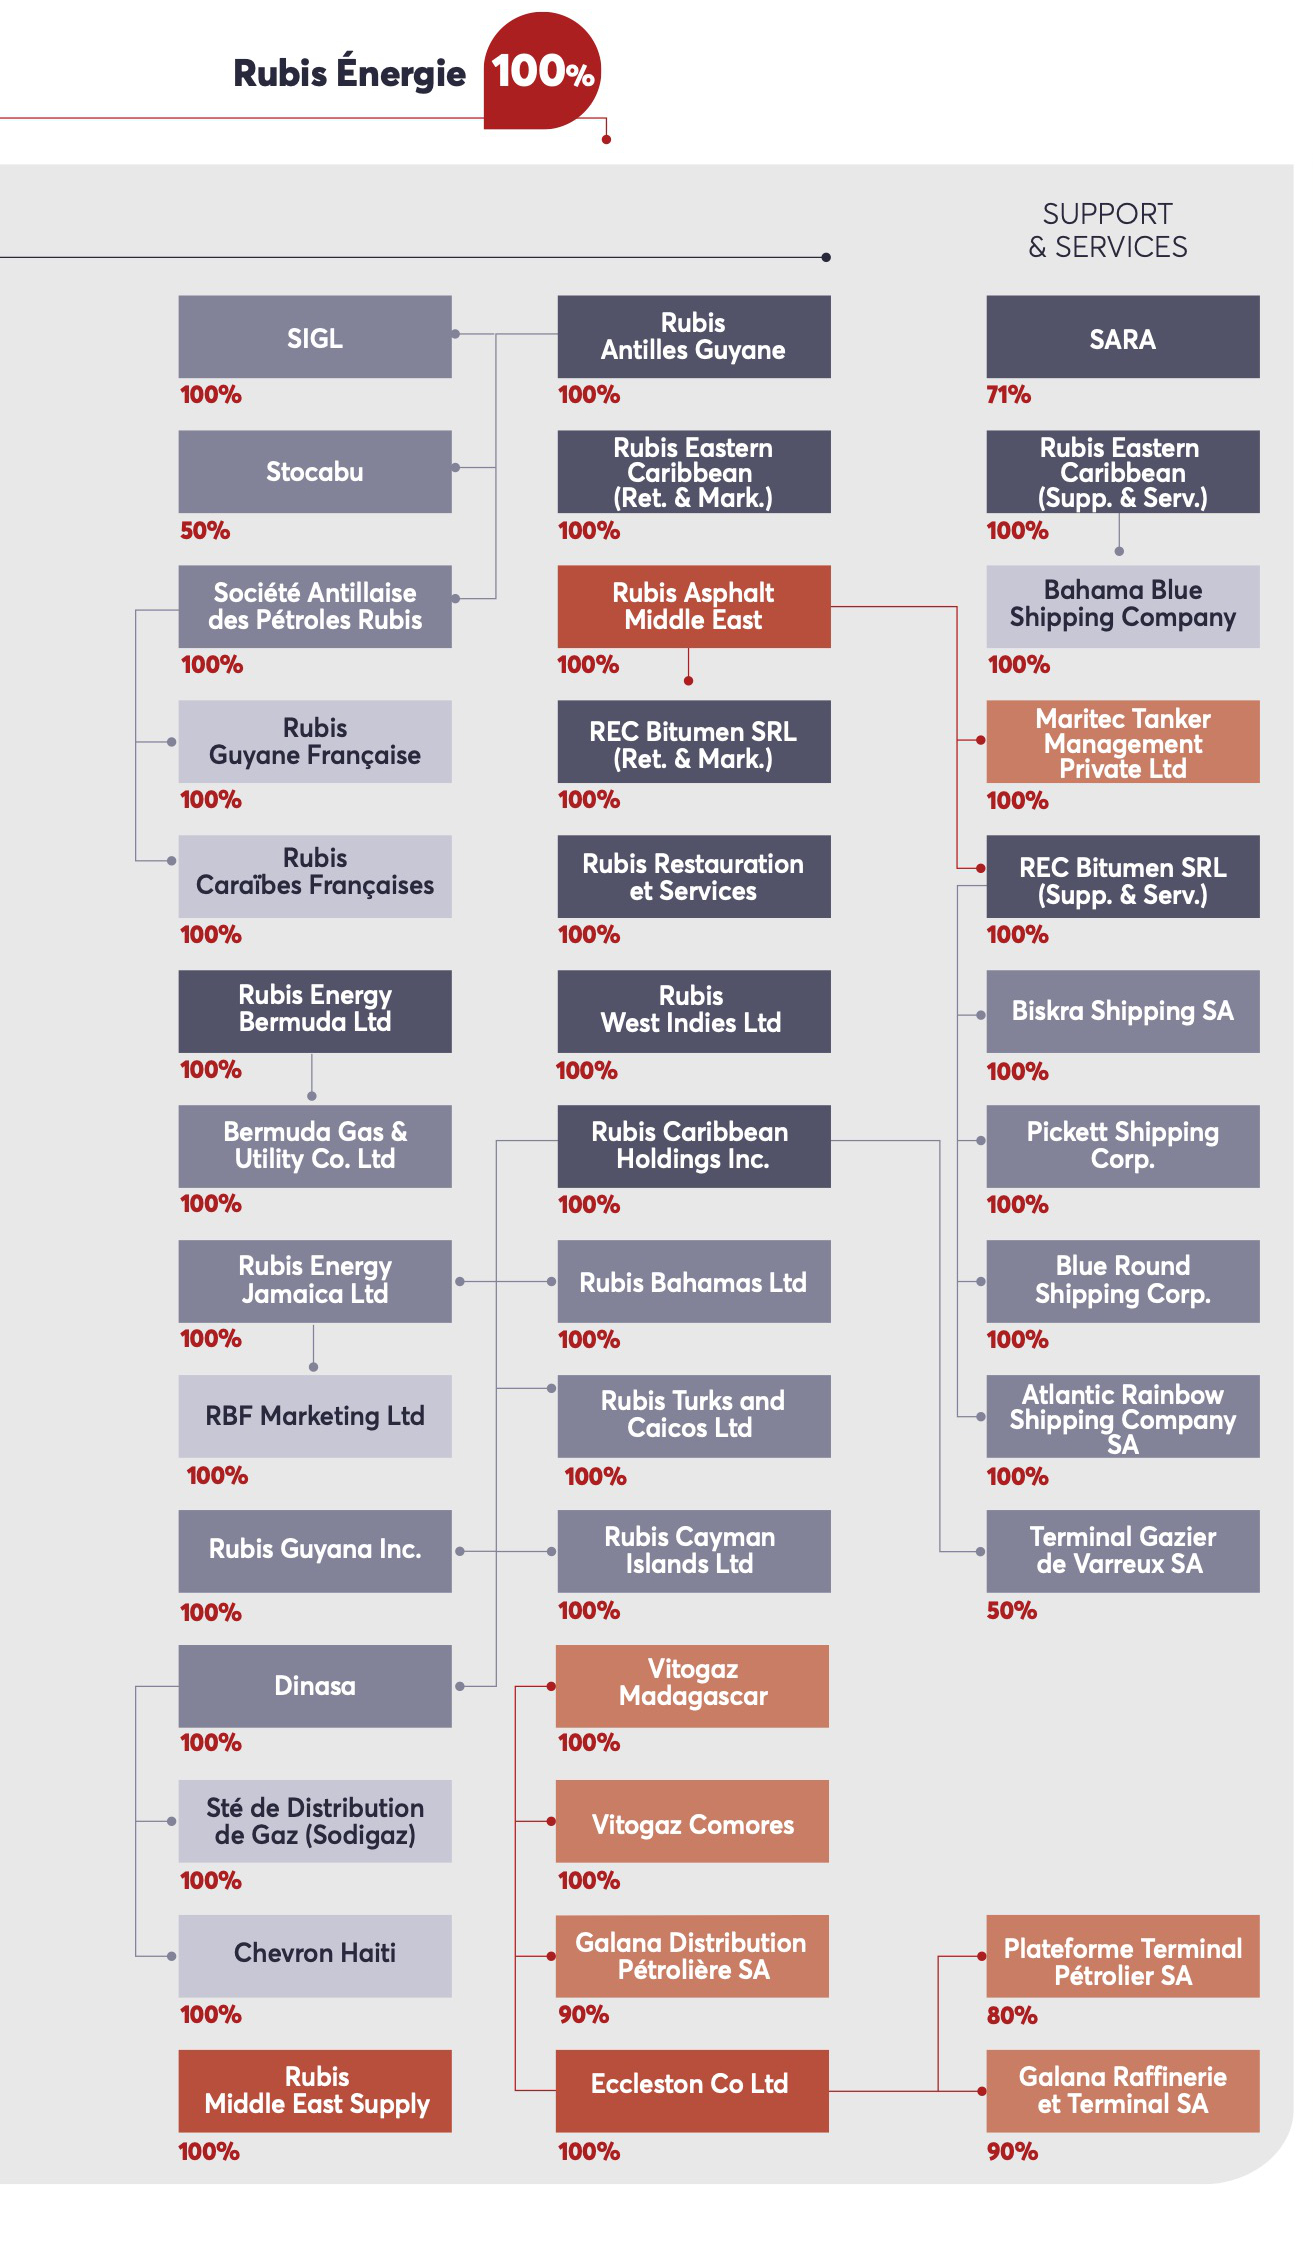
Organisation chart
RUBIS RETAIL STORAGE & MARKETING RT Invest Rubis Terminal Infra Vitogaz France ViTO Corse St Sampson Terminal Ltd La Collette Terminal Ltd FSCI Ltd Rubis Energia Portugal SA Spelta Vitogas España Vitogaz Switzerland AG Eres Togo SASU Eres Cameroun SA Eres Gabon Eres Sénégal Eres Liberia Inc. Starogaz Frangaz Sicogaz Sigalnor Norgal Sodigas SA Sodigas Braga SA Sodigas Açores SA Companhia Logistica de Combustiveis SA Vitogaz Maroc Rubis Asphalt South Africa Ringardas Nigeria Ltd Rubis Energy Ethiopia Ltd Rubis Energy Rwanda Ltd Rubis Energy Uganda Ltd Rubis Energy Zambia Ltd Easigas South Africa Easigas Lesotho Easigas Botswana Easigas Swaziland Rubis Énergie Djibouti Lasfargaz Rubis Energy Kenya Plc Kobil Petroleum Ltd SRPP Sigloi Europe and Mediterranean Caribbean Africa and Indian Ocean 100% Held by RT Invest 100% Held by Rubis Énergie Gulf Energy Holdings Ltd 100% 100% 100% 100% 100% 100% 100% 100% 100% 100% 100% 100% 100% 100% 100% 65% 20.9% 100% 100% 100% 20% 100% 100% 100% 100% 100% 100% 55% 55% 55% 55% 100% 74% 85% 100% 82.9% 100% 100% 100% 100% 100% 100%
RUBIS ÉNERGIE (RETAIL & MARKETING) Norgal Antargaz (61.1%) Butagaz (18%) Sigalnor Primagaz (35%) Stocabu Antilles Gaz (50%) Lasfargaz Ceramica Ouadras SA (3.4%) Facemag SA (7.6%) Grocer SA (3.9%) Sanitary BS (2.2%) Rubis Énergie Djibouti Ita Est (Nominees) Ltd (7.5%) IPSE (Nominees) Ltd (7.5%) Easigas South Africa Reatile Gaz Proprietary Ltd (45%) Galana Distribution Pétrolière SA Malagasy State (10%) Companhia Logistica de Combustiveis SA Petróleos de Portugal - Petrogal SA 65% Repsol Portuguesa SA 15% Rubis Asphalt South Africa Reatile Gaz Proprietary Ltd 26% RUBIS ÉNERGIE (SUPPORT & SERVICES) SARA Sol Petroleum Antilles SAS (29%) Galana Raffinerie et Terminal SA Malagasy State (10%) Plateforme Terminal Pétrolier SA Société du Port à Gestion Autonome de Toamasina (20%) Terminal Gazier de Varreux SA West Indies Energy Company SA (WINECO) (50%) -
Activity report
-
2.1Activity report for the 2021 financial year
Rubis Group
Despite an environment marked by the persistence of the health crisis, the extreme volatility of energy prices and inflationary pressures, the Group once again demonstrated the solidity of its business model, succeeding in generating growth of 4% in its net income, Group share and 7% in its cash flow (excluding Rubis Terminal) compared to 2020. Adjusted net income, Group share (excluding non-recurring items, IFRS 2 expenses and the contribution of Rubis Terminal) is almost back to the pre-pandemic level (record level observed in 2019), despite the constraints that weighed on overall mobility.
2021 is also the year of a major strategic shift with a significant acquisition announced in the photovoltaic sector and a development in hydrogen, bringing Rubis directly into the energy transition.
Consolidated results for the year ended 31 December 2021
(in millions of euros)
2021
2020
2019
2021 vs 2020
2021 vs 2019
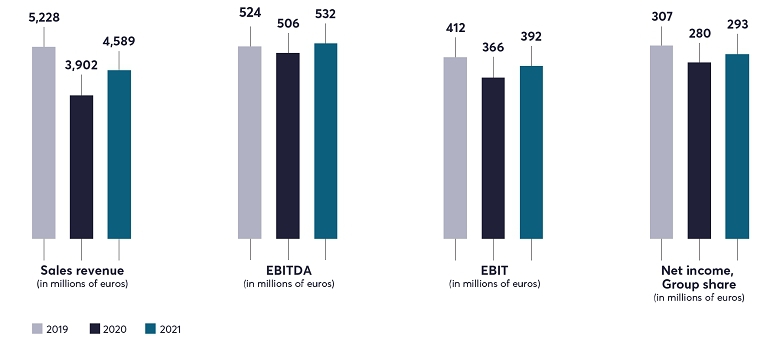
Revenue
4,589
3,902
5,228
+18%
-12%
EBITDA
532
506
524
+5%
+2%
EBIT, of which
392
366
412
+7%
-5%
- •Retail & Marketing
289
269
324
+8%
-11%
- •Support & Services
123
120
108
+2%
+13%
Net income, Group share, of which
293
280
307
+4%
-5%
- •Net income from continuing operations, Group share
293
180
279
+62%
+5%
- •Net income from assets held for sale, Group share
-
100
28
NA
NA
Net income, Group share excluding
non-recurring items, IFRS 2 expense and excluding Rubis Terminal288
247
291
+16%
-1%
Cash flow excluding Rubis Terminal
465
433
461
+7%
+1%
Capital expenditure excluding Rubis Terminal
206
219
168
Net financial debt (NFD)
438
180
637
NFD/EBITDA excluding IFRS 16
0.9
0.4
1.3
Diluted earnings per share
€2.86
€2.72
€3.09
+5%
-7%
Dividend per share
€1.86*
€1.80
€1.75
+3%
+6%
* Amount proposed to the Shareholders’ Meeting of 9 June 2022.
The Group’s multi-country and multi-segment positioning as well as its dual midstream/downstream structure made it possible to overcome difficulties of all kinds, while the Rubis Terminal JV once again demonstrated its resilience and successfully consolidated its subsidiary Tepsa in Spain, enabling it to generate 6% growth in EBITDA excluding Turkey.
- •the gradual return of pre-Covid volumes, particularly in the Caribbean, where tourism and aviation are still at half of 2019 volumes;
- •the growth potential in East Africa thanks to the investments made;
- •the return to a normalised situation in Madagascar;
- •the stabilisation of the situation in Haiti.
The Group’s financial position at the end of the financial year remained solid, with a ratio of net debt to gross operating profit of less than 1. After the acquisition of Photosol, this same ratio is estimated at 2.5 times, reduced to 1.7 by adjusting the project debt (without recourse).
Condensed balance sheet
Overall, Rubis generated cash flow of €465 million (+7% compared to 2020, excluding Rubis Terminal). Unlike the 2020 financial year, the upward trend in supply prices generated a change in working capital of €191 million, bringing operating cash flow to €274 million.
Investments are in line with the Group’s long-term trend, at €205 million and are split two-thirds for maintenance and one-third for growth. An amount of €79 million was invested in HDF Energy (Hydrogène de France), with a 18.5% stake, coupled with an industrial agreement.
As of 31 December 2021, financial debt, excluding lease liabilities, mainly consisted of borrowings from credit institutions for a total amount of €1,014 million, of which €228 million maturing in less than one year, and €276 million in bank overdrafts. Given the Group’s net debt to shareholders’ equity ratio as of 31 December 2021 and its cash flow, the repayment of this debt is not likely to be put at risk due to a breach of covenants. The net increase in financial debt compared to 31 December 2020 is mainly explained by the share buyback programme (€153 million), the investment in HDF Energy (€79 million) and the increase in the working capital requirement (€191 million).
Analysis of changeS in the net financial position
(in millions of euros)
Financial position (excluding lease liabilities) as of 31 December 2020
(180)
Cash flow
465
Change in working capital (including taxes paid)
(191)
Group investments
(205)
Net acquisitions of financial assets
(81)
Other net investment flows mainly related to Rubis Terminal
20
Change in loans, advances and other flows (including lease liabilities)
(25)
Dividends paid out to shareholders and minority interests
(97)
Share buyback (capital decrease)
(153)
Capital increase
7
Impact of change in scope of consolidation and exchange rates
2
Financial position (excluding lease liabilities) as of 31 December 2021
(438)
-
2.2Events after the reporting period
Investment in Renewstable® Barbados
In February 2022, as part of the strategic agreement set up between Rubis and HDF Energy, the Group acquired 51% of the shares of Renewstable® Barbados set up by HDF Energy in Barbados. It is the largest electricity production and hydrogen storage project in the Caribbean to date. This hybrid power plant will provide electricity from solar energy and hydrogen.
-
2.3Other significant event since the authorisation for publication of the financial statements by the Supervisory Board
PHOTOSOL FRANCE
On 17 December 2021, Rubis announced the acquisition of Photosol France, one of the independent leaders in photovoltaic energy in France.
Following the completion of the acquisition on 14 April 2022, Rubis holds 80% of Photosol, while the remaining 20% is kept by Photosol's founders and management. This transaction creates the foundation for the development of the Group’s activities in the renewable energy segment, alongside the historical energy distribution activities via Rubis Énergie (Retail & Marketing and Support & Services) and bulk liquid storage via the Rubis Terminal JV.
This new business unit should benefit from Photosol’s strong presence in France and Rubis’ international positioning.
Photosol is one of the leading independent developers and producers of renewable electricity in France with a capacity of 330 MW in operation, 145 MW under construction, an over 3 GW pipeline in projects as at the end of March 2022, and has more than 80 employees.
By retaining a 20% stake, Photosol's founders and senior managers remain committed to the company's development and pursue the objective of increasing installed capacity to 1 GW by 2025 and 2.5 GW by 2030, ensuring compound annual growth of EBITDA (1) of 40% over the 2022-2025 period.
- •Cash payment of €385 million for an 80% stake, full consolidation of Photosol’s net debt of €362 million, with a total impact on Rubis’ consolidated net financial debt of €747 million euros proforma 2021.
- •The acquisition is fully financed by debt, resulting in a net debt/proforma EBITDA ratio of less than 2.5x.
- •In the short term, the acquisition will not have a significant impact on earnings per share (EPS), but Photosol’s EBITDA and contribution to profit will accelerate in the medium and long term.
(1)Estimated annual EBITDA of Photosol of €25 million in 2022 (excluding IFRS 2 and IFRS 16), consolidated by Rubis from 1 April 2022 (over nine months in 2022). -
Risk factors, internal control and insurance
- •the Retail & Marketing business (distribution of petroleum products); and
- •the Support & Services business (trading-supply, shipping and refining).
Rubis SCA also owns 55% of the securities of the Rubis Terminal joint venture, which it controls jointly with its partner and which it accounts for using the equity method (see chapter 1, section 1.5).
The diversity in the Group’s activities and the nature of the products it handles exposes it to risks that are regularly identified, updated and monitored as part of a rigorous management process aimed at mitigating these risks to the fullest extent possible, in accordance with applicable regulations, international standards and professional best practices.
Rubis has identified 15 risk factors related to its activities that it considers to be significant and specific (including risks related to Covid-19, which are the subject of special monitoring). These risks are divided into four categories (section 3.1).
-
3.1Risk factors
3.1.1Introduction
Using mapping techniques, Rubis annually reviews financial, legal, commercial, technological and maritime risks liable to have a material adverse effect on its business and financial position, including its results, reputation and outlook. In addition to this risk mapping, a comprehensive review of risks by all the relevant departments is organised in order to select the risks that should be included in this chapter. The selected risks are then presented to the Accounts and Risk Monitoring Committee, a specialised Committee of Rubis SCA’s Supervisory Board.
Only those risks deemed specific to the Group and important for investors to know of as of the date of this document are described in this chapter. Investors should take all the information contained in this document into consideration.
- •industrial and environmental risks;
- •risks related to the external environment;
- •legal and regulatory risks;
- •financial risks.
These categories are not presented in order of importance. Within each category, the risk factor with the greatest impact as of the date of the risk assessment is presented first. Note that the NFIS (Non-Financial Information Statement) contains a description of non-financial risks. Depending on their importance, some of those risks are also included in the risk factors described in this chapter. To avoid unnecessary repetition for the reader and to present each risk factor concisely, this chapter contains references to chapter 4 “CSR”, which includes a detailed presentation of the Group’s management of its environmental, social and societal risks.
The description of Rubis’ main risk factors (see below) presents the possible consequences in the event the risk does materialise and provides examples of measures implemented to reduce such consequences. The assessment of the impact and probability level of each risk mentioned takes the control measures implemented (net risk) into account.
Category
Risk
Probability
Impact
Industrial and environmental risks
Risk of a major accident in industrial facilities
▲
●●●
Risk of a major accident in distribution facilities
▲
●●
Risks related to product transportation
- •Maritime transportation
▲
●●●
- •Road transportation
▲▲
●●
Risks related to information systems
▲▲
●
Risks related to the external environment
Country and geopolitical environment risks
▲▲
●●
Risks related to a health crisis
▲▲▲
●
Climate risks
▲▲
●
Risks related to changes in the competitive environment
▲▲
●
Legal and regulatory risks
Ethics and non-compliance risks
▲
●●
Legal risks
▲▲
●
Risks related to a significant change in regulations
▲
●
Financial risks
Foreign exchange risk
▲▲
●●
Risk of fluctuations in product prices
▲▲
●
Risks related to acquisitions
▲
●
Risks related to management of the stake-holding in the Rubis Terminal JV
▲
●
-
3.2Internal control
3.2.1Internal control framework
Framework
For the following description of internal control procedures, Rubis referred to the French Financial Markets Authority (Autorité des Marchés Financiers - AMF) guide dated 22 July 2010, which sets out a reference framework for risk management and internal control.
However, Rubis adapted the AMF framework’s general principles to fit its business and own characteristics.
Objectives
- •its activities comply with laws and regulations;
- •the instructions and strategic goals defined by the corporate bodies of Rubis SCA and its subsidiaries are applied;
- •the Company’s internal processes run smoothly, particularly processes that contribute to safeguarding its assets;
- •financial information is reliable;
- •a process exists for identifying the principal risks tied to the Company’s business;
- •there are tools to prevent fraud and corruption.
Like any internal control system, the system put in place by Rubis cannot provide an absolute guarantee that the Company will be able to achieve its objectives and eliminate all risks.
Scope
The procedures described below apply to Rubis Énergie, which is wholly owned by Rubis SCA, and to Rubis Énergie’s sub-subsidiaries.
The Rubis Terminal JV is managed jointly with the partner. The joint venture’s General Management is responsible for setting up and ensuring internal controls (in accounting, financial and risk matters) in accordance with applicable standards and regulations and its shareholders’ expectations. Details about this joint venture are provided in section 3.2.4 of this chapter.
System components
Although it has acquired an international scale, Rubis wishes to remain a decentralised organisation that is close to the field so that it can provide its customers with solutions that are adapted to their needs by having the ability to take the necessary operational decisions quickly. Regular exchanges, conducted whenever necessary, between the Management Board, on the one hand, and the General Management and functional departments of Rubis Énergie and its foreign subsidiaries on the other hand, are the cornerstone of this organisation.
This managerial model gives the Manager of each industrial site or subsidiary a large degree of autonomy for managing his/her activity. However, such a delegation of responsibility is closely tied to complying with established procedures regarding accounting and financial information and risk monitoring, as well as regular controls by Rubis SCA’s relevant departments and by Rubis Énergie’s functional departments (see sections 3.2.2.3 and 3.2.3.2).
Lastly, the Management Board informs Rubis SCA’s Supervisory Board (through its Accounts and Risk Monitoring Committee) of the essential characteristics of the Group’s internal control and risk management procedures. The Supervisory Board ensures that the main identified risks have been taken into account in the Company’s management and that systems designed to ensure the reliability of accounting and financial information are in fact in place (see chapter 5, section 5.3.2).
-
3.3Insurance
The Group has taken out several insurance policies in order to offset the financial consequences of materialised risks. The main policies cover both property damage and operating losses as well as civil liability.
Insurance programmes are taken out with leading international insurers and reinsurers. The Group believes that these programmes are suited to the potential risks tied to its activities. However, the Group cannot guarantee that in the event of a claim, and an environmental claim in particular, all financial consequences will be covered by insurance. The Group also cannot guarantee that it will not suffer any losses that are uninsured.
3.3.1Rubis Énergie (Retail & Marketing and Support & Services)
International programmes taken out by Rubis Énergie on behalf of itself and its subsidiaries have been renewed with leading insurers.
3.3.1.1Property damage and parametric insurance
The “All Risks except” policy was renegotiated for one year with modified guarantees and a significant increase in premiums.
The Damages guarantee in the event of fire and similar events provides compensation in the amounts of €200 million per claim for terminals and €15 million per claim for service stations. This contractual limit was calculated on the basis of the maximum amount of possible loss.
Our exposure to natural events, particularly in the Caribbean, is covered in the amount of €15 million per claim and per event.
As the deductibles for natural events have increased, a parametric hurricane insurance policy has been set up covering sites in the Caribbean, with compensation capped at €5 million.
In compliance with local laws, for subsidiaries located outside the European Union, Rubis Énergie’s international programme is taken out from our lead insurer’s local network. Rubis Énergie’s policy provides coverage where there are differences in terms and limits.
3.3.1.2Civil liability
Rubis Énergie’s programme covers operating liability and post-delivery liability. Coverage amounts to €150 million per claim, all damages included, and the programme has been renewed with the same insurers.
In compliance with local laws, for subsidiaries outside the European Union, Rubis Énergie’s first-line international programme with minimal coverage is taken out from our insurer’s local network. The Group policy provides coverage where there are differences in terms and limits.
The Group environmental liability policy was taken out in 2020 for a term of two years for Rubis Énergie and its subsidiaries. Compensation is capped at €40 million per claim and covers environmental liability, damage to biodiversity and clean-up costs.
Due to its refining activities, SARA continued the contract taken out in 2020 for specific first-line cover for two years in the amount of €20 million per insurance period. The Master programme is a second line insurance.
The aviation liability coverage taken out by Rubis Énergie for its subsidiaries that distribute aviation fuel has been renewed under the same terms in the amount of US$1 billion for risks related to damage caused to third parties during refueling.
3.3.1.3Shipping
Charterer’s civil liability insurance has been taken out for Rubis Énergie’s activities/subsidiaries with a P&I Club, a member of the International Group, with guarantees of US$500 million and US$1 billion in the event of pollution. The six ship-owning companies are covered for their civil liability by the same P&I Club belonging to the International Group.
A Group Cargo insurance policy was renewed to cover damage to goods. It is capped at US$60 million for all Rubis Énergie subsidiaries.
3.3.1.4Other risks
-
CSR and non-financial performance /NFIS/
Although it has acquired an international dimension, Rubis has remained a company that is on a human scale which, through a decentralised organisation, encourages professionalism, experience and autonomy of its employees, who assume all the responsibilities tied to their positions, including the management of non-financial risk.Rubis believes that involving Management in CSR issues at all levels of the organisation is key to ensuring the sustainability of its activities (section 4.1.1). To better focus its efforts, the Group has carried out a risk analysis that identified 15 risks as being the most material in terms of its activities (section 4.1.2).
-
4.1Non-Financial Information Statement /NFIS/
This section includes Rubis’ CSR strategy, in line with the Non-Financial Information Statement (NFIS) requirements provided for by European Directive 2014/95/EU transposed by French Government Order 2017-1180 and implementing decree 2017-1265. This NFIS presents:
- •the main risks related to the Group’s activities(1);
- •the policies implemented to address those risks;
- •monitoring indicators and their results.
4.1.1A model for sustainable growth
4.1.1.1Activities structured around two divisions and a joint venture
An independent player in the logistics and distribution of petroleum products operating in some 40 countries in Europe, the Caribbean and Africa, Rubis is structured around two divisions operated by Rubis Énergie:
- •Retail & Marketing of petroleum products (fuels, heating fuels, liquefied gases and bitumen);
- •Support & Services backing the distribution activity: trading-supply, shipping and refining.
In addition, Rubis Terminal JV carries out a bulk liquid Storage activity (petroleum and chemical products, biofuels, fertilisers, agri-food products) on behalf of diverse industrial customers.
Rubis’ development strategy is based on specialised market positioning, a robust financial structure and a dynamic acquisition policy. In addition to these commercial and financial elements, the development strategy also incorporates non-financial objectives that allow the Group to pursue sustainable growth. The regularity of the teams’ performance stems from a corporate culture that values entrepreneurial spirit, flexibility, accountability and the embracing of socially responsible conduct. Rubis conducts its activities by implementing a CSR approach that contributes to the United Nations’ Sustainable Development Goals (SDG).
4.1.1.2Empowerment and freedom of initiative: people at the heart of the organisation
In keeping with its motto: “The will to undertake, the corporate commitment”, Rubis puts human relationships at the heart of its organisation. Individually empowering men and women who contribute to its activities means promoting freedom of initiative and the ethical, social and environmental values that Rubis wishes to see respected by all.
The Group aims to act with professionalism and integrity across its entire scope. This requirement safeguards against any wrongdoing that could be prejudicial to the Group, employees, business relations or to any other external stakeholder, and is reflected in the following principles, detailed in the Rubis Group Code of Ethics (see section 4.5.1):
- •compliance with applicable legislation and regulations;
- •promotion of safety and respect for the environment;
- •respect for individuals;
- •rejection of all forms of corruption;
- •prevention of conflicts of interest and insider trading;
- •compliance with competition rules.
4.1.1.3Committed management that is aware of ethics, social and environmental risks
The CSR policy is driven by Rubis SCA’s Managing Director in charge of New Energies, CSR policy and Communication in conjunction with the Managing Partners. She is supported by the CSR & Compliance Department, which is responsible for proposing the CSR policy’s guidelines and leading the CSR approach in coordination with the various departments involved (Climate, HSE, Human Resources, Finance, Legal, and Social Engagement).
Since 2015, part of the Managing Partners' annual variable compensation has been linked to ethics, social and environmental criteria (see chapter 5, section 5.4.2). These criteria are also included in the framework letters that set out the annual objectives of Rubis Énergie’s Senior Managers.
A presentation of the initiatives taken and results obtained is made to the Supervisory Board’s Accounts and Risk Monitoring Committee each year.
The Rubis Terminal JV continues to implement the CSR policy it has defined to date, in line with Rubis’ general principles. In accordance with regulations, as a subsidiary that is 55% owned by Rubis SCA, the Rubis Terminal JV continues to report its annual CSR data to the Group so that they can be included in this Non-Financial Information Statement. However, as this entity is jointly controlled by Rubis SCA and its partner, the CSR policy is now steered and monitored by the joint venture’s Board of Directors, on which Rubis SCA is represented. The joint venture’s CSR objectives are adopted by its Board of Directors. As a shareholder, Rubis SCA ensures that the Rubis Terminal JV complies with CSR standards that are at least equivalent to its own.
Lastly, the Rubis SCA Accounts and Risk Monitoring Committee monitors the analysis of the Group’s main ethical, social and environmental risks and the corrective measures taken to prevent such risks (see chapter 5, section 5.3.2).
4.1.1.4A continuous improvement approach
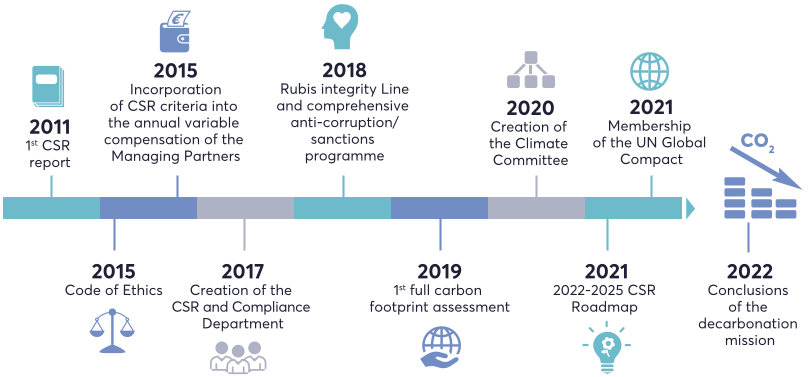
Since 2011, the year in which Rubis issued its first CSR report, the Group has been committed to a continuous improvement process in its approach to CSR.
Significant events in 2021
The Group would like to accelerate its CSR trajectory and has taken numerous steps over the past few years to structure and consolidate the foundations of its CSR approach. In 2021, Rubis laid the groundwork for developing its objectives and fully incorporating CSR concerns into its activities, including in particular:
- •publishing its first CSR Roadmap, Think Tomorrow 2022-2025, which includes climate, social, environmental, compliance and societal issues structured around three pillars and 19 indicators (see inset below);
- •defining a clear climate strategy that is based on three pillars (see section 4.3);
- •membership of the United Nations’ Global Compact, reaffirming the Group's attachment to the 10 universally recognised principles regarding protecting human rights and the environment, complying with international labour standards and fighting against corruption;
- •membership of the Sea Cargo Charter, an initiative promoting responsible maritime transport, which is an essential step in the Group’s climate strategy to reduce the carbon footprint of chartered vessels;
- •strengthening our teams in order to guide the implementation of the CSR approach throughout the Group, with the appointment of a CSR point of contact in each business unit.
The CSR ROADMAP, Think Tomorrow 2022-2025
By publishing this roadmap, Rubis is bolstering and steering its CSR strategy in line with the United Nations’ Sustainable Development Goals (SDGs). This roadmap was built around three pillars broken down into nine commitments:
- •pillar 1: reducing its environmental footprint;
- •pillar 2: offering a safe and stimulating working environment;
- •pillar 3: contributing to a more virtuous society.
- •reducing CO2 emissions resulting from operations: -30% by 2030 (2019 baseline) in scopes 1 and 2 (Rubis Énergie scope, representing 100% of the Group’s consolidated revenues), an objective that was revised upwards compared to the objective communicated previously (-20 % announced in June 2021, same scope) and which will be supplemented by additional objectives such as setting a target for the reduction of scope 3A CO2 emissions in 2022;
- •reducing the number of accidental spills in excess of 200 liters of products with an impact on the environment (number of spills in 2025 < than that of 2020, i.e. 20);
- •reducing occupational accidents with sick leave involving employees and service providers working at our facilities in 2025; frequency rate < 4.5 for employees and a lower number of accidents with sick leave involving service providers;
- •increasing the number of women in senior management: 30% women on average in Management Committees by 2025;
- •training employees about business integrity: 100% of employees trained in ethics and anticorruption by 2023.
Comprehensive information about this roadmap (which has been rolled out in the subsidiaries, which adapt the roadmap according to their local concerns) is available on our website at: https://www.rubis.fr/uploads/attachments/Rubis_CSR%20roadmap_2022_2025-EN.pdf
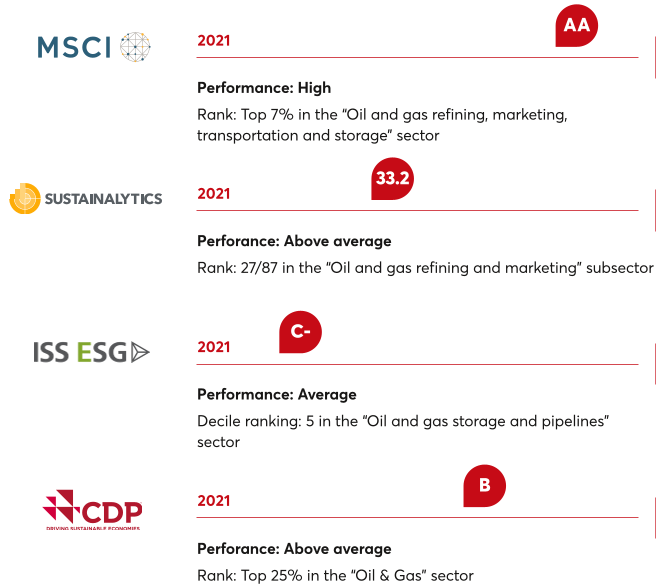
Monitoring our CSR performance
Rubis SCA wishes to continue its transparency efforts and to interact more proactively with non-financial rating agencies. In 2021, Rubis’ efforts were recognised by, in particular:
-
4.2Limiting our environmental impact and operating in a safe environment
Protecting people and the environment is everyone’s business and a priority for Rubis. As a committed and responsible company, the Group continuously works to protect its environment (section 4.2.2) and seeks to operate safely (section 4.2.3). To manage this approach to quality, health, safety and the environment, the Group has defined a general framework and a governance system has been implemented for each activity (section 4.2.1).
4.2.1Our QHSE approach /NFIS/
4.2.1.1General principles
A general framework for quality, health, safety and the environment (QHSE) has been defined in order to prevent risks and to limit the negative impacts of our activities.
The QHSE policy framework, which is referred to in the Group’s Code of Ethics, states that each employee must act responsibly when performing his/her duties, comply with the health, safety and environmental protection procedures on site, and pay particular attention to compliance with these rules by all parties (colleagues, suppliers, external service providers, etc.). This framework constitutes the common foundation for all the Group’s activities.
In order to account for the challenges and risks that are specific to Rubis Énergie’s activities and those of the Rubis Terminal JV, each of them have drawn up their own QHSE policy consistent with the Group’s general principles. These policies clarify the Group’s principles by transposing them into operational requirements. Dedicated governance has been set up for the implementation of these policies.
The main objective of these QHSE policies is to prevent risks in order to better protect physical and environmental integrity and to minimise the impacts of a major accident (see section 4.2.3). This is reflected in the implementation of the measures required to limit incidents as far as possible and thereby reduce the probability of a severe event occurring. In addition, the Group also strives to reduce its environmental footprint (see section 4.2.2).
4.2.1.2Management system
OVERSEEING of risk management
The implementation of QHSE policies is overseen by facility Managers who are assisted by Rubis Énergie’s and the Rubis Terminal JV’s industrial, technical and HSE Departments. At larger sites, quality and/or HSE engineers are also involved in this process. The Directors of Rubis Énergie’s subsidiaries and their functional departments report on their HSE work at Management Committee meetings that are held within each division twice a year, in the presence of Rubis SCA’s Management Board. The Rubis Terminal JV’s Management reports on the implementation of its HSE policy and its results to its Board of Directors, on which Rubis SCA has representatives.
Rubis Énergie (Retail & Marketing and Support & Services activities)
Rubis Énergie believes that it is essential to protect the health and safety of people and property located in or near its facilities. As such, Rubis Énergie has established a Health, Safety and Environment (HSE) Charter, which requires its affiliated companies to comply with HSE objectives that it considers to be fundamental (and which sometimes go beyond locally applicable regulations) in view of protecting the safety of people and property and to heighten employee awareness about these issues.
- •disseminating Rubis Énergie’s fundamental HSE principles within the subsidiaries in order to create and strengthen HSE culture;
- •implementing sector-specific best business practices;
- •having document systems established in accordance with “quality” standards ensuring reliability and safety of operations;
- •regularly assessing technological risks;
- •enhancing preventive facility maintenance;
- •regularly inspecting facilities and processes (transportation activities included) and addressing any identified deficiencies;
- •analysing all incidents and proposing to all subsidiaries lessons learned documents on notable events in order to avoid their recurrence;
- •regularly training employees and raising awareness about technological risks.
- •taking care to analyse the state of facilities in light of specific Group standards and local regulations and, as necessary, scheduling work to bring them up to standard;
- •joining the GESIP (Groupe d’Étude de Sécurité des Industries Pétrolières et Chimiques – Group for Safety Research in the Petroleum and Chemical Industries) in order to share lessons learned and implement industry best practices;
- •joining the professional aviation groups/associations JIG and IATA and signature of a Shell Aviation technical support agreement, with the goal of accessing expertise in the reception, storage and transfer of aircraft fuel and in aircraft fueling operations at airports for the relevant Rubis Énergie entities;
- •joining Oil Spill Response Ltd, a company that provides assistance in the event of maritime pollution that may occur during loading/unloading operations at Rubis Énergie’s terminals.
Rubis Terminal JV (Storage activity)
The Rubis Terminal JV’s Management has circulated a document to all its subsidiaries setting out “the principles of Rubis Terminal’s safety culture.”
- •safety is a core value that must be shared by all employees as a personal value;
- •Managers are responsible for staff safety and must be held accountable.
The Rubis Terminal JV considers that protecting health and safety contributes to the Company’s success and should therefore never be neglected, and that action must be taken upstream to avoid workplace injuries and occupational illness. The Management of each Rubis Terminal JV industrial site has the obligation to ensure that regular audits assessing compliance with safety principles and standards take place. Performance indicators have been put in place in order to trigger and monitor a continuous improvement process with respect to health and safety.
The Rubis Terminal JV’s General Management and that of each facility make an annual commitment to employees, customers, suppliers, governments and local residents, pledging to apply a QHSE policy that incorporates safety improvement targets specific to each site. Managers also agree to adhere to recognised international QHSE standards, which are set out below.
Finally, the Rubis Terminal JV has committed to a multi-year quantified programme for reducing its energy consumption and its CO2 and atmospheric emissions by circulating internally a document entitled “Group objectives for environmental impacts and energy consumption” to limit its environmental footprint. The document sets out objectives for reducing greenhouse gas emissions, energy and water consumption, and waste management, the results of which are presented in the corresponding sections of this chapter (section 4.3.4.3 regarding the activity’s carbon intensity, section 4.2.2.3.1 regarding water consumption and section 4.2.2.3.2 regarding waste management).
- •monitoring of programmes such as HACCP or GMP+ (see table below), under which the Rubis Terminal JV has committed to complying with the sector’s regulatory provisions and professional recommendations for its various activities, comparing its practices with best industrial practices and to constantly seek to improve its performance in the areas of safety, health and environmental protection;
- •regarding the Rubis Terminal JV’s chemical product storage depots, joining the Chemical Distribution Institute – Terminals (CDI-T), a non-profit foundation working to improve safety at industrial sites in the chemicals industry.
Site certification

Some of Rubis Énergie’s distribution or industrial activities (Vitogaz France, Sigalnor, SARA, Lasfargaz, Rubis Energia Portugal, Vitogaz Switzerland, Rubis Energy Kenya, Vitogas Espana and Easigas) are ISO 9001-certified (quality management system), as are all of the Rubis Terminal JV’s terminals.

The activities of SARA (refinery), Vitogaz Switzerland and Rubis Energia Portugal (Retail & Marketing) are ISO 14001-certified (environmental management system), as are certain of the Rubis Terminal JV’s French and international terminals. This standard provides a framework for controlling environmental impacts and seeks to ensure the continuous improvement of its environmental performance.

The activities of Vitogaz Switzerland are certified ISO 45001, and the activities of Rubis Energia Portugal are OHSAS 18001 certified (occupational health and safety management).

Regarding Rubis Terminal JV’s chemical product depots (Salaise-sur- Sanne, Grand-Quevilly, Val-de-la-Haye, Strasbourg, Dunkirk, Beveren, Rotterdam), the Chemical Distribution Institute - Terminals (CDI-T) is responsible for global chemical product supply chain inspections and audits specific to the transportation and storage activity.


The Rubis Terminal JV’s Dunkirk site has a continuous risk management approach regarding the storage of foodstuffs. Employees are trained in best practices through the analysis of food risks. They apply the principles of this approach, known as HACCP, and know how to meet the particular needs of the food sector, such as product traceability throughout the logistics chain. Moreover, the terminal has declared that it stores products used for animal feed. This has been registered with the DDPP (Direction Départementale de la Protection des Populations – Regional Directorate for the Protection of Populations). Finally, this site is preparing to obtain GMP+ B3 certification for the transshipment and storage of liquids used for animal feed.

Vitogaz France has held NF Service Relation Client (NF345) certification since 2015. It was the first French company to obtain certification under the new version 8, in December 2018.
Revised in 2018, NF Service Relation Client certification is based on international standards ISO 18295-1 & 2. A true guide of the best practices in customer relationship management, it takes customer expectations into account and aims to guarantee constantly improving service quality. For Vitogaz France, this approach to seeking excellence in customer experience aims at establishing a long-lasting commercial relationship, delivering quality service over time, ensuring that transmitted information is exhaustive and clear, and acting promptly in accordance with its commitments.
-
4.3Fighting against climate change /NFIS/
The Group recognises the importance and urgency of the fight against climate change and is well aware of the challenges facing its sector in terms of energy transition. The oil and gas sector plays a key role in energy access, and energy is essential to meeting people’s basic needs (transportation, heating, keeping cool, lighting, cooking) and supporting their development. Nevertheless, even today, a large proportion of the population in many of the regions in which Rubis operates (Africa in particular) is deprived of access to energy.
The changing expectations of society and the need to reduce greenhouse gas emissions worldwide are thus leading the Group to strike the right balance by taking into account:
- •on the one hand, the need to contribute to the fight against climate change by reducing the CO2 emissions tied to its activities; and
- •on the other hand, the expectations of those who want access to affordable and reliable energy so they can meet their essential needs and the social-economic impacts of energy transition. Rubis therefore has a role to play in ensuring that this transition is as just as possible.
The CSR Roadmap, Think Tomorrow 2022-2025, published by the Group in September 2021 includes the Group’s climate objectives (see section 4.3.4).
This section is structured in accordance with the recommendations of the Task Force on Climate-Related Finance Disclosures (TCFD) (see correspondence table at the end of this section, 4.3.5).
4.3.1Governance
Management’s role
Rubis has set up a structured governance system involving all levels of management to ensure that these climate challenges are fully incorporated into the Group’s strategy.
The position of Managing Director in charge of New Energies, CSR and Communication was created at Rubis SCA. The Managing Director is a member of the Group’s Management Committee and is responsible for these issues.
The Managing Director also chairs the Climate Committee, which met four times in 2021. This Committee is made up of Rubis’ CSR Director & Chief Compliance Officer, Rubis Énergie’s General Management and its Finance, CSR, HSE and Risk-Resources Directors (Rubis Énergie is the main contributor to the Group’s carbon emissions), and a representative of the Rubis Terminal JV. Rubis Énergie’s Climate & New Energy team, which was created in 2020, provides input to the Climate Committee and coordinates the operational efforts made by all the Group’s subsidiaries. The Committee’s key role is to:
- •monitor the Climate action plan, which is based around the three pillars, “measure, reduce, contribute to carbon neutrality”;
- •monitor changes in the carbon footprint and the avenues to reduce it; and
- •propose solutions for the transition to low-carbon growth in the distribution of energy products.
The principal players in this transition are trained in carbon accounting techniques and climate challenges. For example, in October 2021, Managers and certain key functions at Rubis Énergie participated in climate training organised by IFP Énergies Nouvelles.
Monitoring by the Supervisory Board
Rubis SCA’s Supervisory Board is responsible for monitoring of the Group’s climate strategy and performance. In the framework of its work on this subject, the Supervisory Board relies on its specialised Committee, the Accounts and Risk Monitoring Committee. At meetings held in March and September 2021, the Committee examined the Group’s current climate challenges, including a review of the presentation of the climate risk factor included in the risk factors published by the Group, the presentation of CO2 emission reduction targets, and a progress report on the work carried out in respect of the European taxonomy on “adaptation to climate change” and “mitigating climate change” objectives. The Supervisory Board was also informed about Rubis’ strategy for developing in the area of renewable energies (acquisition of a stake in HDF Energy, acquisition of Photosol) and about the launch of an assessment of measures for decarbonising Rubis’ activities that was commenced in 2021.
The importance the Group attaches to climate issues is reflected in, among other things, the inclusion since financial year 2019 of an energy efficiency performance criterion that is considered when allocating annual variable compensation to the Managing Partners. This criterion is based on meeting targets that aim to improve the carbon intensity (operational efficiency) of the Retail & Marketing and Support & Services activities (Rubis Énergie). The satisfaction of this criterion is verified by the Group’s Compensation and Appointments Committee each year and is submitted to Annual Shareholders’ Meetings for approval.
-
4.4Attracting, developing and retaining talents
Mindful that employee commitment is key to the Group’s success, Rubis ensures that individuals have the opportunity for professional development, with the aim of attracting, developing and retaining its talents. To do so, Rubis focuses its efforts on promoting diversity and equal opportunities (section 4.4.1), employee skills development (section 4.4.2), health, safety and well-being at work (section 4.4.3) and involving employees in the Group's value creation (section 4.4.4).
Group risk mapping has identified the main human resources risks related to the Group’s activities. These risks mainly concern the health and safety of employees and external service providers working at Group sites. Apart from these risks, a key challenge relating to human resource management was identified by the relevant Management in each division: attracting, developing and retaining talent while the Group grows and where human resources must be adapted to Rubis’ development strategy. This challenge is dealt with in this chapter.
In line with its corporate culture and in order to make the most of its human capital and better address the specificities involved in the Group’s activities, the deployment of Rubis' human resources policy has been decentralised. Rubis Énergie, its subsidiaries and the Rubis Terminal JV manage their human resources autonomously in line with Rubis’s values and implement local actions adapted to their needs and challenges.
In addition, in order to support skills development and foster internal mobility, a project relating to establishing a process for identifying and supporting Talents was initiated within Rubis Énergie at the end of 2021. It should be implemented starting in 2023.
Employee status and fluctuations in numbers
As of 31 December 2021, the Group had 4,335 employees, including 626 at the Rubis Terminal JV, a 39.4% increase compared to 2020 subsequent to the integration of Tepsa. Within Rubis Énergie, headcount increased in the Africa zone in particular (+5.25%).
The Group’s shipping activity requires the use of crews who are hired through temp agencies or under a limited term employment agreement. At 31 December 2020, the number of crew members who had signed an employment contract with a Group entity (under international temporary contracts) stood at 84. These non-permanent workers are not taken into account in the published social metrics. However, Rubis is particularly careful to ensure that the working conditions of these crews comply with ILO conventions applicable them (see section 4.5.1.1).
-
4.5Working responsibly and with integrity
Operating its businesses responsibly and with integrity is a core issue for Rubis in terms of fulfilling its commitments and protecting its image, reputation and employees. The Group is built on values that have fashioned its culture and driven its success: integrity, respect for others, professionalism and trust are all principles that the Group aims to apply across all its activities to ensure its sustainability. These internal principles, which are rooted in its strong corporate culture, also encourage employees to become involved in the social and economic fabric surrounding them by adopting responsible and supportive behavior.
Because the Group is present in over 40 countries in Europe, the Caribbean and Africa, the prevention of corruption is a major issue for the Group (section 4.4.1.1). The Group also endeavors to extend its principles of responsibility to its value chain and to gradually introduce a responsible purchasing policy with the aim of having common standards for leading by example (section 4.4.1.2). Lastly, the Group’s subsidiaries attach great importance to dialoguing with stakeholders and encouraging momentum in the regions where they operate, both in terms of the economy and employment and in terms of culture and community living (section 4.4.2).
4.5.1Rubis’ ethics policy
The Group considers ethics to be an asset that is key to its reputation and loyalty. Integrity is one of the central pillars of the Group’s approach to ethics (section 4.4.1.1), as is the Group’s commitment to respecting its employees’ fundamental rights (section 4.4.1.2).
4.5.1.1Fair practices
“Personal integrity is key to ensuring exemplary collective behavior. It is a safeguard against wrongdoing that could harm the Company, employees, business relationships or any other external public or private actor.”
Rubis’ Code of Ethics
Collective and individual commitment is indispensable to adopting ethical behaviors that meet the Group’s values. To ensure that the rules of conduct are shared and complied with by all, Rubis has included within in its Code of Ethics a common framework for all its subsidiaries, including the Rubis Terminal JV.
This Code of Ethics (which is accessible to the public through the Group’s website: www.rubis.fr/en) lays down the values that Rubis considers to be fundamental:
- •compliance with applicable laws and regulations wherever the Group operates;
- •fighting against corruption, fraud, misappropriation of funds and money laundering;
- •preventing conflicts of interest;
- •complying with competition, confidentiality and insider trading rules, as well as with specific laws that apply to war and/or embargo zones;
- •respecting individuals, including by observing fundamental rights and human dignity, safeguarding privacy, and fighting against discrimination and harassment;
- •complying with workplace health and safety rules and environmental protection rules;
- •managing relationships with external service providers;
- •reliability, transparency and auditability of accounting and financial information;
- •protecting the Group’s image and reputation.
In each of these areas, the Rubis Code of Ethics details the general principles that employees must observe while performing their duties. The Code of Ethics is furnished to new arrivals. Subsidiaries organise training sessions to explain the Code’s contents and to answer employees’ questions. Rubis SCA’s CSR & Compliance Department is the point of contact for subsidiaries and employees on ethics issues.
Fighting corruption /NFIS/
Programme measures
In line with its values and applicable legislation, and in particular the law on transparency, fighting corruption and modernising the economy of 9 December 2016 (known as the “Sapin II law”), Rubis is putting into practice its commitment to fight against corruption in all its forms as described in its Code of Ethics, by gradually introducing a comprehensive anticorruption programme. To date, this programme is made up of the following measures:
- •a guide to applying the anticorruption policy that supplements the Code of Ethics. This guide (which is accessible to the public on the Group’s website: www.rubis.fr) aims to help the most exposed senior executives and employees identify at-risk situations and adopt the related practical preventive measures. The guide was updated in 2021 to make it more educational and to take into account the results of corruption risk mapping;
- •third-party assessment guidelines, to help operating staff identify third parties that may present risks, perform appropriate due diligence and implement suitable measures. These guidelines are being updated;
- •corruption risk mapping: this analysis was conducted at the operating entity level by subsidiary Managers based on a methodological guide and meetings involving the subsidiaries’ core functions (purchasing, sales, operations, HR, finance, compliance, etc.). A one-day seminar bringing together all the subsidiaries’ Compliance Advisors was organised in November 2019 to familiarise them with the mapping methodology. Risk hierarchisation resulted in an additional review in 2020. This mapping process resulted in the identification of action plans. Since 2021, the risk mapping of the operational entities is reviewed each year and is fully updated every three years at a minimum;
- •regular awareness and training campaigns in respect of ethics and anticorruption rules in all Group subsidiaries aimed at employees in the most sensitive positions and, in some subsidiaries, for all employees. Remote training sessions were maintained in 2021, despite the health situation linked to the pandemic. An online training module (e-learning) on preventing and detecting corruption will be made available to the Group’s operational entities in the first quarter of 2022. More targeted training initiatives were held periodically for Compliance Advisors (Group Compliance Seminar) and for Group General Managers and Directors of Rubis Énergie subsidiaries. Lastly, a communication tool was rolled out across the Group for the third consecutive year on International Anticorruption Day, which is celebrated on 9 December each year, to reiterate the Group’s commitments to fighting corruption;
- •a global whistleblowing system, the Rubis Integrity Line, was established in 2018 and has been rolled out in all Group entities. It allows all Group employees and external and occasional employees to securely and confidentially make a report using an outsourced internet platform. These reports can relate to acts of corruption or other ethical issues (environment, security, fraud, personal data, human rights, etc.) and, more generally, to any situation or conduct that may be contrary to the Code of Ethics. The system’s overall architecture was designed to provide a means of filing these reports and processing them internally, while ensuring complete confidentiality. The rules that govern the use of the Integrity Line set out whistleblowers’ rights and responsibilities so that the system can operate smoothly in a climate of trust. In particular, in the rules, the Group reminds users that whistleblowers will be protected against any retaliation. To support the rollout of the Integrity Line, an educational kit was distributed to the Compliance Advisors, and communication initiatives are carried out regularly (“Think Compliance” newsletter, subsidiary newsletters, training, etc.). In 2021, the Group received 11 reports via the system, seven of which related to HR issues, three of which related to potential conflicts of interest and one of which related to alleged non-compliance with commitment authority;
- •modification of entities’ internal regulations or employee handbooks (after informing/consulting staff representative bodies where appropriate) to include specific language stating that a failure to comply with the Code of Ethics or the anticorruption policy may lead to disciplinary sanctions. In 2021, 20 disciplinary actions (including 15 in two subsidiaries) were taken for fraud or non-compliance with anticorruption rules, some of which resulted in dismissals;
- •an internal accounting control framework (see chapter 3, section 3.2);
- •assessing that the programme’s measures are being implemented: the internal control risk management system (described in chapter 3, section 3.2.3) includes checks on the application of the Group’s main ethics and anticorruption rules. In addition, each subsidiary reports annually to the Group CSR Director & Chief Compliance Officer on the progress of the programme’s deployment. The digital non-financial data collection platform has been used since 2020 for this reporting in order to improve the reliability of the reported information.
Governance
The Group and its management bodies have made the prevention of corruption one of their priorities. Since 2016, the Managing Partners' variable compensation includes an ethics criterion that relates to the implementation of the programme across all entities.
The Group’s CSR Roadmap, Think Tomorrow 2022-2025 (which is publicly accessible on the Group’s website at www.rubis.fr) announced in 2021 includes compliance within its third pillar, “Contributing to a more virtuous society”. In particular, the Roadmap sets the target of having 100% of employees trained in ethics and anticorruption by 2023.
In 2021, 78% of the subsidiaries’ General Managers indicated they had participated in an internal anticorruption initiative or event.
A specific organisation was put in place to support the roll out and monitoring of the anticorruption programme:
- •the Group CSR Director & Chief Compliance Officer, who reports to the Managing Director in charge of New Energies, CSR policy and Communication and to Rubis’ Corporate Secretary, and whose main role is to define the Group’s policies and procedures in the area of ethics and compliance and to support, together with the entities, the deployment and implementation of these policies and procedures within the Group. The Group CSR Director & Chief Compliance Officer proposes enhancements to the programme by incorporating strategic issues, best practices and regulatory developments, and regularly reports on her work to the Managing Partners and to the Accounts and Risk Monitoring Committee;
- •Rubis Énergie’s and the Rubis Terminal JV’s Compliance Managers, who roll out the programme within their divisions and address operational issues, if necessary, in conjunction with the Group’s Head of CSR & Compliance;
- •the 35 Compliance Advisors, who are appointed within operating entities, ensure that the anticorruption policy is properly understood and applied.
Tools have been provided to coordinate this compliance network and to support Compliance Advisors in their work, including practical fact sheets on how to deal with gifts and invitations and manage conflicts of interest and Integrity Line training materials for employees. The “Think Compliance” newsletter was launched in late 2018 to support the promotion of a compliance culture within the Group. Two editions were distributed in 2021.
The Group is committed to a continuous improvement approach and supplements its anticorruption programme in view of changes in legislation and best practices.
Fighting fraud
The main internal fraud risk lies in the theft or misappropriation of products. Therefore, over several years the Group has established strict measures to verify production volumes (such as the automation of transfer stations to reduce human involvement as much as possible, inventory gap checks, and upgrades of control systems).
Finally, the increase in external fraud attempts (CEO impersonation and hacking for instance) has prompted the Group to strengthen its information campaign with the aim of raising the awareness of all employees who are likely to be approached (accounting, financial or legal functions) so that this type of fraud can be combatted more effectively.
In terms of IT security, the Group and its subsidiaries constantly work to achieve innovative cybersecurity solutions by using European tools and complying with ANSSI directives, as well as those of its various partners. These actions relate to data protection and protecting production information systems. The Group trains its employees on detecting fraudulent emails (phishing for example) and on suspicious activity at workstations. Strong and secure authentication solutions for production resources with constant flow analysis systems are also implemented.
Fighting tax evasion /NFIS/
The amount of taxes recorded by the Rubis Group (excluding the Rubis Terminal JV) in respect of financial year 2021 amounted to €188 million.
Group companies ensure that tax returns and payments are submitted in accordance with local regulations. They complete the tax returns required in the jurisdictions in which the Group operates its businesses. Rubis has opted for tax consolidation in France since 1 January 2001 (see note 3.10 to the separate financial statements). In accordance with its legal obligations, Rubis carried out its country-by-country reporting by reporting the breakdown of its profits, taxes and activities by tax jurisdiction and established the transfer pricing documentation applicable among Group companies (Transfer Pricing Documentation – Master File).
The Group does not have any subsidiaries that are not underpinned by economic activities (essentially, local commercial operations). In particular, the Group’s presence in the Caribbean and the Channel Islands through Rubis Énergie concerns the petroleum products distribution business; Rubis supplies these islands with the energy sources they need to operate and, for example, manages the largest automotive fuel distribution network in the Caribbean Islands and Bermuda and distributes 100,000 m3 of petroleum products per year in the Channel Islands.
Respect for human rights /NFIS/
Respecting human rights is above all about promoting a model of a responsible employer that protects the fundamental rights of all Group employees in all countries where the Group has a presence. In addition to its legal obligations, Rubis advocates for the respect of individuals as a management principle and prohibits harassment and discrimination. These values are enshrined in the Code of Ethics put in place in 2015, which is distributed to employees.
In practical terms, the Group ensures that in all countries where it operates its human resources policy complies with the principles relating to human rights at work as set out in the International Labour Organisation’s fundamental conventions in the areas of:
- •freedom of association and collective bargaining;
- •eliminating discrimination in hiring and professional discrimination;
- •eliminating forced or compulsory labour;
- •abolishing child labour.
In 2021, the Group joined the United Nation’s Global Compact in order to reaffirm its commitment to integrating and promoting the principles of protecting human rights, complying with international labour and environmental protection standards and combatting corruption.
In 2020, the Group’s CSR & Compliance Department, in conjunction with Rubis Énergie’s operational management, conducted an analysis of modern slavery risks in its value chain in order to ensure that adequate preventive measures are in place. This analysis will be supplemented in 2022 by a broader mapping of the human rights challenges in the Group’s activities.
Preventing the risk of forced labour in the shipping business is a major focus. A crew management manual drawn up by the Rubis subsidiary in charge of managing wholly owned vessels sets detailed standards to be complied with in terms of crew recruitment and working conditions (under a temporary international contract with a Group entity), in line with the principles of the ILO Maritime Labour Convention, which include the rejection of forced labour. Enhanced vigilance is exercised when dealing with crew recruitment agencies. Contracts with these agencies include specific clauses relating to the obligation to comply with international standards, and the ILO Maritime Labour Convention in particular. Annual audits are carried out on these recruitment agencies. For chartered vessels, the services of a leading vetting company are used. Compliance with the Maritime Labour Convention is included in the pre-approval criteria for each vessel.
As regards the working conditions of service station managers, who are not Group employees, an initial assessment has been carried out on two subsidiaries with service station networks in two countries that are particularly exposed, Madagascar and Haiti. No cases of forced or child labour were identified by the commercial inspectors, who regularly inspect service stations, sometimes unannounced. An ethics clause, in which the service station operator undertakes to comply with Rubis’ ethics rules, including compliance with applicable Labour laws, the prohibition of forced or child labour, and compliance with employee health and safety rules, is included in certain contracts and must be systematically included when renewing or signing new contracts.
The Group’s whistleblowing line, Rubis Integrity Line, which has been rolled out across all Group entities, is available not only to Rubis employees but also to external and occasional workers and enables them to report non-compliance with rules in a strictly confidential way (see the "Fighting corruption” section on the previous page). The deployment of the line to reach external employees, including the employees of service station managers, must be strengthened.
In addition, the Group ensures that systems for protecting the health and safety of all persons working within in subsidiaries are in place (see section 4.2.3.2.1).
4.5.1.2Requirements for subcontractors and suppliers /NFIS/
The main suppliers of Rubis’ subsidiaries are equipment suppliers and service providers, mainly in logistics (transport, operations).
Responsible purchasing policy
The Code of Ethics stipulates that employees have an oversight mission and are to ensure within that context that third parties properly apply the Group’s standards when working on Group sites. If the situation so requires, employees must conduct awareness or training actions and, if ethics rules are violated, advise their line managers.
The Code of Ethics also specifies that the Group’s subsidiaries must require that the external service providers with which they work (suppliers, subcontractors, industrial or commercial partners) comply with internal standards related to safety, environmental protection and respect for individuals in particular.
Any finding of a breach of the Group’s ethical standards must be communicated to the line Manager and/or the Management of the subsidiary or facility as quickly as possible.
Rubis’ CSR Roadmap, Think Tomorrow 2022-2025, (accessible on the Group’s website:: https://www.rubis.fr/uploads/attachments/Rubis_CSR%20roadmap_2022_ 2025-EN.pdf) published in 2021 notably provides for a target of adopting a sustainable purchasing charter which would make it mandatory to include CSR criteria when selecting suppliers and service providers for capex and the Company’s most significant projects.
Lastly, to avoid conflicts of interest, the Code of Ethics specifies that an employee must not (i) acquire a significant interest in a supplier, or in a company or group to which a relative or family of the supplier belongs and with which Rubis has conflicting interests, or (ii) accept any gifts or hospitality that does not comply with the Group’s rules on the subject. These rules are detailed in dedicated practical information sheets.
Measures for incurring expenses and control
The provision of services and supplies used on Rubis Terminal’s industrial sites is governed by the Group’s social and environmental policy (see section 4.2.1).
Rubis’ subsidiaries factor health, safety and environmental issues into the process of selecting solutions from their suppliers when such companies work at their facilities. The subsidiaries therefore favour practices that reduce energy consumption and waste generation, all while guaranteeing optimal security. This is the case in the choice of heating by heat pump that was made for newly built buildings for the Rubis Terminal JV.
The Rubis Terminal JV has set itself the target each year of having all orders fulfilled under terms containing a CSR criterion: all of the JV’s service providers that work with personnel on its industrial sites are selected using HSE criteria as a minimum. In addition, the Rubis Terminal JV responded to the Ecovadis questionnaire in 2021 and is awaiting the results. Rubis Énergie, which does not have a centralised purchasing department, is considering setting up a target as part of the definition of the Group’s CSR Roadmap.
Contracts also stipulate that suppliers must comply with applicable Labour laws, including the fight against illegal employment and respect of working hours.
-
4.6Methodology note /NFIS/
This section contains a description of methodology and a cross-reference table designed to facilitate understanding of CSR information. Accordingly, it was decided to present the scope and methods for reporting CSR information and the key definitions contained in the internal standards on reporting labour and environmental information. These clarifications will enable the reader to have a more precise understanding of each information item’s scope and relevance.
4.6.1CSR scope
The rules relating to an entity’s date of inclusion within and exit from the CSR scope are defined as follows:
- •any acquisition of an entity (external to the Group) is included in the CSR reporting scope starting the first full financial year occurring after the entity is included in the financial scope, at the earliest. This rule allows HR processes, safety standards and Group commitments to be better integrated within the acquired entity, along with the corresponding monitoring indicators;
- •unless otherwise indicated, the CSR data of an entity that was sold or liquidated during the financial year is excluded from CSR reporting for the entire fiscal year in which it was sold or liquidated.
4.6.1.1Environmental data
The reporting scope for environmental information corresponds to the Group’s financial scope unless expressly stated otherwise. Controlled companies are fully consolidated, with the exception of data relating to the greenhouse gases emissions (see below).
Environmental data for the Rubis Terminal JV, which is jointly controlled by Rubis SCA and its partner and accounted for using the equity method, are presented both at 100% and in accordance with the percentage of capital held by Rubis SCA (55%).
The exact scope of reporting of environmental data may vary according to the environmental indicators, depending on their relevance and the accounting methods applied. The environmental data is collected at the legal entity level.
Environmental data is published by activity. Figures are published for the activities that have the most significant environmental impacts (Support & Services activities at Rubis Énergie and the activities of the Rubis Terminal JV).
The greenhouse gases emissions from the Group’s activities and the greenhouse gases emissions related to the use by customers of products sold for final use have been evaluated and are published for all the entities in the financial scope of consolidation, with the exception of Rubis SCA/Rubis Patrimoine due to their immaterial impact (24 employees, no operating activity). In accordance with the principles of the GHG Protocol, this data is proportionally consolidated by applying the percentage of the stake held.
4.6.1.2Social data
Unless expressly stated otherwise, the reporting scope for social information corresponds to the Group’s financial scope of consolidation. Controlled companies are fully consolidated.
Social data regarding the Rubis Terminal JV, which is jointly controlled by Rubis SCA and its partner and accounted for using the equity method, are presented at the rate of 100%.
The information for Rubis SCA/Rubis Patrimoine, Rubis Énergie (Retail & Marketing and Support & Services activities) and the Rubis Terminal JV is presented separately and/or by region.
The exact scope of social data reporting may vary according to the social indicators, depending on their relevance and the accounting methods applied. Social data is collected at the legal entity level.
Moreover, the shipping activity requires the use of crews hired under temporary contracts. These non-permanent employees of the Group (84 individuals in 2021) are not taken into account when monitoring published social indicators.
4.6.1.3Societal/ethics data
-
4.7Report of the independent third party on the consolidated Non-Financial Information Statement included in the management report
This is a free translation into English of the Independent Third-Party’s report issued in French and is provided solely for the convenience of English-speaking readers. This report should be read in conjunction with, and construed in accordance with, French law and professional standards applicable in France.
In our capacity as an Independent Third Party, member of Mazars Group, statutory auditors of Rubis Group and accredited by COFRAC Inspection under number 3-1058 (scope of accreditation available on www.cofrac.fr), we carried out work aimed at formulating a reasoned opinion that expresses a limited level of assurance on the historical information (observed and extrapolated) of the consolidated extra-financial performance statement, prepared in accordance with the entity’s procedures (hereinafter the “Statement") for the financial year ended December 31, 2021 (hereinafter respectively the "Information" and the "Statement"), presented in the management report of the group in application of the provisions of Articles L. 225-102-1, R. 225-105 and R. 225-105-1 of the Commercial Code.
Conclusion
Based on the procedures we performed, as described in the "Nature and scope of our work” and the evidence we collected, nothing has come to our attention that causes us to believe that the consolidated non-financial statement is not presented in accordance with the applicable regulatory requirements and that the Information, taken as a whole, is not presented fairly in accordance with the Guidelines, in all material respects.
-
Report of the Supervisory Board on corporate governance
This report on corporate governance was prepared by the Supervisory Board in accordance with Article L. 22-10-78 of the French Commercial Code. The Supervisory Board approved this report at its meeting held on 10 March 2022. This report is attached to the management report.
When drafting this report, the Supervisory Board referred to information and documents obtained from the Accounts and Risk Monitoring Committee and the Compensation and Appointments Committee, discussions with Rubis’ Management Board and its Finance, Legal, Consolidation and accounting departments, and support from Rubis’ Secretary to the Board.
-
5.1Corporate Governance Code
The Company refers to the Afep-Medef Corporate Governance Code for listed companies as updated in January 2020 (hereinafter the “Afep-Medef Code”). This Code is available on the websites of the Company (www.rubis.fr), Afep (www.afep.com) and Medef (www.medef.com).
The Company has always strived to comply with the Afep-Medef Code’s recommendations within the limits of the particularities stemming from its legal form as a Partnership Limited by Shares and the resulting provisions of its by-laws.
The recommendations that were not fully implemented in 2021 and the explanations provided by the Company are set out in the table below.
Afep-Medef Code
recommendations set asideExplanation
It is recommended that at least one meeting
[of the Supervisory Board] be held each year without the presence of Executive corporate officers.(recommendation 11.3)
By law, the mission of a Supervisory Board resulting from the form in which the Company is incorporated (Partnership Limited by Shares – Société en Commandite par Actions) differs from that of a Board of Directors of a public limited company (société anonyme). Article L. 226-9 of the French Commercial Code provides that the Supervisory Board of a Partnership Limited by Shares is in charge of the continuous oversight of the Company’s management. Unlike the Board of Directors of a public limited company, the Supervisory Board may not intervene in the Company’s management and administration.
The Company therefore considered that, due to its form as a Partnership Limited by Shares, it was more appropriate that this recommendation be complied with at the level of the Accounts and Risk Monitoring Committee.
At least two-thirds of the members of the Audit Committee must be independent and the Committee must not have any Executive corporate officer as a member.
(recommendation 16.1)
The Accounts and Risk Monitoring Committee does not have any executive corporate officer as a member.
While the independence rate stood at 80% at the close of the 2021 Shareholders’ Meeting, the Supervisory Board meeting held on 10 March 2022, noted that, if the Accounts and Risk Monitoring Committee’s composition was not changed, the proportion of independent Directors would drop to 40%, as a result of two members losing the qualification of being independent. As a result, the Supervisory Board decided that two independent members would join the Accounts and Risk Monitoring Committee after the close of the 2022 Shareholders’ Meeting (subject to their appointment/reappointment by the 2022 Shareholders’ Meeting) in order to maintain an independence rate of 60%. The Supervisory Board also confirmed its objective of improving the independence rate as and when changes to the Committee’s membership are made.
[The Committee responsible for appointments] must not have any Executive corporate officer as a member and the majority of its members must be independent Directors.
[The Committee responsible for compensation] must not have any Executive corporate officer as a member and the majority of its members must be independent Directors.
(recommendations 17.1 and 18.1)
The Compensation and Appointments Committee does not have any executive corporate officer as a member.
While 50% of its members are independent, the Committee’s chair must be independent.
The Appointments Committee (…) draws up a succession plan for Executive corporate officers (…)
(recommendation 17.2.2)
The Compensation and Appointments Committee does not draw up a succession plan for the Management Board, since this responsibility falls to the General Partners in Partnerships Limited by Shares. However, the Management Board regularly informs the Supervisory Board and the Compensation and Appointments Committee of progress in the succession plan.
-
5.2Management of the Company
5.2.1General Management: the Managing Partners
Composition
The Company is managed by the Management Board, which is composed of four Managing Partners: Gilles Gobin and the companies Sorgema, Agena and GR Partenaires. All Managing Partners other than Agena are General Partners and as such have unlimited joint and several liability from their personal assets for Rubis’ debts. This feature, which results from the legal form of Partnership Limited by Shares under which the Company is constituted, provides shareholders with the guarantee of extreme care in the management and administration of the Company (particularly with regard to risk management).
Gilles Gobin is Statutory Managing Partner. Sorgema, Agena and GR Partenaires are non-Statutory Managing Partners. Jacques Riou is the legal representative of Agena.
As of 31 December 2021, the Managing Partners, in their direct and indirect capacity as General Partners, held 2,352,337 shares of the Company (representing approximately 2.29% of the share capital) due to General Partners’ commitment to reinvest 50% of their dividends into shares.
Profile and list of offices and functions of the Managing Partners (as of 31 December 2021)
Gilles GOBIN
Experience and expertise
Founder of the Group in 1990.
Gilles Gobin is an Essec graduate with a doctorate in Economics. He started his career at Crédit Commercial de France in 1977 and joined the Executive Committee in 1986 as head of Corporate Finance. He left the bank in 1989 and founded Rubis in 1990.Born 11 June 1950
Professional address
Rubis
46, rue Boissière
75116 Paris – FranceNumber of Rubis shares held as of 31/12/2021
177,782
Office in Rubis
Statutory Managing Partner and General Partner since the creation of Rubis.
Other key offices within the Group
- •Chairman of Sorgema;
- •Managing Partner of Magerco and Thornton.
Other offices and positions held outside the Group
None
Sorgema
Simplified limited company (SAS) with capital of €15,487.50
Shareholders
Gobin family group
Chairman
Gilles Gobin
Registered office
34, avenue des Champs-Élysées
75008 Paris – FranceNumber of Rubis shares held as of 31/12/2021
1,231,609
Office in Rubis
Managing Partner and General Partner since 30 June 1992.
Other key offices within the Group
None
Other offices and positions held outside the Group
None
Agena
Experience and expertise
Jacques Riou graduated from HEC business school and has a degree in Economics. Before joining Gilles Gobin to set up Rubis in 1990, he held several roles at BNP Paribas, Banque Vernes et Commerciale de Paris, and at the investment management company Euris.
Simplified limited company (SAS) with capital of €10,148
Shareholders
Riou family group
Chairman
Jacques Riou
Registered office
20, avenue du Château
92190 Meudon – FranceNumber of Rubis shares held as of 31/12/2021
942,946
Term of office at Rubis
Managing Partner since 30 November 1992.
Other key offices within the Group
None
Other offices and positions held outside the Group
None
GR Partenaires
Limited Partnership with capital of €4,500
Shareholders
- •General Partners: companies of the Gobin family group and Jacques Riou
- •Limited Partner: Agena and the Riou family group
Managing Partners
- •Magerco, represented by Gilles Gobin
- •Agane, represented by Jacques Riou
Registered office
46, rue Boissière
75116 Paris – FranceNumber of Rubis shares held as of 31/12/2021
0
Term of Office at Rubis
General Partner since 20 June 1997 and Managing Partner since 10 March 2005.
Other key offices within the Group
None
Other offices and positions held outside the Group
None
Powers of the Managing Partners
The Managing Partners have the broadest powers to run and manage the Company. In accordance with legal provisions, they manage the Company by taking into consideration the social and environmental issues connected to the Company’s business.
The Managing Partners represent and bind the Company in its relationships with third parties within the limits set by its corporate purpose and subject to the duties assigned by law to the Supervisory Board and Shareholders’ Meetings.
Thus, the Rubis SCA Managing Partners make the following decisions for the Company and its wholly owned subsidiary and division head Rubis Énergie:
- •strategy development;
- •manage development;
- •risk management;
- •closing of the separate and consolidated financial statements of the Group;
- •setting along with the subsidiaries’ General Management the key management decisions resulting from the strategy and monitoring their implementation by the parent company and subsidiaries.
In exercising their management authority, the Managing Partners are supported by Rubis Énergie’s General Managers and the heads of Rubis Énergie’s operating subsidiaries.
In addition, jointly with Cube Storage Europe HoldCo Ltd, the Managing Partners are responsible for the management of their joint subsidiary RT Invest (55% owned by Rubis SCA), with the support of RT Invest’s General Managers and the heads of RT Invest’s operating subsidiaries.
Management Board meetings and work in 2021
- •closing of the annual and half-year separate and consolidated financial statements;
- •authorisation to sign credit facility agreements with financial institutions;
- •calling of the Shareholders’ Meeting of 10 June 2021 and determination of the meeting agenda;
- •authorisation to acquire up to 80% of the shares making up the capital of Photosol France and Photosol Hermitage;
- •issuance (without preferential subscription rights) of 4,440,000 equity warrants to Crédit Agricole Corporate and Investment Bank;
- •authorisation to sign mandates with Exane BNP Paribas in the context of the share buyback programme;
- •formal acknowledgement of the capital reductions by way of the cancellation of shares acquired by the Company under the share buyback programme;
- •implementation of two performance share plans and a stock option plan;
- •implementation of a capital increase reserved for Group employees;
- •acknowledgement of capital increases resulting from employee subscriptions to the capital increase reserved for employees, the reinvestment of dividends in shares by shareholders, the creation of preferred shares and the conversion of preferred shares into ordinary shares.
Succession plan
As the Management Board is composed of four members, three of whom are legal entities, the continuity of the General Management is ensured.
In addition, Articles 20 and 21 of the Company's by-laws provide that the appointment of any new Managing Partner is the responsibility of the General Partners. If he/she is not a General Partner, his/her appointment requires the approval of the Shareholders’ Meeting.
In this context, the General Partners have for several years organised a succession plan for the Management Board that respects the entrepreneurial and family nature of the Company. In order to ensure a succession under optimal conditions, measures have been put in place to enable future executives to acquire a thorough knowledge of the Group, its activities and its environment within the subsidiaries.
-
5.3Supervisory Board
5.3.1Presentation
Composition
Supervisory Board members are appointed for a term of no more than three years by the Shareholders’ Meeting. The General Partners may not take part in their appointment. The General Partners and the Managing Partners may not be members of the Supervisory Board. No member of the Supervisory Board holds or has held an executive position within the Group. As the thresholds set out in Article L. 225-79-2 of the French Commercial Code have not been met, the Supervisory Board does not have any employee representatives as members.
The Supervisory Board appoints its Chair from among its members. The Chairman prepares, organises, and leads the work of the Supervisory Board.
The by-laws set the age limit for Supervisory Board members at 75 years. If the number of members of the Supervisory Board aged over 70 years old exceeds one-third of the members, the member aged 75 is deemed to have resigned at the close of the next Shareholders’ Meeting (in its ordinary form).
The by-laws provide that each member of the Supervisory Board must hold a minimum of 100 shares of the Company. The Supervisory Board’s internal regulations supplement this provision by specifying that each member of the Supervisory Board must allocate half of the compensation he/she receives to the acquisition of Rubis shares until he/she holds 250 shares. At 31 December 2021, the members of the Supervisory Board held 142,534 shares of the Company (representing approximately 0.14% of the share capital).
During the year under review, the reappointments of Laure Grimonpret-Tahon, Hervé Claquin and Erik Pointillar and the appointment of Nils Christian Bergene were approved by the Shareholders’ Meeting of 10 June 2021.
As of 10 March 2022, the Supervisory Board was composed of 10 members, including five women (50%), five independent members (50%), and one member of foreign nationality (10%).
Summary presentation of the composition of the Supervisory Board and its Committees (aS OF 10 March 2022)
Name
Age
Gender
Date of first appointment
Expiry
of current
term of
officeSeniority
on the BoardIndepen-
denceParticipation
in the
Accounts
and Risk
Monitoring
CommitteeParticipation
in the
Compensation
and
Appointments
CommitteeOlivier Heckenroth
Chair of the Supervisory Board
70 years
M
15/06/1995
2023 AGM
26 years
●
●
Nils Christian Bergene
67 years
M
10/06/2021
2024 AGM
1 year
●
●
Hervé Claquin
72 years
M
14/06/2007
2024 AGM
14 years
Marie-Hélène Dessailly
73 years
F
09/06/2016
2022 AGM
5 years
●
●
Carole Fiquemont
56 years
F
11/06/2019
2022 AGM
3 years
●
Aurelie Goulart-Lechevalier
40 years
F
11/06/2019
2022 AGM
3 years
Laure Grimonpret-Tahon
40 years
F
05/06/2015
2024 AGM
6 years
●
●
Marc-Olivier Laurent
70 years
M
11/06/2019
2022 AGM
3 years
●
Chantal Mazzacurati
71 years
F
10/06/2010
2022 AGM
11 years
●
Chair
Chair
Erik Pointillart
69 years
M
24/03/2003
2024 AGM
18 years
●
Average
age: 63Parity
Average seniority: 9 years
Indepen-
dence
rate: 50%Indepen-
dence
rate: 60%Indepen-
dence
rate: 50%Terms of office expiring in 2022, renewals and appointments
The terms of office of Marie-Hélène Dessailly, Carole Fiquemont, Aurélie Goulard-Lechevalier, Chantal Mazzacurati and Marc-Olivier Laurent expire at the close of the 2022 Shareholders’ Meeting.
The Supervisory Board meeting of 10 March 2022 decided to present the renewal of the appointments of Carole Fiquemont, Chantal Mazzacurati and Marc-Olivier Laurent, but, considering the age limit set in the by-laws, not to renew the appoint of Marie-Hélène Dessailly. Moreover, in accordance with her wish, Aurélie Goulard-Lechevalier will neither be presented for reappointment.
Upon proposal of the Compensation and Appointments Committe (following a process of selection led by a specialised search firm), the Supervisory Board also decided to present the appointments of Cécile Maisonneuve, Carine Vinardi and Alberto Pedrosa as Supervisory Board Members to the 2022 Shareholders' Meeting.
The Supervisory Board, having reviewed the work and the opinion of the Compensation and Appointments Committee, considered that Carole Fiquemont, Cécile Maisonneuve, Carine Vinardi and Alberto Pedrosa met the independence criteria set by the Company and should therefore be qualified as independent.
Thus, at the close of the 2022 Shareholders’ Meeting, subject to the reappointment of Carole Fiquemont, Chantal Mazzacurati and Marc-Olivier Laurent and the appointment of Cécile Maisonneuve, Carine Vinardi and Alberto Pedrosa and after taking into account that the appointments of Marie-Hélène Dessailly and Aurélie Goulard-Lechevalier will not be renewed, the Supervisory Board will be made up of 11 members, of whom five will be women (45%), six will be independent (55%) and two will be foreign nationals (18%).
In 2022, the Supervisory Board considered that the objective of changing its composition should take precedence over the sequencing of terms of office in order to comply with the independence rates and the diversity policy. However, the Supervisory Board has committed to take into consideration the expectations expressed by certain investors on a balanced sequencing of terms over the next several years.
Changes in the composition of the Supervisory Board between the Shareholders’ Meetings of 10 June 2021 and 9 June 2022
(subject to the reappointment of Carole Fiquemont, Chantal Mazzacurati and Marc-Olivier Laurent and the appointment of Cécile Maisonneuve, Carine Vinardi and Alberto Pedrosa).
At the close
of the AGM ofDeparture
Appointment
Renewal
Supervisory Board
10 June 2021
-
Nils Christian Bergene*
Laure Grimonpret-Tahon*
Hervé Claquin
Erik Pointillart
9 June 2022
Marie-Hélène Dessailly*
Aurélie Goulart-Lechevalier
Cécile Maisonneuve*
Carine Vinardi*
Alberto Pedrosa*
Carole Fiquemont*
Chantal Mazzacurati**
Marc-Olivier Laurent
* Independent member of the Supervisory Board.
** Member losing her independent qualification at the close of the 9 June 2022 Shareholders’ Meeting due to her length of service on the Supervisory Board.
Profile and list of offices and functions of the members of the Supervisory Board (as of 31 December 2021)
Olivier HECKENROTH
Experience and expertise
With a master’s degree in law and political science, and a bachelor’s degree in history, Olivier Heckenroth began his career in 1977 with the Société Commerciale d’Affrètement et de Combustibles (SCAC). He was subsequently technical advisor first to the Information and Communications Unit of the French Prime Minister (1980-1981), and then to the French Ministry of Defense (1981-1987). In 1987, he was appointed Chairman and CEO of HV International before becoming Chairman (2002-2004), and then Chairman and CEO (2004-2007) of HR Gestion. Since 2004, Olivier Heckenroth has been Managing Partner of SFHR, a licensed Bank in 2006, then Banque Hottinguer in 2012. He was a Management Board member and CEO of Banque Hottinguer from 2013 to 2019. He is also a former auditor of the Institut des Hautes Études de la Défense Nationale.
Chair of the Supervisory Board
Member of the Accounts and Risk Monitoring Committee
Member of the Compensation and Appointments Committee
Non-independent member
Born on 10 December 1951
French nationality
Current main function
Chair of Heckol Ltd
Professional address
c/o Rubis
46, rue Boissière
75116 Paris – FranceNumber of Rubis shares held as of 31/12/2021
6,000
Term of office on Rubis Supervisory Board
Date of first appointment: 15 June 1995.
Date of last renewal: 11 June 2020.
End of term: 2023 Shareholders’ Meeting convened to approve the financial statements for the 2022 financial year.
List of offices held outside the Group in the last five years
Current terms of office
In France
Listed companies
None
Unlisted companies
- •Director of Sicav HR Monétaire, Larcouest Investissements and Ariel.
Outside France
None
Terms of office that have expired during the last five years
- •Director of HR Courtage;
- •Representative of Banque Hottinguer on the Board of Directors of the Stema Sicav;
- •Chair of the Audit Committee of Banque Hottinguer;
- •Director of MM. Hottinguer & Cie Gestion Privée (a company controlled by Banque Hottinguer);
- •Representative of Banque Hottinguer on the Board of Directors of HR Patrimoine Monde and HR Patrimoine Europe;
- •Director of Bolux (Sicav listed in Luxembourg);
- •Member of the Supervisory Board of Banque Hottinguer.
Nils Christian BERGENE
Experience and expertise
A graduate of Science Po Paris and INSEAD, Nils Christian Bergene began his career in 1979 at BRS in Paris as a maritime charter broker before returning to Norway to head various maritime companies within the Kvaerner industrial group. Since 1993, Mr. Bergen has worked as an independent maritime charter broker through his own company, Nitrogas.
Member of the Accounts and Risk Monitoring Committee
Independent member
Born on 24 July 1954
Norwegian nationality
Current main function
Maritime transport broker
Professional address
Nitrogas Grimelundshaugen 11
0374 Oslo
NorwayNumber of Rubis shares held as of 31/12/2021
1,900
Term of office on Rubis Supervisory Board
Date of first appointment: 10 June 2021.
Date of last renewal: -
(previously, member of the Supervisory Board (appointed by the 6 June 2000 Shareholders’ Meeting – term expired at the close of the 5 June 2015 Shareholders’ Meeting))
End of term: 2024 Shareholders’ Meeting convened to approve the financial statements for the 2023 financial year.
List of offices held outside the Group in the last five years
Current terms of office
In France
None
Abroad
None
Listed companies
None
Unlisted companies
- •Lorentzen & Stemoco AS;
- •Skipsreder Jørgen J. Lorentzens fund (foundation)
Terms of office that have expired during the last five years
None
Hervé CLAQUIN
Experience and expertise
After graduating from HEC business school, Hervé Claquin began his career as a financial analyst with Crédit Lyonnais in 1974 before joining ABN AMRO Group in 1976. In 1992, he created ABN AMRO Capital France to develop the private equity business focusing on mid-market companies. In 2008, ABN AMRO Capital France became independent and was renamed Abénex Capital, which he chaired until 2017.
Non-independent member
Born on 24 March 1949
French nationality
Current main function
Director of Abénex
CapitalProfessional address
Abénex Capital SAS
9, avenue Percier
75008 Paris – FranceNumber of Rubis shares held as of 31/12/2020
62,984 (directly) and 33,663 (via Stefreba SAS, a holding company wholly owned by Hervé Claquin)
Term of office on Rubis Supervisory Board
Date of first appointment: 14 June 2007.
Date of last renewal: 10 June 2021.
End of term of office: 2024 Sh areholders’ Meeting convened to approve the financial statements for the 2023 financial year.
List of offices held outside the Group in the last five years
Current terms of office
In France
Listed companies
None
Unlisted companies
- •Chairman of Stefebra (SAS);
- •Director of Abénex Capital (SAS);
- •Chief Executive Officer of CVM Investissement (SAS) (Abénex Group);
- •Non-voting member of the Board of Directors of Pemista SAS;
- •Director of Andromède (SAS).
Outside France
None
Terms of office that have expired during the last five years
- •Director of Holding des Centres Point Vision (SAS) (Point Vision Group);
- •Chairman of the Strategy Committee of Dolski (SAS) (Outinord Group);
- •Chair of the Board of Directors of Œneo SA (listed company);
- •Chief Executive Officer of Gd F Immo Holding (SAS) (Abénex Group);
- •Chairman of SPPICAV Fresh Invest Real Estate (Abénex Group);
- •Manager of Stefreba (SARL);
- •Chairman of Abénex Capital (SAS) and of Financière OFIC SAS;
- •Director of Sicav de Neuflize Europe Expansion and of Neuflize France;
- •Member of the Supervisory Board of Buffalo Grill (public limited company with a Board of Directors), Rossini Holding SAS (Buffalo Grill Group), Onduline (public limited company with a Board of Directors), RG Holding (simplified joint-stock company), Nextira One Group BV and Ibénex OPCI;
- •Member of the Strategy Committee of Rossini Holding SAS (Buffalo Grill Group);
- •Chair and member of the Management Committee of Financière OFIC SAS (Onduline Group);
- •Director of Ibénex Lux SA (Abénex Group) (Luxembourg).
Marie-Hélène DESSAILLY
Experience and expertise
Marie-Hélène Dessailly holds an advanced graduate diploma in Economics and started her professional career in 1974 in the Branches Department of Banque Rothschild before joining Banque Vernes et Commerciale de Paris in 1980 as authorised representative of the Large Companies Department, then principal authorised representative of the Financial Operations Department. In 1988, she joined Banque du Louvre as Deputy Director and Director of Financial Operations before creating, MHD Conseil insurance consultancy (AXA agent) in 1993, which she sold in 2012. From 2012 to 2018, Ms. Dessailly was the Chairwoman of Artois Conseil SAS, a consultancy, analysis, and audit services firm, which also provides organisational and strategy advice for insurance professionals.
Member of the Accounts and Risk Monitoring Committee
Independent member
Born on 22 March 1948
French nationality
Current main function
Consultant to MAJ Conseil SARL
Professional address
c/o Rubis
46, rue Boissière
75116 Paris - FranceNumber of Rubis shares held as of 31/12/2021
2,194
Term of office on Rubis Supervisory Board
Date of first appointment: 9 June 2016.
Date of last renewal: 11 June 2019.
End of term of office: 2022 Shareholders’ Meeting convened to approve the financial statements for the 2021 financial year.
List of offices held outside the Group in the last five years
Current terms of office
In France
None
Outside France
None
Terms of office that have expired during the last five years
- •Associate Director of MAJ Conseil SARL;
- •Chairwoman of Artois Conseil SAS.
Carole FIQUEMONT
Experience and expertise
Carole Fiquemont holds a degree in accounting. After several years’ experience in accounting and auditing, she joined Groupe Industriel Marcel Dassault (holding company of the Dassault Group) in 1998, where she currently serves as Corporate Secretary. In this capacity, she is in charge of and responsible for matters concerning accounting and consolidated financial statements, taxation, corporate matters, and the negotiation of investment and divestment transactions.
Independent member
Born 3 June 1965
French nationality
Current main function
Corporate Secretary of GIMD
Professional address
GIMD
9, rond-point des Champs-Élysées –
Marcel Dassault
75008 Paris – FranceNumber of Rubis shares held as of 31/12/2021
1,214
Term of office on Rubis Supervisory Board
Date of first appointment: 11 June 2019.
End of term of office: 2022 Shareholders’ Meeting convened to approve the financial statements for the 2021 financial year.
List of offices held outside the Group in the last five years
Current terms of office
In France
Listed companies
- •Member of the Management Board of Immobilière Dassault SA.
Unlisted companies
- •Director of Artcurial SA, CPPJ SA and Figaro Classifieds SA;
- •Member of the Supervisory Board of Les Maisons du Voyage SA, Marco Vasco SA;
- •Member of the Supervisory Board of Dassault Real Estate SAS and Financière Dassault.
Outside France
Listed companies
None
Unlisted companies
- •Director of Dasnimmo SA (Switzerland), Sitam SA (Switzerland), Sitam Ventures (Switzerland) and Sitam Luxembourg;
- •Manager of DRE Trebol Diagonal (Spain);
- •Director of 275 Sacramento Street LLC (USA);
- •Director/Secretary at Sitam America (USA).
Terms of office that have expired during the last five years
- •Member of the Supervisory Board of Bluwan SAS;
- •Director of SABCA (Belgium) (listed company) and Terramaris International (Switzerland);
- •Secretary of Marcel Dassault Trading Corporation (USA).
Aurélie GOULART-LECHEVALIER
Experience and expertise
Chartered accountant, statutory auditor, and a graduate of Paris Dauphine University (MSTCF and postgraduate diploma in Taxation), Aurélie Goulart-Lechevalier has been a partner of Groupe Fiderec since 2012, after having practiced for seven years at Deloitte & Associés (six years in audit, two of which on major accounts in New York, then one year in accounting in the international team). Aurélie Goulart-Lechevalier today works mainly in the field of accounting (SMEs, French and international groups) in all business sectors.
Non-independent member
Born on 1 July 1981
French nationality
Current main function
Managing Partner of Groupe Fiderec
Professional address
Groupe Fiderec
160 B, rue de Paris
92100 Boulogne-Billancourt – FranceNumber of Rubis shares held as of 31/12/2021
352
Term of office on Rubis Supervisory Board
Date of first appointment: 11 June 2019.
End of term of office: 2022 Shareholders’ Meeting convened to approve the financial statements for the 2021 financial year.
List of offices held outside the Group in the last five years
Current terms of office
In France
Listed companies
None
Unlisted companies
- •Manager of Fiderec Expertise SARL;
- •Chairwoman of Fiderec Consulting SARL;
- •Chief Executive Officer of Fiderec Audit SAS.
Outside France
None
Terms of office that have expired during the last five years
None
Laure GRIMONPRET-TAHON
Experience and expertise
With a DEA (postgraduate degree) in international and European and international business law and litigation and a master’s degree in law and management from Essec, Laure Grimonpret-Tahon began her career in 2006 as in-house counsel in Dassault Systèmes’ company and contracts departments before moving to Accenture Paris (2007-2014) as Legal Officer in charge of corporate matters, compliance and contracts. She joined the Legal Department of CGI (an independent IT and business management services company) in 2014 and is currently General Counsel for Western Europe and Southern Europe, in charge of internal affairs, customer contracts and labour relations.
Member of the Compensation
and Appointments
CommitteeIndependent member
Born on 26 July 1981
French nationality
Current main function
General Counsel of CGI
Professional address
CGI
17, place des Reflets
Immeuble CB16
92097 Paris-La-Défense Cedex – FranceNumber of Rubis shares held as of 31/12/2021
433
Term of office on Rubis Supervisory Board
Date of first appointment: 5 June 2015.
Date of last renewal: 10 June 2021.
End of term of office: 2024 Shareholders’ Meeting convened to approve the financial statements for the 2023 financial year.
List of offices held outside the Group in the last five years
Current terms of office
In France
None
Outside France
None
Terms of office that have expired during the last five years
None
Marc-Olivier LAURENT
Experience and expertise
Marc-Olivier Laurent is a graduate of HEC and holds a PhD in African social anthropology from Paris-Sorbonne University. Between 1978 and 1984, he was responsible for investments at Institut de Développement Industriel (IDI). From 1984 to 1993, he headed the M&A, Corporate Finance and Equity division of Crédit Commercial de France. Mr. Laurent joined Rothschild & Co. in 1993 as Managing Director, and became a Partner in 1995. Mr. Laurent is currently Executive Chairman of Rothschild & Co. Merchant Banking and Managing Partner of Rothschild & Co. Gestion.
Member of the Accounts and Risk Monitoring Committee
Non-independent member
Born on 4 March 1952
French nationality
Current main function
Managing Partner of Rothschild & Co. Gestion
Executive Chairman of Rothschild & Co. Merchant Banking
Professional address
Rothschild & Co. Merchant Banking Five Arrows Managers
23 bis, avenue Messina
75008 Paris – FranceNumber of Rubis shares held as of 31/12/2021
23,868
Term of office on Rubis Supervisory Board
Date of first appointment: 11 June 2019.
End of term of office: 2022 Shareholders’ Meeting convened to approve the 2021 financial statements.
List of offices held outside the Group in the last five years
Current terms of office
In France
Listed companies
None
Unlisted companies
- •Managing Partner of Rothschild & Co Gestion SAS (RCOG);
- •Chairman and Member of the Board of Directors of Institut Catholique de Paris (ICP);
- •Vice-Chairman and member of the Board of Directors of Caravelle;
- •Member of the Supervisory Board of Arcole Industries.
Outside France
None
Terms of office that have expired during the last five years
None
Chantal MAZZACURATI
Experience and expertise
Chantal Mazzacurati is a graduate of HEC business school. She spent her entire career with BNP and then BNP Paribas, where she held a variety of roles in finance, first in the Finance Department, then as Director of Financial Affairs and Industrial Investments, and finally as Head of the Global Equities business line.
Chair of the Accounts
and Risk Monitoring
CommitteeChair of the
Compensation and
Appointment
CommitteeIndependent member
Born on 12 May 1950
French nationality
Current main function
Chief Executive Officer of Groupe Milan SAS
Professional address
Groupe Milan
36, rue de Varenne
75007 Paris – FranceNumber of Rubis shares held as of 31/12/2021
8,075
Term of office on Rubis Supervisory Board
Date of first appointment: 10 June 2010.
Date of last renewal: 11 June 2019.
End of term of office: 2022 Shareholders’ Meeting convened to approve the financial statements for the 2021 financial year.
List of offices held outside the Group in the last five years
Current terms of office
In France
Listed companies
None
Unlisted companies
- •Chief Executive Officer of Groupe Milan SAS;
- •Member of the Supervisory Board, the Risk Monitoring Committee and the Compensation Committee of BNP Paribas Securities Services.
Outside France
None
Terms of office that have expired during the last five years
Member of the Management Board of Groupe Milan.
Erik POINTILLART
Experience and expertise
A graduate of the Institut d’Études Politiques in Paris, Erik Pointillart has 36 years’ experience in the French and European financial sector. He began his career in 1974 in BNP’s Finance Department. He joined Caisse des Dépôts in 1984, and became Chief Executive Officer of CDC Gestion in 1990. In 1994, he joined Écureuil Gestion as Director of Bond and Monetary Management, and in October 1999 became Director of Development and Chairman of the Company’s Management Board.
Member of the
Compensation and
Appointments
CommitteeNon-independent member
Born on 7 May 1952
French nationality
Current main function
Vice-Chairman of IEFP
Professional address
c/o Rubis
46, rue Boissière
75116 Paris – FranceNumber of Rubis shares held as of 31/12/2021
1,851
Term of office on Rubis Supervisory Board
Date of first appointment: 24 March 2003.
Date of last renewal: 10 June 2021.
End of term of office: 2024 Shareholders’ Meeting convened to approve the financial statements for the 2023 financial year.
List of offices held outside the Group in the last five years
Current terms of office
In France
Listed companies
None
Unlisted companies
- •Vice-Chairman of IEFP.
Outside France
None
Terms of office that have expired during the last five years
- •Partner at Nostrum Conseil.
Role of the Supervisory Board
As the Company is incorporated under the legal form of a Partnership Limited by Shares, by law, the Supervisory Board is responsible for continuous oversight of the Company’s management. For this purpose, the Supervisory Board enjoys the same powers as the Statutory Auditors. As such, unlike the Board of Directors of a public limited company (société anonyme), the Supervisory Board may not intervene in the management and administration of the Company.
The Supervisory Board is assisted by its Committees, namely the Accounts and Risk Monitoring Committee and the Compensation and Appointments Committee.
The Supervisory Board’s recurring duties are notably specified in its internal regulations (updated on 10 March 2022) and principally consist of the following:
- •reviewing the accounts, ensuring the consistency of the accounting methods used to prepare the Company’s consolidated and separate financial statements and ensuring the quality, completeness and fairness of the financial statements;
- •monitoring the Group’s activity;
- •assessing the financial and non-financial risks related to the business and monitoring the corrective measures that have been put in place;
- •making a proposal on the principal Statutory Auditors in view of their appointment by the Shareholders’ Meeting and verifying their independence;
- •reviewing the independence of its (future) members;
- •establishing specialised Committees to assist it with the performance of its duties and appointing their members;
- •conducting a self-assessment;
- •providing an advisory opinion on the compensation policy applicable to the Managing Partners in accordance with the provisions of Article L. 22-10-76 of the French Commercial Code;
- •confirming that the compensation of the Managing Partners to be paid or awarded in respect of the past financial year complies with the compensation policy previously approved by the shareholders at the Shareholders’ Meeting and with the by-laws;
- •confirming that the compensation of the Chairman of the Supervisory Board to be paid or awarded in respect of the past financial year complies with the policy previously approved by the shareholders at the Shareholders’ Meeting;
- •setting the compensation policy applicable to its members;
- •allocating the aggregate amount of compensation to be granted to members of the Supervisory Board, including a portion based on attendance and Committee chairing and/or membership, as the case may be;
- •verifying compliance of the General Partners’ rights to profits;
- •granting advance authorisation prior to the conclusion of related-party agreements;
- •assessing the efficiency of the procedure for evaluating agreements relating to ordinary course transactions entered into on arm’s length terms and improving such procedure as appropriate;
- •preparing the corporate governance report (which is attached to the management report) pursuant to Article L. 22-10-78 of the French Commercial Code;
- •preparing the report on its continuous management oversight mission;
- •deliberating on the professional and wage equality policy;
- •reviewing the quality of information provided to shareholders and to the market;
- •monitoring the exchanges the Company has with its shareholders and the market;
- •monitoring the corporate social responsibility (CSR) projects being implemented.
To enable the Supervisory Board to perform its duties, the internal regulations provide that the Management Board must inform it of matters such as:
- •trends in each division and future prospects within the framework of the strategy set by the Management Board;
- •acquisitions and/or disposals of businesses or subsidiaries, equity investments and, more generally, any major investment;
- •changes in bank debt and financial structure within the framework of the financial policy set by the Management Board;
- •internal control procedures defined and developed by the Company and by Rubis Énergie and its subsidiaries under the authority of the Management Board, which is responsible for overseeing the implementation of those procedures;
- •draft agendas for Shareholders’ Meetings;
- •any major acquisition that is not part of the defined strategy prior to its completion;
- •corporate social responsibility (CSR) projects;
- •compliance matters;
- •status of the Management Board succession plan implemented by the General Partners.
Diversity policy applied to the Supervisory Board and selection process for its members
The composition of the Supervisory Board is designed to ensure that it is able to fulfill all of its duties.
When examining and giving advice on its current and future composition, the Supervisory Board relies on the work of its Compensation and Appointments Committee, on the results of the most recent assessment of its work, and on the responses to a questionnaire sent annually to each of its members. On the advice of the Compensation and Appointments Committee, the Supervisory Board ensures that its members have complementary skills (based notably on education and professional experience) and are diverse from a personal point of view (based in particular on nationality, gender and age). Other factors are also taken into account (independence, compliance with the rules on multiple Directorships the person’s ability to fit in with the Supervisory Board’s culture).
The selection of new candidates and the reappointment of existing members is examined by the Compensation and Appointments Committee and then by the Supervisory Board in the light of the above-mentioned factors, with a view to enriching the work of the Supervisory Board.
Additionally, the Supervisory Board meeting of 10 March 2022 observed that, in light of the work carried out by the Compensation and Appointments Committee, the objectives it had set for achievement by 2022 at its 12 March 2019 meeting (i.e., maintaining a percentage of women on the Supervisory Board of at least 40% each year; meeting the age requirements provided for in Article 27 of the by-laws each year, maintaining the proportion of Supervisory Board members with international business experience at one-third at a minimum; ensuring that at least one member of the Board has professional experience in the Company’s business sectors) had been met.
Over the period under review, the implementation of this policy resulted in the establishment of specific criteria applicable to the search for new members, having led to the identification of candidates and competencies aimed at enhancing the Supervisory Board’s work. A specialised search firm was appointed on this basis and presented several candidates. The Compensation and Appointments Committee met the candidates who were selected for consideration and provided its opinion to the Supervisory Board at the Board’s 10 March 2022 meeting.
Therefore, upon the proposal of the Compensation and Appointments Committee, the candidacies of Cécile Maisonneuve, Carine Vinardi and Alberto Pedrosa for appointment as members of the Supervisory Board were selected at that Committee’s 10 March 2022 meeting. As a result, their appointments will be proposed to the 2022 Shareholders’ Meeting.
It was found that these three candidates would contribute to enhancing the Supervisory Board’s work, as:
- •Cécile Maisonneuve would notably bring to the Supervisory Board her skills and experience in the CSR area;
- •Carine Vinardi would notably bring to the Supervisory Board her skills and experience in the following areas: management of large industrial groups, HR, CSR and security;
- •Alberto Pedrosa would notably bring to the Supervisory Board his skills and experience in the following areas: management of large industrial groups, finance and audit, HR and security.
In addition, the Supervisory Board could benefit from these three candidates' significant international experiences.
As Alberto Pedrosa is not a French national, the percentage of members of the Supervisory Board who are of foreign nationality would increase from 10% to 18%.
Information relating to Cécile Maisonneuve, Carine Vinardi and Alberto Pedrosa is included in the Notice of Meeting for the 2022 Shareholders’ Meeting.
Table summarising the diversity of skills of the Supervisory Board (as of 10 March 2022)
Management of large industrial or banking groups
International experience
Finance and audit
Legal
M&A
Compliance
Insurance
HR
CSR
Security
Olivier
Heckenroth●
●
●
●
●
●
●
Nils Christian Bergene
●
●
●
●
●
●
●
Hervé
Claquin●
●
Marie-Hélène Dessailly
●
●
●
Carole
Fiquemont●
●
●
●
●
Aurelie
Goulart-
Lechevalier●
●
●
●
●
Laure
Grimonpret-
Tahon●
●
●
●
●
●
Marc-Olivier
Laurent●
●
●
●
Chantal
Mazzacurati●
●
●
●
Erik
Pointillart●
●
●
Total
4
6
9
5
7
5
4
1
3
2
Independence
Each year, the Supervisory Board assesses the independence of its members and of potential candidates. It relies on the work carried out and the advice issued by the Compensation and Appointments Committee. The Supervisory Board has chosen to comply with the definition of independence set out in the Afep-Medef Code and considers that a member is independent when he/she has no relationship of any kind whatsoever with the Company, its Group or its Management that may compromise the exercise of his/her freedom of judgment. Therefore, to be qualified as independent, a member of the Supervisory Board must meet all the following criteria:
- •not be, or have been during the previous five years, an employee or executive corporate officer (dirigeant mandataire social exécutif) of the Company, or an employee, executive corporate officer or Director of one of the Company’s consolidated companies;
- •not be an executive corporate officer of a company in which the Company holds a direct or indirect position as a Director, or in which an employee designated in such capacity or an executive corporate officer of the Company (currently or who has been so within the past five years) holds a Directorship;
- •not be a customer, supplier, investment banker, finance banker or consultant:
- •that is significant to the Company or its Group, or
- •for which the Company or its Group represent a significant share of business;
- •not have close family ties with a corporate officer;
- •not have been a Statutory Auditor of the Company during the previous five years;
- •not have been a member of the Supervisory Board for more than 12 years, since a member can no longer be classified as independent as of the anniversary date of their 12 years of service;
- •the Chairman of the Supervisory Board cannot be considered independent if he/she receives variable compensation in cash or securities or any compensation tied to the performance of the Company or the Group;
- •not represent a significant shareholder (> 10% of share capital and/or voting rights) that exercises control over the Company.
In accordance with the recommendations of the Afep-Medef Code, the Supervisory Board is free to determine that one of its members cannot be qualified as independent even though he/she fulfills the independence criteria listed above.
After examining the situation of each of its members and in view of the work of and advice of the Compensation and Appointments Committee, at its meeting of 10 March 2022, the Supervisory Board found that Marie-Hélène Dessailly, Carole Fiquemont, Laure Grimonpret-Tahon, Chantal Mazzacurati and Nils Christian Bergene met the independence criteria defined by the Company and should therefore be qualified as independent, all while noting that upon the close of the 2022 Shareholders’ Meeting, Chantal Mazzacurati could no longer be qualified as independent since the length of her service as a member of the Supervisory Board would at that point exceed 12 years. The Supervisory Board also found that Aurélie Goulart-Lechevalier could not be qualified as independent due to business relationship a member of her family had with the Group in 2020 and 2021. The Compensation and Appointments Committee conducted an in-depth assessment of the situation of Marc-Olivier Laurent, Managing Partner of Rothchild & Co Gestion, insofar as this company provided services to one of Rubis’ subsidiaries (a JV) in the first quarter of 2022 and for a finite period. The Committee found that Marc-Olivier Laurent had not been involved in the conclusion of this services agreement and was not involved in the performance of that agreement. The Committee also noted that the financial weight of this agreement was not significant to either Rothchild & Co Gestion or Rubis’ subsidiary. Finally, the Committee observed that the subsidiary’s contractual relationship with Rothschild & Co Gestion was not an exclusive relationship and was purely ad hoc. Nevertheless, the Committee concluded that, although the factors examined ensure that this services agreement could not compromise Marc-Olivier Laurent’s freedom of judgment, in view of the current expectations of certain investors, Marc-Olivier Laurent could not be qualified as being independent. After having reviewed the work and advice of the Compensation and Appointments Committee, the Supervisory Board confirmed that Marc-Olivier. Laurent could not be qualified as independent as of 10 March 2022. Finally, the Supervisory Board found that Olivier Heckenroth, Hervé Claquin and Erik Pointillart could not be qualified as independent due to the length of their service on the Board.
Table summarising the independence of members of the Supervisory Board (as of 10 March 2022)
Independence criteria
Independance
Not an
employee
or corporate
officer during
the last five
yearsAbsence of
“reciprocal
offices”No significant
business
relationshipNo close
family ties with
a corporate
officerNot a
Statutory
Auditor in
the last five
yearsSeniority
on the Board ≤ 12 yearsNo variable
or performance-
related compensationShare
capital and
voting rights
≤ 10%Olivier Heckenroth
●
●
●
●
●
●
●
Nils Christian Bergene
●
●
●
●
●
●
●
●
✓
Hervé Claquin
●
●
●
●
●
●
●
Marie-Hélène Dessailly
●
●
●
●
●
●
●
●
✓
Carole Fiquemont
●
●
●
●
●
●
●
●
✓
Aurélie Goulart-Lechevalier
●
●
●
●
●
●
●
Laure Grimonpret-Tahon
●
●
●
●
●
●
●
●
✓
Marc-Olivier Laurent
●
●
●
●
●
●
●
Chantal Mazzacurati*
●
●
●
●
●
●
●
●
✓
Erik Pointillart
●
●
●
●
●
●
●
Independence rate
50%
* Member losing her independant qualification at the close of the 9 June 2022 Shareholders’ Meeting due to her length of service on the Supervisory Board.
In accordance with the recommendations of the Afep-Medef Code and the provisions of its internal regulations, as of 10 March 2022, half of the members of the Supervisory Board are independent (independence rate of 50%).
In addition, after having examined the situation of Cécile Maisonneuve, Carine Vinardi and Alberto Pedrosa in view of the work and the advice of the Compensation and Appointments Committee, at its meeting of 10 March 2022, the Supervisory Board found that these candidates met the independence criteria and should therefore be qualified as independent.
As a result, subject to the three appointments and the three reappointments proposed to the 2022 Shareholders’ Meeting, in light of the fact that the appointments of Marie-Hélène Desailly and Aurélie Goulard-Lechevalier will not be renewed and considering that Chantal Mazzacurati will lose her independent qualification at the close of this Shareholders' Meeting, the rate of independence on the Supervisory Board at the close of the 2022 Meeting would stand at 55%.
-
5.4Corporate officer compensation
5.4.1Principles of the compensation policy applicable to corporate officers
Decision-making process followed for the determination, review and implementation of the compensation policy
Pursuant to Article L. 22-10-76(I) of the French Commercial Code, in Partnerships Limited by Shares whose shares are admitted to trading on a regulated market:
- •the policy applicable to the Management Board’s compensation is set by the General Partners (deciding unanimously, unless otherwise provided in the by-laws) after receiving an advisory opinion from the Supervisory Board and aking into account, as applicable, the principles and conditions provided for in the by-laws;
- •the compensation policy applicable to members of the Supervisory Board is established by Supervisory Board.
In addition, under the terms of the internal regulations of the Company’s Supervisory Board and of the Compensation and Appointments Committee:
- •the advisory opinion on the General Partners’ proposal concerning the compensation policy applicable to the Management Board is issued by the Supervisory Board each year in the light of the work previously carried out by the Compensation and Appointments Committee;
- •each year, the Compensation and Appointments Committee submits to the Supervisory Board a draft compensation policy applicable to Supervisory Board members.
The compensation policies applicable to the Management Board and to of the members of the Supervisory Board are submitted each year (and at the time of each significant change) for the approval of the Shareholders’ Meeting (in its ordinary form).
The compensation policy applicable to the Company’s corporate officers is designed to ensure stability. However, the components of the compensation policy applicable to the Management Board (other than those relating to fixed compensation) may be revised by a decision of the General Partners taken after receiving an advisory opinion from the Supervisory Board and subject to the approval of the Shareholders’ Meeting. Similarly, the compensation policy applicable to members of the Supervisory Board may be revised by a decision of the Supervisory Board and subject to the approval of the Shareholders’ Meeting.
Each year, the Shareholders’ Meeting and the General Partners vote on the components (fixed, variable and exceptional) comprising the total compensation and benefits of any kind paid during or awarded in respect of the past financial year via separate resolutions for each Managing Partner (except when no compensation of any kind is paid to it during or awarded in respect of such financial year) and for the Chairman of the Supervisory Board.
If the compensation policy approved by the Shareholders’ Meeting is not complied with, no compensation of any kind whatsoever may be determined, awarded or paid by the Company, under penalty of being null and void.
Prior to the shareholders’ vote, under the terms of the internal regulations of the Company’s Compensation and Appointments Committee, the Compensation and Appointments Committee:
- •determines the components of compensation to be paid or awarded in respect of the past financial year to the Management Board in accordance with the policy approved by the Shareholders’ Meeting held during such financial year. The Supervisory Board verifies that these items comply with such policy;
- •determines the components of compensation to be paid or awarded in respect of the past financial year to the Chairman of the Supervisory Board in accordance with the policy approved by the Shareholders’ Meeting held during such financial year. The Supervisory Board verifies that these items comply with such policy;
- •proposes an allocation of the aggregate amount to be granted to the members of the Supervisory Board in respect of the past financial year. The Supervisory Board verifies that such amount and breakdown comply with the policy it established for the past financial year and which was approved by shareholders during such financial year.
Lastly, with the approval of the General Partners, the Shareholders’ Meeting votes on a single draft resolution concerning information on the fixed, variable and exceptional compensation paid during or awarded in respect of the past financial year to all corporate officers.
Compensation policy in line with the corporate interest, sales strategy and the sustainability of the Company
On the advice of the Supervisory Board, the General Partners ensure that the compensation policy applicable to the Management Board complies with the Company’s corporate interest, is in line with its business strategy and contributes to the Company’s sustainability.
Thus, the compensation policy applicable to the Management Board is in line with the Company’s interests to the extent that (i) its overall amount is measured against that paid to executive corporate officers of companies with equivalent market capitalisation (the Company conducts in-house studies or commissions studies from external firms to ensure this on a regular basis), (ii) the conditions governing employee compensation are taken into account since the fixed compensation is updated according to the indexed change in the hourly salary rates of employees (which in the meantime guarantees that any change in the fixed compensation be moderate), (iii) the annual variable compensation is capped, and (iv) no exceptional compensation of any kind is authorised. The General Partners and the Supervisory Board are also kept informed of the equity ratios and changes in those ratios in relation to the compensation of corporate officers and employees and the Company’s performance.
The compensation policy applicable to the Management Board forms part of the commercial strategy and thus contributes to the sustainability of the Company insofar as the criteria attached to annual variable compensation are based on regular growth in earnings, the solidity of the balance sheet, progressive improvement in employee’s employment conditions through the setting of objectives in the field of health/safety, progressive improvement in CO2 emissions and taking into account corporate social responsibility challenges as a whole.
Similarly, the Supervisory Board ensures that the compensation policy that applies to its members is consistent with the Company’s corporate interest and contributes to its sustainability. Thus, the maximum annual compensation budget for the Supervisory Board is measured compared with the budgets for non-executive corporate officers of companies with equivalent market capitalisation (the Company conducts in-house studies or commissions studies from external firms to ensure this on a regular basis). In addition, this compensation is related in part the to each member’s responsibilities (chairing and/or membership on Committees) and to his/her attendance.
Lastly, the comments and votes expressed by shareholders on compensation issues at Shareholders’ Meetings are analysed by the General Partners, the Supervisory Board and the Compensation and Appointments Committee (over 98% support for all resolutions relating to compensation issues at the 10 June 2021 Shareholders’ Meeting).
Application procedures for new corporate officers
-
5.5Additional items
Absence of conflicts of interest, impediments or convictions
No Managing Partner or member of the Supervisory Board has any conflict of interest between his/her duties to Rubis and his/her private interests and/or other duties to which he/she is bound.
To Rubis’ knowledge, there is no arrangement or agreement between the Company and the main shareholders, clients, suppliers or others pursuant to which the members of the Supervisory Board or the Managing Partners have been selected.
No Managing Partner or member of the Supervisory Board has ever been convicted of fraud, filed for bankruptcy or been placed in receivership or liquidation.
-
Information about the Company and its capital
-
6.1Information about the Company
Rubis is a French Partnership Limited by Shares (Société en Commandite par Actions) governed by Articles L. 226-1 to L. 226‑14 and L. 22-10-74 to L. 22-10-78 of the French Commercial Code and, insofar as they are compatible with the above-mentioned articles, by the provisions relating to Limited Partnerships (société en commandite simple) and public limited companies (sociétés anonymes). Within this legal framework, the Company is also governed by its by-laws.
- •General Partners, who have the status of merchants and are indefinitely and jointly and severally liable for corporate debts;
- •Limited Partners (or shareholders), who are non-merchants and whose liability is limited to the amount of their contributions.
The law and Rubis’ by-laws make the Partnership Limited by Shares a modern structure that is adapted to the principles of good corporate governance, as reflected by:
- •the very clear separation of powers between the Management Board, which governs corporate affairs, and the Supervisory Board, whose members are appointed by the shareholders and is tasked with overseeing the Company’s management, giving its opinion on the compensation policy applicable to the Management Board and determining the components of the compensation to be awarded and paid ex-post to corporate officers;
- •the unlimited personal liability of the General Partner, which attests to the appropriate match between commitment of assets, power and responsibility;
- •the awarding to the Supervisory Board of the same powers and rights to communication and of investigation as those granted to the Statutory Auditors;
- •the right of shareholders to oppose the appointment of a candidate for the Management Board when he/she is not a General Partner.
6.1.1General Partners
- •Gilles Gobin;
- •Sorgema, a simplified limited company (société par actions simplifiée) whose Chairman is Gilles Gobin and whose shareholders are members of the Gobin family group;
- •GR Partenaires, a Limited Partnership whose General Partners are the Gobin family group companies and Jacques Riou. The Limited Partners of GR Partenaires are Agena and members of the Riou family group.
-
6.2Information on share capital and share ownership
6.2.1Share capital as of 31 December 2021
The share capital as of 31 December 2021 amounts to €128,176,601.25, divided into 102,541,281 shares (102,535,090 ordinary shares and 6,191 preferred shares) with a par value of €1.25 each, following the transactions carried out during the 2021 financial year as set out in the table in section 6.2.3.
As of 31 December 2021, the number of exercisable voting rights was 102,461,968. As double voting rights are excluded by Article 40 of the by-laws, each ordinary share carries one voting right. However, preferred shares, which constitute long-term share-based compensation for Group employees and whose conversion into ordinary shares is notably subject to the fulfillment of performance conditions, do not have voting rights.
-
6.3Dividends
6.3.1Dividend paid to the Limited Partners (or shareholders)
The Company pursues a stable dividend policy, with a payout ratio of over 60% and medium- to long-term dividend growth in line with earnings per share.
Accordingly, the Company will propose a dividend of €1.86 per ordinary share and €0.93 per preferred share to the 2022 Shareholders’ Meeting, a more than 3% increase compared to the dividend paid in respect of the 2020 financial year (€1.80 per ordinary share and €0.90 per preferred share).
Preferred shares are entitled to a dividend equal to 50% of that paid for each ordinary share (rounded down to the nearest euro cent).
Dividends paid to shareholders over the last five years
Date of Shareholders’ Meeting
Financial year
Number of shares
Net dividend
distributed
(in euros)Total net amount paid out
(in euros)AGM 08/06/2017
2016
45,605,599 ordinary shares*
2.68*
122,223,005
AGM 07/06/2018
2017
95,048,202 ordinary shares
2,740 preferred shares
1.50
0.75
142,572,303
2,055
AGM 11/06/2019
2018
97,182,460 ordinary shares
2,740 preferred shares
1.59
0.79
154,520,111
2,165
AGM 11/06/2020
2019
100,345,050 ordinary shares
3,722 preferred shares
1.75
0.87
175,603,837
3,238
AGM 10/06/2021
2020
100,950,230 ordinary shares
5,188 preferred shares
1.80
0.90
181,710,414
4,669
* Before 28 July 2017 two-for-one share split, reducing the par value of each Rubis share.
-
6.4Employee shareholdings
At 31 December 2021, Group employees owned 1.53% of Rubis’ share capital and voting rights through the Rubis Avenir mutual fund. Since the fund it was put in place in 2002, Rubis has carried out a capital increase reserved for employees of eligible companies (companies with their registered office in France) every year. All these transactions have attracted a high level of participation by the Group’s employees.
6.4.1Capital increase reserved for Group employees: 2021 operation
Acting pursuant to the Combined Shareholders’ Meeting’s delegation of 11 June 2019, on 4 January 2021, the Management Board carried out a capital increase reserved for employees of eligible Group companies through the Rubis Avenir mutual fund.
In accordance with Article L. 3332-19 of the French Labour Code and the delegation granted by the shareholders, the subscription price for new shares was set at 70% of the average listing price during the 20 trading days preceding the 4 January 2021 meeting. This average amounted to €37.63, resulting in a subscription price of €26.35.
-
6.5Stock options, performance shares and preferred shares
In accordance with the provisions of Articles L. 225-184 and L. 225-197-4 of the French Commercial Code, this chapter constitutes the special report of the Management Board on stock options, performance shares and preferred shares.
6.5.1Award policy
The Company has set up stock options plans, performance shares plans and preferred shares plans to motivate and retain high-potential executives and Senior Managers of subsidiaries whom it wishes to keep in its workforce over the long term to ensure its future growth. These plans also enable the Company to ensure that the interests of beneficiaries are aligned with those of shareholders over the long term.
Pursuant to the recommendations of the Afep-Medef Code, all plans issued by the Company are fully subject to performance conditions and the beneficiaries’ continued presence in the Group’s workforce on the day options are exercised, the day performance shares or preferred shares vest as well as the day when the conversion period of preferred shares into ordinary shares starts.
-
6.6Relations with investors and financial analysts
The Group strives to maintain close relationships with financial analysts and all its shareholders, whether individual or institutional, French or foreign. Rubis has also developed its relationships with French and international brokers, including Berenberg, CM-CIC, Exane, Gilbert Dupont, Kepler Cheuvreux, Oddo, Portzamparc and Société Générale. Analyst and investor meetings and/or conference calls are held in when the annual (in March) and half-year (in September) results are released or at the time of any other significant event. In addition, conference calls are organised with financial analysts and institutional investors after the publication of quarterly revenue figures. In parallel, the Group’s management speaks at conferences and roadshows organised throughout the year by specialised financial intermediaries. Investors can also contact the Director of Investor Relations at any time.
Documents accessible to the public
Documents and information relating to the Company (in particular its by-laws and other corporate documents, such as Notices of Meetings), consolidated financial statements and separate financial statements for financial year 2021 and for previous years, may be consulted on the Company’s website (www.rubis.fr/en) and at its registered office under the conditions provided for by law.
The Company’s press releases, the 2020 and subsequent Universal Registration Documents and the earlier Registration Documents filed with the French Financial Markets Authority (AMF), together with their updates, where applicable, are available on the Company’s website.
Presentations made by the Group at the time its annual and half-year results are published, as well as quarterly financial information (revenue for the first, third and fourth quarters) and presentations relating to strategy and CSR issues can also be consulted on the Company’s website.
-
Financial statements
-
7.12021 consolidated financial statements and notes
Consolidated balance sheet
Assets
(in thousands of euros)
Note
31/12/2021
31/12/2020
Non-current assets
Intangible assets
4.3
31,574
31,000
Goodwill
4.2
1,231,635
1,219,849
Property, plant and equipment
4.1.1
1,268,465
1,148,302
Property, plant and equipment – right-of-use assets
4.1.2
166,288
178,542
Investments in joint ventures
9
322,171
316,602
Other financial assets
4.5.1
132,482
72,408
Deferred tax liabilities
4.6
12,913
14,405
Other non-current assets
4.5.3
10,408
10,762
Total non-current assets (I)
3,175,936
2,991,870
Current assets
Inventory and work in progress
4.7
543,893
333,377
Trade and other receivables
4.5.4
622,478
467,850
Tax receivables
21,901
33,463
Other current assets
4.5.2
23,426
20,472
Cash and cash equivalents
4.5.5
874,890
1,081,584
Total current assets (II)
2,086,588
1,936,746
Total group of assets held for sale (III)
Total assets (I + II + III)
5,262,524
4,928,616
Equity and liabilities
(in thousands of euros)
Note
31/12/2021
31/12/2020
Shareholders’ equity – Group share
Share capital
128,177
129,538
Share premium
1,547,236
1,593,902
Retained earnings
941,249
777,611
Total
2,616,662
2,501,051
Non-controlling interests
119,703
119,282
Shareholders’ equity (I)
4.8
2,736,365
2,620,333
Non-current liabilities
Borrowings and financial debt
4.10.1
805,667
894,015
Lease liabilities
4.10.1
138,175
141,122
Deposit/consignment
138,828
127,894
Provisions for pensions and other employee benefit obligations
4.12
56,438
60,189
Other provisions
4.11
159,825
142,893
Deferred tax liabilities
4.6
63,071
51,103
Other non-current liabilities
4.10.3
3,214
3,975
Total non-current liabilities (II)
1,365,218
1,421,191
Current liabilities
Borrowings and short-term bank borrowings (portion due in less than one year)
4.10.1
507,521
367,297
Lease liabilities (portion due in less than one year)
4.10.1
23,742
30,072
Trade and other payables
4.10.4
601,605
459,618
Current tax liabilities
23,318
22,819
Other current liabilities
4.10.3
4,755
7,286
Total current liabilities (III)
1,160,941
887,092
Total liabilities related to a group of assets held for sale (IV)
Total equity and liabilities (I + II + III + IV)
5,262,524
4,928,616
-
7.22021 separate financial statements and notes
Balance sheet
Assets
(in thousands of euros)
Note
Gross
Amortisation and depreciation
Net 31/12/2021
Net 31/12/2020
Fixed assets
Property, plant and equipment and intangible assets
2,246
1,074
1,172
1,320
Equity interests
4.1
1,032,856
1,032,856
1,032,607
Other financial assets
4.2
2,165
2,165
2,140
Total fixed assets (I)
1,037,267
1,074
1,036,193
1,036,067
Current assets
Trade and other receivables
4.4
713,439
713,439
582,514
Investment securities
4.3
138,344
7
138,337
236,255
Cash
234,243
234,243
344,832
Prepaid expenses
178
178
254
Total current assets (II)
1,086,204
7
1,086,197
1,163,855
Total assets (I + II)
2,123,471
1,081
2,122,390
2,199,922
Equity and liabilities
(in thousands of euros)
Note
31/12/2021
31/12/2020
Equity
Share capital
128,177
129,538
Share premiums
1,547,236
1,593,902
Legal reserve
12,954
12,919
Restricted reserve
1,763
1,763
Other reserves
94,626
94,626
Retained earnings
165,359
10,436
Earnings for the financial year
154,649
336,674
Regulated provisions
1,043
794
Total equity (I)
4.5
2,105,807
2,180,652
Provisions for contingencies and expenses (II)
376
299
Liabilities
Bank loans
441
225
Trade and other payables
847
904
Taxes and social security payables
2,364
2,189
Other liabilities
12,555
15,653
Total liabilities (III)
4.6
16,207
18,971
Equity and liabilities (I + II + III)
2,122,390
2,199,922
-
7.3Other information relating to the separate financial statements
7.3.1Financial results of Rubis SCA over the last five financial years
(in thousands of euros)
2017
2018
2019
2020
2021
Financial position at the end of the financial year
Share capital
117,336
121,017
125,222
129,538
128,177
Number of shares issued
93,868,480
96 813 744
100,177,432
103,630,677
102,541,281
Comprehensive income from transactions carried out
Revenue excluding tax
4,901
5,073
5,670
7,496
2,972
Earnings before tax, depreciation and provisions
129,521
154,187
176,071
324,540
141,930
Income tax
11,093
12,102
8,997
14,211
11,507
Earnings after tax, depreciation and provisions
140,448
165,590
184,739
336,674
154,649
Earnings distributed to associates
169,265
154,522
197,964
181,715
191,175 *
Earnings from operations reduced to a single share (in euros)
Earnings after tax but before depreciation and provisions
1.50
1.72
1.85
3.27
1.50
Earnings after tax, depreciation and provisions
1.50
1.71
1.84
3.25
1.51
Dividend awarded to each share
1.50
1.59
1.75
1.80
1.86*
Workforce
Number of employees
16
16
19
22
21
Total payroll
2,208
2,607
2,261
3,488
3,038
Amount paid in respect of employee benefits
1,117
1,315
1,774
1,933
1,759
* Amount proposed to the Shareholders’ Meeting of 9 June 2022.
-
7.4 Statutory Auditors’ reports
7.4.1 Statutory Auditors’ report on the consolidated financial statements
This is a free translation into English of the Statutory Auditors’ report issued in French and is provided solely for the convenience of English-speaking readers. This report includes information specifically required by European regulations or French law, such as information about the appointment of Statutory Auditors. This report should be read in conjunction with, and construed in accordance with, French law and professional auditing standards applicable in France.
Opinion
In compliance with the engagement entrusted to us by your Shareholders’ Meeting, we have audited the accompanying consolidated financial statements of Rubis for the year ended December 31, 2021.
In our opinion, the consolidated financial statements give a true and fair view of the assets and liabilities and of the financial position of the Group at December 31, 2021 and of the results of its operations for the year then ended in accordance with International Financial Reporting Standards as adopted by the European Union.
The audit opinion expressed above is consistent with our report to the Accounts and Risk Monitoring Committee.
Basis for opinion
Audit framework
We conducted our audit in accordance with professional standards applicable in France. We believe that the audit evidence we have obtained is sufficient and appropriate to provide a basis for our opinion
Our responsibilities under these standards are further described in the “Responsibilities of the Statutory Auditors relating to the audit of the consolidated financial statements” section of our report.
Independence
We conducted our audit engagement in compliance with the independence rules provided for in the French Commercial Code (Code de commerce) and the French Code of Ethics (Code de déontologie) for Statutory Auditors for the period from January 1, 2021 to the date of our report, and, in particular, we did not provide any non-audit services prohibited by Article 5(1) of Regulation (EU) No. 537/2014.
Justification of assessments – Key audit matters
Due to the global crisis related to the Covid-19 pandemic, the financial statements of this period have been prepared and audited under specific conditions. Indeed, this crisis and the exceptional measures taken in the context of the state of sanitary emergency have had numerous consequences for companies, particularly on their operations and their financing, and have led to greater uncertainties on their future prospects. Those measures, such as travel restrictions and remote working, have also had an impact on the companies’ internal organization and the performance of the audits.
It is in this complex and evolving context that, in accordance with the requirements of Articles L. 823-9 and R. 823-7 of the French Commercial Code relating to the justification of our assessments, we inform you of the key audit matters relating to the risks of material misstatement that, in our professional judgment, were the most significant in our audit of the consolidated financial statements, as well as how we addressed those risks.
These matters were addressed as part of our audit of the consolidated financial statements as a whole, and therefore contributed to the opinion we formed as expressed above. We do not provide a separate opinion on specific items of the consolidated financial statements.
Measurement of the recoverable amount of goodwill
(Note 4.2 “Goodwill” to the consolidated financial statements)
Description of risk
How our audit addressed this risk
At December 31, 2021, goodwill was recorded in the balance sheet for a net carrying amount of €1,232 million.
The Group tests goodwill for impairment at least once a year or more frequently if there are indications of impairment. No impairment was recorded in 2021.
An impairment loss is recognized when the recoverable amount falls below the net carrying amount. The recoverable amount is the higher of the value in use, determined on the basis of the discounted expected future cash flows, and the fair value less disposal costs (as described in Note 4.2 “Goodwill” to the consolidated financial statements).
We deemed the measurement of the recoverable amount of goodwill to be a key audit matter given the materiality of the goodwill balance on the balance sheet and the high degree of judgment exercised by management in determining future cash flow forecasts and the main assumptions used.
We examined the methods used by Rubis to carry out impairment tests in line with the accounting standards in force.
We assessed the process for preparing cash flow forecasts used by management to determine the value in use, examined, with the help of our valuation experts, the mathematical models used and verified the correct calculations of those models.
We assessed the reasonableness of the main estimates and, more specifically:
o the consistency of the cash flow forecasts with the business plans drawn up by management. Where applicable, we also compared management’s forecasts with past performance and the market outlook, together with our own analyses;
o the discount rates applied to future cash flows by comparing their inputs with external references, with the help of our valuation experts.
We examined the sensitivity analyses performed by management and performed our own sensitivity calculations on the key assumptions to assess the potential impacts of those assumptions on the results of the impairment tests.
We also assessed the appropriateness of the information presented in Note 4.2 “Goodwill”, to the consolidated financial statements.
Specific verifications
As required by legal and regulatory provisions and in accordance with professional standards applicable in France, we have also performed the specific verifications on the information pertaining to the Group presented in the management report prepared by the Management Board.
We have no matters to report as to its fair presentation and its consistency with the consolidated financial statements.
We attest that the information pertaining to the Group presented in the management report includes the consolidated non-financial performance statement required under Article L. 225-102-1 of the French Commercial Code. However, in accordance with Article L. 823-10 of the French Commercial Code, we have not verified the fair presentation and consistency with the consolidated financial statements of the information given in that statement, which will be the subject of a report by an independent third party.
Other verifications and information pursuant to legal and regulatory requirements
Presentation of the consolidated financial statements to be included in the annual financial report
In accordance with professional standards applicable to the Statutory Auditors’ procedures for annual and consolidated financial statements presented according to the European single electronic reporting format, we have verified that the presentation of the consolidated financial statements to be included in the annual financial report referred to in paragraph I of Article L.451-1-2 of the French Monetary and Financial Code (Code monétaire et financier) and prepared under the Management Board’s responsibility, complies with this format, as defined by European Delegated Regulation No. 2019/815 of December 17, 2018. As it relates to the consolidated financial statements, our work included verifying that the markups in the financial statements comply with the format defined by the aforementioned Regulation.
On the basis of our work, we conclude that the presentation of the consolidated financial statements to be included in the annual financial report complies, in all material respects, with the European single electronic reporting format.
It is not our responsibility to ensure that the consolidated financial statements to be included by the Company in the annual financial report filed with the AMF correspond to those on which we carried out our work.
Appointment of the Statutory Auditors
We were appointed Statutory Auditors of Rubis by the Shareholders’ Meetings held on 30 June 1992 for Mazars and Monnot & Associés and on 11 June 2020 for PricewaterhouseCoopers Audit.
At December 31, 2021, Mazars and Monnot & Associés were in the thirtieth consecutive year of their engagement, of which twenty-seven years since the Company’s securities were admitted to trading on a regulated market, and PricewaterhouseCoopers Audit was in the second consecutive year of its engagement.
Responsibilities of management and those charged with governance for the consolidated financial statements
Management is responsible for preparing consolidated financial statements giving a true and fair view in accordance with International Financial Reporting Standards as adopted by the European Union and for implementing the internal control procedures it deems necessary for the preparation of consolidated financial statements that are free of material misstatement, whether due to fraud or error.
In preparing the consolidated financial statements, management is responsible for assessing the Company’s ability to continue as a going concern, disclosing, as applicable, matters related to going concern, and using the going concern basis of accounting, unless it expects to liquidate the Company or to cease operations.
The Accounts and Risk Monitoring Committee is responsible for monitoring the financial reporting process and the effectiveness of internal control and risk management systems, as well as, where applicable, any internal audit systems, relating to accounting and financial reporting procedures.
Responsibilities of the Statutory Auditors relating to the audit of the consolidated financial statements
Objective and audit approach
Our role is to issue a report on the consolidated financial statements. Our objective is to obtain reasonable assurance about whether the consolidated financial statements as a whole are free of material misstatement. Reasonable assurance is a high level of assurance, but is not a guarantee that an audit conducted in accordance with professional standards will always detect a material misstatement when it exists. Misstatements can arise from fraud or error and are considered material if, individually or in the aggregate, they could reasonably be expected to influence the economic decisions taken by users on the basis of these consolidated financial statements.
As specified in Article L. 823-10-1 of the French Commercial Code, our audit does not include assurance on the viability or quality of the Company’s management.
As part of an audit conducted in accordance with professional standards applicable in France, the Statutory Auditors exercise professional judgment throughout the audit. They also:
- •identify and assess the risks of material misstatement in the consolidated financial statements, whether due to fraud or error, design and perform audit procedures in response to those risks, and obtain audit evidence considered to be sufficient and appropriate to provide a basis for their opinion. The risk of not detecting a material misstatement resulting from fraud is higher than for one resulting from error, as fraud may involve collusion, forgery, intentional omissions, misrepresentations, or the override of internal control;
- •obtain an understanding of the internal control procedures relevant to the audit in order to design audit procedures that are appropriate in the circumstances, but not for the purpose of expressing an opinion on the effectiveness of the internal control;
- •evaluate the appropriateness of accounting policies used and the reasonableness of accounting estimates made by management and the related disclosures in the notes to the consolidated financial statements;
- •assess the appropriateness of management’s use of the going concern basis of accounting and, based on the audit evidence obtained, whether a material uncertainty exists related to events or conditions that may cast significant doubt on the Company’s ability to continue as a going concern. This assessment is based on the audit evidence obtained up to the date of the audit report. However, future events or conditions may cause the Company to cease to continue as a going concern. If the Statutory Auditors conclude that a material uncertainty exists, they are required to draw attention in the audit report to the related disclosures in the consolidated financial statements or, if such disclosures are not provided or are inadequate, to issue a qualified opinion or a disclaimer of opinion;
- •evaluate the overall presentation of the consolidated financial statements and assess whether these statements represent the underlying transactions and events in a manner that achieves fair presentation;
- •obtain sufficient appropriate audit evidence regarding the financial information of the entities or business activities within the Group to express an opinion on the consolidated financial statements. The Statutory Auditors are responsible for the management, supervision and performance of the audit of the consolidated financial statements and for the opinion expressed thereon.
Report to the Accounts and Risk Monitoring Committee
We submit a report to the Accounts and Risk Monitoring Committee which includes, in particular, a description of the scope of the audit and the audit program implemented, as well as the results of our audit. We also report any significant deficiencies in internal control that we have identified regarding the accounting and financial reporting procedures.
Our report to the Accounts and Risk Monitoring Committee includes the risks of material misstatement that, in our professional judgment, were the most significant for the audit of the consolidated financial statements and which constitute the key audit matters that we are required to describe in this report.
We also provide the Accounts and Risk Monitoring Committee with the declaration provided for in Article 6 of Regulation (EU) No. 537/2014, confirming our independence within the meaning of the rules applicable in France, as defined in particular in Articles L. 822-10 to L. 822-14 of the French Commercial Code and in the French Code of Ethics for Statutory Auditors. Where appropriate, we discuss any risks to our independence and the related safeguard measures with the Accounts and Risk Monitoring Committee.
-
Additional information
-
8.2Incorporation by reference
In accordance with Article 19 of Regulation (EU) 2017/1129 of 14 June 2017, the following information is included by reference in this Universal Registration Document:
- •the consolidated financial statements for the financial year ended 31 December 2020 and the corresponding Statutory Auditors’ report are included in the 2020 Universal Registration Document filed with the French Financial Market Authority (Autorité des Marchés Financiers – AMF) on 29 April 2021, under number D. 21-0392, pages 206 to 259 and pages 273 to 276;
- •the consolidated financial statements for the financial year ended 31 December 2019 and the corresponding Statutory Auditors’ report are included in the 2019 Universal Registration Document filed with the French Financial Market Authority (Autorité des Marchés Financiers – AMF) on 29 April 2020, under number D. 20-0398, on pages 216 to 269 and pages 284 to 287.
-
8.3Cross-reference table for the Universal Registration Document
The cross-reference table below shows the headings provided for in Annexes I and II of Delegated Regulation (EU) 2019/980 of 14 March 2019 supplementing Regulation (EU) 2017/1129 of 14 June 2017 and provides references to the pages on which the relevant information appears in this Universal Registration Document.
Headings of Annexes I and II of Delegated Regulation (EU) 2019/980
of 14 March 2019Chapter
Page
1
Persons responsible, third party information, experts’ reports and competent authority approval
1.1
Name and position of responsible officers
8.1
312
1.2
Declaration of responsible officers
8.1
312
1.3
Name, address, qualifications and material interests of persons acting as experts
NA
NA
1.4
Confirmation relating to third-party information
NA
NA
1.5
Declaration of filing with the competent authority
-
1
2
Statutory Auditors
8.1
313
3
Risk factors
3.1
48 to 63
4
Information about the issuer
4.1
Legal and commercial name
6.6
227
4.2
Place of registration, registration number and legal entity identifier (LEI)
6.6
227
4.3
Date of formation and duration
6.1.4
199
4.4
Domicile, legal form, applicable legislation, country of incorporation, address and telephone number of registered office, website
6.1 - 6.6
198 - 227
5
Business overview
5.1
Principal activities
1
22 to 31
5.2
Principal markets
1
8 to 11
5.3
Important events in the development of the business
2.1 to 2.3 - 7.1
36 to 45 - 239 to 240
5.4
Strategy and objectives
1 - 2.1
8 to 11 - 36 to 45
5.5
Dependence on patents or licenses, industrial, commercial or financial contracts, or new manufacturing processes
NA
NA
5.6
Competitive position
1
10
5.7
Investments
2.1
36 to 44
5.7.1
Material historical investments
2.1 - 7.1
36 to 45 - 239 to 240
5.7.2
Material current investments
2.1
36 to 44
5.7.3
Joint ventures and undertakings in which the issuer holds a proportion of the capital likely to have a significant effect on the assessment of its own assets and liabilities, financial position or profits and losses
7.1
276 to 279
5.7.4
Environmental issues liable to affect the use of tangible fixed assets
4.2.2
86 to 104
6
Organisational structure
6.1
Brief description of the Group
1
6 to 33
6.2
List of significant subsidiaries
1 - 7.1
32 to 33 - 282 to 284
7
Operating and financial review
7.1
Financial position
2.1 - 7.1
36 to 44 - 230 to 284
7.1.1
Development and performance of the issuer’s business and of its position
7.3.1
299
7.2
Gross operating profit (EBITDA)
1 - 2.1 - 7.1
19 - 36 - 232
7.2.1
Information regarding significant factors materially affecting the issuer’s income from operations
2.1
36 to 44
7.2.2
Reasons for any material changes in net sales or revenues disclosed by historical financial information
2.1 - 3.1
36 to 44 - 48 to 63
8
Cash and capital
8.1
Information on equity
7.1
251 to 252
8.2
Source, amount and description of cash flows
2.1 - 7.1
37 - 235 to 236
8.3
Information on borrowing requirements and funding structure
2.1 - 7.1
37 - 255 to 260
8.4
Restrictions on the use of capital resources that have or could have a material effect on the issuer’s operations
NA
NA
8.5
Anticipated financing sources for material investments planned, and major expenses on the most material property, plant and equipment
2.1 - 7.1
36 to 44 - 240 to 242
9
Regulatory environment
3.1.2.3
58 to 60
10
Trend information
2.2 - 2.3
45
11
Profit forecasts or estimates
NA
NA
12
Management and Supervisory bodies
12.1
Information on members of the Management and Supervisory bodies
5.2 – 5.3
149 to 163
12.2
Conflicts of interest, commitments relating to appointments, restrictions on the disposal of investments in the issuer’s share capital
5.5
193 to 194
13
Compensation and benefits of Management and Supervisory bodies
13.1
Compensation paid and benefits in kind
5.4.4
178 to 192
13.2
Amounts set aside or accrued for pension, retirement or similar benefits
7.1
262 to 264
14
Functioning of Management and Supervisory bodies
14.1
Date of expiration of current term of office and period served
5.3.1
153
14.2
Service contracts linking members of the Supervisory Board
5.5
193
14.3
Information on Committees
5.3.2
153 - 168 to 172
14.4
Statement of compliance with the corporate governance regime in effect in France
5.1
148
14.5
Potential material impacts on the corporate governance
NA
NA
15
Employees
15.1
Headcount
4.4 - 7.1
115 - 267
15.2
Shareholdings and stock options
6.2.2 - 6.4 - 6.5 - 7.1
204 - 214 to 226 - 252 to 254
15.3
Agreements providing for employee shareholding
4.4.4 - 6.4 - 7.1
125 - 214 - 252 to 254
16
Major shareholders
16.1
Shareholders holding notifiable interests in the share capital or voting rights
6.2.2
204
16.2
Voting rights of major shareholders exceeding their share of share capital
NA
NA
17
Related-party transactions
5.5 - 7.1
183 - 280
18
Financial information concerning the issuer’s assets and liabilities, financial position, and profits and losses
18.1
Historical financial information
7.3.1
299
18.2
Interim and other financial information
NA
NA
18.3
Audit of historical annual financial information
7.4
301 to 309
18.4
Pro forma financial information
NA
NA
18.5
Dividend policy
6.3
213 to 214
18.6
Legal and arbitration proceedings
3.1.2.3 - 3.1.2.4
58 to 63
18.7
Significant change in the issuer’s financial position
NA
NA
19
Additional information
19.1
Share capital
6.2 - 7.2
203 to 213 - 293 to 294
19.1.1
Issued and authorised share capital
6.2 - 7.2
203 to 213 - 293 to 294
19.1.2
Shares not representing share capital
NA
NA
19.1.3
Shares held by the issuer or its subsidiaries
6.2.2 - 6.2.5 - 7.1
204 - 209 to 210 - 251
19.1.4
Securities giving future access to the issuer’s share capital
6.2.6 - 6.5.5
210 - 220
19.1.5
Information about and terms of any acquisition rights and/or obligations over authorised but unissued capital or an undertaking to increase the capital
6.2.5 - 6.5
209 to 210 - 215 to 226
19.1.6
Capital of any member of the Group under option or subject to an agreement
NA
NA
19.1.7
History of the share capital of the issuer
6.2.7 - 7.3.1
211 to 212 - 299
19.2
Memorandum and Articles of Association
6.1.4
199 to 202
19.2.1
Corporate purpose of the issuer
6.1.4
199
19.2.2
Rights, preferences, and restrictions attached to each category of existing shares
6.1.4
181 to 182
19.2.3
By-law provisions, charter or rules of the issuer that may delay, defer or prevent a change of control
NA
NA
20
Material contracts (other than contracts concluded in the normal course of business)
NA
NA
21
Documents available
6.6
226
-
8.4Cross-reference tables for the Annual Financial Report and the management report
8.4.1Cross-reference table for the Annual Financial Report
The Annual Financial Report, prepared in accordance with Article L. 451-1-2 of the French Monetary and Financial Code and Article 222-3 of the General Regulation of the French Financial Market Authority (Autorité des Marchés Financiers), includes the documents, reports and information in this Universal Registration Document as detailed below.
The Management Board presents the draft resolutions that are submitted for vote by the shareholders in a separate document (the Notice of Combined Shareholders’ Meeting to be held on 9 June 2022), as well as their presentation.
Chapter
Page
- •2021 Annual financial statements
7.2
286 to 298
- •2021 Consolidated financial statements
7.1
230 to 284
- •Management report
8.4.2
318 to 319
- •Report on corporate governance, attached to the management report
5 – 6.1.4 – 6.2.4 – 8.4.2
148 to 195 - 201 - 206 to 208 - 318 to 319
- •Non-Financial Information Statement, attached to the management report
4
74 to 145
- •Declaration of persons responsible for the Annual Financial Report
8.1
312
- •Statutory Auditors’ report on the annual financial statements
7.4.2
304 to 307
- •Statutory Auditors’ report on the consolidated financial statements
7.4.1
301 to 304