URD 2024
-
MESSAGE
Faced with demographic growth and climate challenges, in a world where energy needs are constantly growing, the Rubis Group has a unique model. Based on an entrepreneurial mindset that gives it all the agility it needs, the Group is constantly adapting to:
- provide energy and mobility solutions in more than 40 countries;
- guarantee reliable and sustainable access that meets the needs of each region;
- develop low-carbon solutions to promote the energy transition.
We are proud of our contribution in the countries where we operate: we support social and economic development, we guarantee the security of supply and we promote innovative energy and mobility solutions, thus contributing to the development of economies, communities, businesses and people.
The Group recorded solid results in 2024, driven by Energy Distribution, with volume growth in all segments and strong momentum in the Caribbean. Despite a volatile macroeconomic environment, operating income was close to our record high of 2023, with EBITDA of €721 million. It is also worth highlighting the exceptional level of operating cash flow, which increased by 18% to €665 million. In the midst of short-term uncertainties, our model has demonstrated its resilience while optimising its ability to seize opportunities that arise in our business lines.
In the Caribbean, Rubis’ remarkable performance was once again confirmed, particularly through our service station network and aviation fuel sales.
In Africa, growth continued with significant market share gains, despite high financing costs and still significant currency fluctuations.
In Europe, in a shrinking market, sales of liquefied gases exceeded the figures reached in 2023. The photovoltaic energy market experienced significant growth, with Rubis Photosol’s secured portfolio reaching 1.1 GWp, including 523 MWp in operation in France. This development was marked in particular by the start of construction of the photovoltaic park on the former Creil airbase, the first tranche of which was commissioned in February 2025. When completed in 2026, this site will be able to produce the equivalent of the annual electricity consumption of around 85,000 homes.
Finally, we sold our stake in Rubis Terminal enabling the payment of an exceptional interim dividend, in line with our strategy of diversification and value creation for our shareholders.
“The results achieved in 2024 reflect the commitment of all our employees who work every day to guarantee an exceptional quality of service.
We are convinced that our unique approach will continue to make us a leading player in meeting the daily needs of the communities we serve.”
Key measures have been taken, starting with the proposed appointment(1) of two new Managing Partners, Jean-Christian Bergeron and Marc Jacquot, who will bring their complementary experience and expertise. This development is part of the succession process for the two founders of Rubis, Gilles Gobin and Jacques Riou, who will step down from the Management Board after the 2027 Shareholders’ Meeting.
In addition, the Supervisory Board initiated several months of work with the Management Board, which resulted in a strengthening of its missions. Thus, the internal rules of the Board and its Committees have been updated to include the requirement for a prior opinion of the Supervisory Board on major or strategic transactions, and to formalise annual strategic and budgetary information.
Over the last five years, Energy Distribution has recorded solid volume growth of 5% on average per year. These results illustrate the richness of the current pool and the potential for future growth. Population growth, economic development and the increasing need for energy and infrastructure are all growth drivers for the Group which is pursuing its diversification to keep pace with changing needs.
Building on this momentum, we launched new solar offers for our business customers in our three regions, some of which in partnership with Rubis Photosol.
The latter is maintaining its growth momentum with the aim of achieving significant commercial development in the coming years. We aim to have a total of 2.5 GWp in the secured portfolio by 2027 and to continue our expansion, particularly in Eastern Europe.
Lastly, and above all, the results achieved in 2024 are the result of the commitment of all our employees who work every day to guarantee an exceptional quality of service. We are convinced that our unique approach will continue to make us a leading player in meeting the daily needs of the communities we serve.
We would also like to thank our shareholders for their trust; it gives us the ambition and determination to pursue our growth.
The involvement, talent and collaborative spirit of our teams made it possible to exceed the objectives we had set for ourselves for 2024, and we are very grateful to them.
The Managing Partners would also like to thank the shareholders for their loyalty and the confidence they have placed in the long-term strategy we are implementing.
Locally anchored in Africa, the Caribbean and Europe, Rubis markets a wide range of energy and mobility solutions. From LPG to bitumen, transportation fuel to renewable electricity, the Group operates in highly diversified markets by adapting to local needs. Rubis builds on the expertise and commitment of its 4,375 employees working in 44 countries to provide critical goods and services that meet the highest international standards. Since 1990, we have combined vision, agility and financial rigour to build a sustainable growth model.
-
1 PRESENTATION OF THE GROUP
-
OVERVIEW OF ACTIVITIES
- Retail & Marketing: distribution of energy solutions, mainly fuels, liquefied gas and, in Africa only, bitumen;
- Support & Services: logistics including trading-supply, shipping and refining (SARA).
- product purchase – a key player in raw materials markets;
- transport – use of fully owned and time-chartered vessels;
- storage – owning import terminals in its locations;
- distribution – cylinder filling plants (liquefied gas), network of 1,143 service stations, refuelling operations in more than 20 airports.
ENERGY DISTRIBUTION
Our Energy Distribution division places customers at the heart of its strategy. In a constantly changing sector, we are adapting our offerings and services to meet the specific requirements of each customer segment, whether retail customers or professionals in the transport, hotel, poultry farming and other industries. We are developing more flexible energy solutions and continuously improving the customer experience, thanks in particular to new technologies.
Our mastery of the supply chain enables us to guarantee a reliable and efficient service, ensuring a continuous distribution of energy. This expertise helps us optimise our flows, anticipate demand and secure supply, whatever the market conditions.
This activity benefits from both geographic and product segment diversification, ensuring stable and resilient performance, little affected by geopolitics and economic cycles.
For two years, we have diversified our offerings around three key themes to meet the challenges of the energy transition. Firstly, we have enriched our mobility-related services, by proposing solutions adapted to new modes of transport and the changing needs of our customers.
Next, we have broadened our biofuels offering. These fuels, from renewable raw materials such as plant oils, agricultural residue or organic waste, represent a more environmentally-friendly alternative to traditional fossil fuels. Lastly, we have introduced solar or hybrid offerings that integrate a share of solar electricity, to propose energy solutions that are both high-performance and sustainable to our customers.
Rubis distributes fuels and liquefied gas (network of 645 service stations) as well as bitumen in West Africa. The Group’s African entities are in the top 3(1) in most countries, across all market segments.
In the distribution of fuels and liquefied gas, the main competitors in this region are Puma, TotalEnergies, and Vivo Energy, as well as local independent players. In bitumen distribution, Rubis is the leader in all its markets, and competition is local.
To adapt to consumers’ new expectations, our service stations are becoming multifunctional centres offering convenience stores, restaurant services, car washing, etc.
We are partnering with renowned players to propose the best services and increase the footfall, volumes and margins of the service stations.
Liquefied gas represents a transitional alternative for a third of the world’s population, who cook with wood, paraffin and coal, generating harmful domestic air pollution. The use of this fuel is being promoted by the International Energy Agency and the governments of South Africa, Madagascar and Kenya, which are investing in dedicated infrastructure (storage depots in particular) and setting an example by launching programmes to refurbish administrative facilities in favour of liquefied gas.
The need for road infrastructure continues to grow in the region. Present in three countries when it entered this sector (in 2015, with the acquisition of Eres), the Group now operates in nine countries, with over 100,000 tonnes of storage capacity to guarantee a reliable supply to its customers.
Rubis distributes fuels and liquefied gas in 19 territories (412 service stations) and controls the entire supply chain. The Group is in the top 3(1) in most countries, across all market segments. The main competitors in this region are Parkland (Sol) and TotalEnergies, as well as independent local players.
To meet the needs of businesses, Rubis continues to develop its commercial activity in high-potential markets, such as Suriname and Guyana.
Rubis is expanding its service station offer to include convenience stores, restaurant services, car washing, etc. The Group has also deployed a new charging station offering in the French Antilles, V-City, to support the development of electric mobility.
In collaboration with the Renewable Electricity Production division in the French Antilles or in partnership with Soleco Energy in the English-speaking Caribbean, the Group offers solar installations for its professional customers. The objective is to develop both rooftop and ground-mounted facilities to facilitate our customers’ energy transition.
In Europe, Rubis mainly distributes liquefied gas to residential (nearly two-thirds) and professional customers. This segment represents 73% of the region’s volumes. In Corsica and the Channel Islands, Rubis distributes fuels through a network of 86 service stations, and offers aviation and marine fuels. In its operations, the Group is in the top 3(1) in the market, faced with competitors such as Cepsa, DCC, Galp, Repsol, SHV and UGI.
The Group distributes autogas in France, Spain, Switzerland and Portugal. This alternative to conventional fuels produces less CO2 and almost no particles. The market is continuing to grow with volumes up by 13% compared to 2023(2).
Rubis distributes biofuels, such as HVO (biofuel made from used oils that reduces CO2 emissions by 90% compared to the use of conventional diesel) or EcoHeat100, a 100%-renewable domestic fuel.
The Group supports its customers in their energy transition by expanding its offering with solar projects for professionals or hybrid offerings combining liquefied gas and solar panels, notably for domestic customers.
Support & Services brings together supply and shipping activities for products marketed by the Group and SARA’s refining and storage activity.
Rubis operates 17 vessels to handle its shipping operations. Ten of these are owned by the Group (five bitumen tankers, three fuel tankers and two liquefied gas vessels). The others are time-chartered.
In this context, to meet the decarbonisation targets of the United Nations and the CO2 emissions reduction targets set in the Group’s CSR Roadmap Think Tomorrow 2022-2025, our subsidiary Rubis Énergie is a member of the Sea Cargo Charter, an initiative to promote responsible, transparent and efficient shipping.
The refinery of the Antilles (SARA), 71%-owned by the Group, is located in Martinique and exclusively supplies fuel to the three French departments in the Caribbean region. The retail prices for products and the profitability of SARA are regulated by the public authorities through a decree. It has a production capacity of 800,000 tonnes per year and produces a full range of products complying with European environmental standards: fuels for land, air and maritime mobility, liquefied gas, etc. SARA wants to go further and is positioning itself as both a producer and supplier of low-carbon fuels, such as hydrogen and biofuels.
-
2 ACTIVITY REPORT
-
2.1 Activity report for the 2024 financial year
In a complex and volatile global environment, the Group once again demonstrated its resilience and generated net income on a like-for-like basis down slightly (-5%).
The multi-country and multi-segment positioning of the Energy Distribution division as well as its dual midstream/downstream structure have enabled it to absorb any type of external shock and to record volume growth of 5%. The Renewable Electricity Production division, driven by deployments in the photovoltaic sector, accelerated its development plan in accordance with the Photosol Day announcements in September 2024, increasing its portfolio of secured projects by 22% to 1.1 GWp. Lastly, the financial year saw the disposal of the 55% stake held in the Rubis Terminal JV, generating a net capital gain of €83 million.
(in millions of euros) 2024 2023 2024 vs 2023 Revenue 6,644 6,630 0% Gross operating profit (EBITDA) 721 798 -10% Gross operating profit (EBITDA) on a comparable basis(1) 723 742 -3% EBIT, of which 504 621 -19% • Energy Distribution 549 647 -15% • Renewable Electricity Production (8) 4 -307% Net income, Group share 342 354 -3% Net income, Group share – on a like-for-like basis(2) 314 329 -5% Diluted earnings per share (in euros) 3.30 3.42 -4% Dividend per share (in euros) 2.03(3) 1.98 +2.5% Cash flow before cost of net financial debt and tax 697 725 -4% Capital expenditure, of which 248 283 • Energy Distribution 165 206 • Renewable Electricity Production 82 77 Free cash flow(4) 320 198 +61% - Excluding hyperinflation, IFRS2, Nigeria and Madagascar 2023 adjustments and other non-recurrent items.
- As (1) plus: adjustments for the impact of Pillar 2 tax and gain on the disposal of Rubis Terminal.
- Authorisation proposed to the Shareholders’ Meeting of 12 June 2025. The total amount of the proposed dividend will be €2.78 per share, of which €2.03 for the annual ordinary dividend and €0.75 corresponding to the exceptional payment of the interim dividend paid on 8 November 2024.
- Corresponding to cash flows from operations, less capital expenditure and net financial interest paid (including that of the holding company).
The Group’s financial position at the end of the financial year was strengthened with a ratio of net debt to EBITDA of 1.9x (excluding IFRS 16) and representing 35% of equity. In addition, it should be noted that the items of balance sheet assets “Other long-term assets” and “Trade and other receivables” include, respectively, €174 million and €87 million in receivables corresponding to deferred payments (over the period October 2025 to October 2027) from the disposal of the 55% held in the Rubis Terminal joint venture, bearing interest and including from a first demand guarantee.
While cash flow was down by €28 million (-4%), the generation of €39 million in cash due to the change in working capital (compared with the consumption of €92 million in cash in 2023 similarly from changes in working capital) contributed significantly to the overall improvement of the Group’s financial position. This change is strengthened by a €35 million decrease in investments, after a 2023 financial year which had seen significant investments in vessels. Free cash flow reached €320 million, up sharply compared to 2023, evidence of the good quality of the results.
(in millions of euros) Net financial debt (excluding lease liabilities) as of 31 December 2023 (1,360) Cash flow before cost of net financial debt and tax 697 Change in working capital requirement 39 Income tax paid (71) Net financial interest paid (97) Retail & Marketing investments (165) Renewable Electricity Production investments (82) Dividends paid to shareholders and non-controlling interests (295) Net disposals (acquisitions) of financial assets 103 Photosol - Entry of non-controlling interests and changes in debt related to the put on non-controlling interests 1 Other investment flows with joint ventures (mainly dividends received) 6 Change in loans, guarantee deposits and advances 13 Other flows of which lease liabilities (38) Increase in equity 9 Share buyback (capital decrease) (25) Impact of changes in scope of consolidation and exchange rates (27) Net financial debt (excluding lease liabilities) as of 31 December 2024 (1,292) The Energy Distribution division includes, on the one hand, the Retail & Marketing fuel distribution activity (service station networks, liquefied gas, bitumen, commercial heating oil, aviation and marine fuel and lubricants) in the three regions (Europe, Caribbean, Africa), and on the other hand, the Support & Services activity, bringing together the activities upstream of Retail & Marketing: refining, supply, trading, shipping and logistics.
ULSD prices continued their downward trend in the second half (-12%), following on from the first half of the year (-9%), compared to the second half of 2023, to stand at US $678/t in December 2024.
Generally speaking, Rubis is positioned in markets that enable it to transfer price volatility to the end customer (system of free or regulated prices) and thus maintain relative stability of its margins over a long period. The record prices of 2022 (US $1,053/t in H2 2022) led the governments of Kenya and Madagascar to temporarily exit the pricing structure, while at the same time setting up a subsidy mechanism for distributors. The lull in prices in 2023 and 2024 gradually ended these measures and the governments, both in Kenya and Madagascar, have respected their obligations to oil distributors.
The fact remains that extreme volatility in currencies such as the Kenyan shilling and the Nigerian naira disrupted balances, generating material translation differences in the Group’s financial statements in 2022 (-€84 million) and 2023 (-€105 million), reduced to -€47 million in 2024.
ULSD prices are down by 10% on average over 2024, producing average unit margins down by 4%. This decline can be explained by the exceptional situation in Kenya: the product mix, evolved unfavourably due to the sharp increase in aviation volumes, achieved with structurally lower unit margins, and negative inventory effects, linked to the appreciation of the currency. Excluding these items, the unit margin was up 1%, in line with the drop in supply prices.
Operating through its 31 locations, the division sold 6 million m3 over the period in final distribution (+5%). Good growth was noted in aviation (+25%) and bitumen (+10%).
In 2024, these volumes were spread across the three regions – Europe (15%), the Caribbean (38%) and Africa (47%) –offering the Group valuable diversity in terms of climate, economy (emerging countries and developed economies) and by type of end use (residential, transport, industry, utilities, aviation, marine, lubricants).
Volumes/margins by product category break down as follows: 36/29% for service station networks, 35/24% for all other fuels (aviation/commercial heating oil, non-road diesel, lubricants, naphtha), 22/38% for LPG and 7/9% for bitumen.
Gross sales profit reached €815 million, stable compared to 2023 (€806 million after adjustment for Nigeria and Madagascar).
Operating aggregates EBITDA and EBIT decreased by 12% and 20% respectively in 2024, to -5% and -12% respectively, adjusted for inflated margins in Nigeria of €31.6 million and a repayment of foregone profit of €11.3 million received in Madagascar in 2023 for 2022.
Europe, mainly positioned in LPG distribution, posted volumes up by 6% for stable winter temperatures compared to 2023 (source: Météo France).
The Caribbean repeated its good performance in volumes (excluding Haiti): +6% in 2024 (after +5% in 2023) driven by the good momentum of the tourism sector with its effects on aviation volumes (+10%) and networks (+5%).
Finally, Africa posted good performance in terms of volumes (+8%), with network volumes up 5% and a surge in aviation volumes in Kenya (+42%).
Investments totalled €144 million over the financial year, spread across the 27 operating subsidiaries. They covered recurring investments in service stations, terminals, tanks, cylinders and customer facilities, aimed principally at supporting market share growth, as well as investments in facility maintenance.
The Europe region has the Group’s strongest LPG positioning: nearly 50% of the Group’s volumes are marketed there and LPG represents three-quarters of the region’s volumes, with two-thirds of its customer base estimated to be residential.
Volumes grew 6% over the full financial year, with stable unit margins at a high level, ensuring a 6% increase in the EBITDA contribution.
LPG in France continued to be driven by favourable momentum, with market share gains in its historical segment (small bulk propane: +9%) and strong demand for Autogas (+16%).
French Antilles and French Guiana – Bermuda – Eastern Caribbean – Jamaica – Haiti – Western Caribbean – Guyana – Suriname
A total of 19 facilities distribute fuel locally (over 400 service stations, aviation, commercial, LPG, lubricants and bitumen).
In the English-speaking Caribbean, the region’s biggest contributor in terms of EBITDA (55%), demand for petroleum products continued to benefit from strong tourism and impressive economic growth in Guyana (44%), favouring the good performance of volumes (+19% in the Eastern Caribbean region). The decline in oil prices per barrel in the second half of the year helped to support the increase in unit margins.
Also of note is the strong growth in contributions from Jamaica and the Cayman Islands, while the French West Indies and the Bahamas (withdrawal of volumes and margins in aviation in particular) recorded a decline.
The situation in Haiti remains chaotic and uncertain (volumes: -18%, EBIT: -20%), the start of the international force deployment in charge of maintaining order has not had the expected result to date. The subsidiary is keeping its costs and investments at minimum levels.
Fuel and LPG: South Africa – Botswana – Burundi – Djibouti – Eswatini – Ethiopia – Kenya – Réunion Island – Madagascar – Morocco – Uganda – Rwanda – Zambia – Zimbabwe
- good growth in network sales, +4%, driven by Madagascar, Ethiopia and Rwanda. Volumes in Kenya returned to normal with the end of the rebranding programme and of the commercial aggressiveness of small network operators in a complex macroeconomic context;
- a strong increase of aviation volumes in Kenya.
EBITDA and EBIT aggregates were down sharply in 2024: by 26% and 37% respectively after adjusting for a repayment of €11.3 million obtained in Madagascar in 2023 for 2022.
This decline is due to a deterioration in the unit margin in the network in Kenya and in BtoB volumes in Kenya and Madagascar.
While the Africa unit margin was down by 21%, half of the decline was due to the very strong increase in aviation volumes in Kenya (+42%), which achieved unit margins that were structurally lower than the other segments.
Bitumen (Retail & Marketing and Support & Services): South Africa – Angola – Cameroon – Gabon – Guinea – Liberia –Nigeria – Senegal – Togo and sub-region
RESULTS OF THE BITUMEN AFRICA BUSINESS AS OF 31 DECEMBER 2024 (RETAIL & MARKETING AND SUPPORT & SERVICES)
The 2024 financial year saw a 10% increase in customer volumes, mainly driven by South Africa, Cameroon and Guinea, while the historical market in Nigeria was disrupted by competition from cement roads.
It should be noted that in 2023, EBITDA and EBIT had benefited from the Nigerian subsidiary’s ability to include the exchange rate differential between the official rate and the market rate in its prices to customers, representing an amount of €31.6 million. This mechanism no longer applies in 2024 since the official exchange rate is aligned with the market rate. Adjusted EBITDA and EBIT thus show respective declines of 6% and 10% in 2024 vs 2023.
As anticipated, in the 2024 financial year, there will be a return to an almost normalised exchange rate situation in Nigeria, with the foreign exchange loss going from -€67 million in 2023 to -€12 million.
At the same time, upstream (trading) suffered from a lack of opportunities in the US/Canada markets, reducing supply operations in this region from the Mediterranean and resulting in a 30% decline in trading volumes.
This activity includes the Retail & Marketing division’s supply tools for petroleum products and bitumen:
- the 71% equity interest in the refinery in the French Antilles (SARA);
- the trading-supply activity, active in white products in the Caribbean (Barbados) and especially in bitumen in the Africa/Middle East region with an operational head office in Dubai;
- in support-logistics, the shipping activity (17 vessels) active in bitumen and white products in the Caribbean and “storage and pipe” activity in Madagascar.
The results of the SARA refinery, even though regulated by a formula guaranteeing a 9% return on equity, recorded the effects of accounting reclassifications between EBITDA and provisions (for major works) explaining the EBIT change (+21%).
The contribution of the Support & Services activity (excluding SARA) was down by 10% to €121 million mainly reflecting the decrease in trading in bitumen (described above), whilst activity remained at a good level in the Caribbean region and Madagascar.
(in millions of euros) 2024 2023 2024 vs 2023 Installed capacity (in MWp) 523 435 +20% Electricity production (in GWh) 460 472 -2.5% Revenue 49 49 0% EBITDA 26 29 -11% Cash flow before cost of net financial debt and tax 23 22 +2% Investments 82 77 Net financial debt 567 507 of which SPV gross financial debt 431 334 - 1,087 MWp of secured capacity (compared to 893 MWp at end December 2023, i.e., +22%), including capacity in operation (523 MWp vs 435 MWp) and capacity under construction or awarded (564 MWp vs 458 MWp);
- a pipeline of projects under development of 5.4 GWp compared to 4.3 GWp, an increase of 25%.
Despite administrative delays in the granting of building permits and network connections, the volume of activity accelerated. In 2024, Photosol filed for 650 MWp of building permits and 250 MWp were obtained during the year. It should be noted that the success rate for building permits on first request is more than 80%.
Ten facilities are currently under construction, including the Creil plant, which will be the second largest ground-mounted photovoltaic park in France. No construction delays have been observed to date. Creil’s first megawatts were commissioned in February 2025 and all remaining megawatts will be commissioned in stages over 2025 and the beginning of 2026.
- in Italy: the construction of 44 MWp began following the awarding of the first national agrivoltaic call for tenders (PNRR, equivalent to French CRE calls for tenders) with a secure price over 20 years. 150 MWp of additional projects were in preminary development at the end of 2024;
- in Eastern Europe (Bulgaria, Romania, Poland): 242 MWp of projects are in the advanced development phase through DSAs (Development Service Agreements);
- in Spain: 440 MWp of projects entered the qualified pipeline (land is secured but the connection is not) mainly in the north of the country, a region with a shortage of photovoltaic projects.
The 2027 ambition was announced during the investors’ day dedicated to Photosol on 17 September 2024:
- secured portfolio exceeding 2.5 GWp;
- consolidated EBITDA of €50-55 million, including contribution of around 10% of EBITDA from farm-down initiatives:
The definitive disposal of Rubis Terminal (renamed Tepsa) took place in October 2024, generating a net capital gain of €83 million in the Group’s financial statements. An exceptional interim dividend of €77 million was paid in early November 2024.
31/12/2024 31/12/2023 2024 vs 2023 EBITDA (reported) 721 798 -10% Hyperinflation (24) (22) EBITDA (reported) excluding hyperinflation 697 776 -10% Pass-through of the naira exchange rate impact (32) Repayments of shortfalls in Madagascar (11) Miscellaneous impacts on compensation (including IFRS 2) 21 9 Other 5 EBITDA (on a comparable basis) 723 742 -3% -
3 RISK FACTORS, INTERNAL CONTROL AND INSURANCE
The diversity of the activities and products handled exposes the Group to identified risks, which are regularly updated and rigorously monitored in order to mitigate them as much as possible, in compliance with applicable regulations, international standards and best professional practices.
Rubis has identified 15 risk factors related to its activities, considered significant and specific, divided into four categories (section 3.1).
-
3.1 Risk factors
3.1.1 Introduction
Using mapping techniques, Rubis annually reviews financial, legal, commercial, technological and maritime risks liable to have a material adverse effect on its business and financial position, including its results, reputation and outlook. In addition to this risk mapping, the departments concerned review the risks in order to select those to be presented in this chapter, which are then presented to the Audit and CSR Committee.
Only those risks deemed specific to the Group and important for investors to know of as of the date of this document are described in this chapter. Investors are invited to consider all of the information contained in this document. Other risks, not identified at the date of this Universal Registration Document or whose occurrence is not considered likely to have a material adverse effect on the business, financial position and the results of Rubis, its outlook, its development and/or on the price of Rubis shares, may exist or occur.
- industrial and environmental risks;
- risks related to the external environment;
- legal and regulatory risks;
- financial risks.
These categories are not presented in order of importance. Within each category, the risk factor with the greatest impact as of the date of the risk assessment is presented first.
It is specified that the results of the double materiality analysis carried out as part of the preparation of the Group’s Sustainability Statement are presented in chapter 4. The assessment of the impacts, risks and opportunities that must be reported in the Sustainability Statement is subject to a process separate from risk mapping. However, the two processes are interconnected: the risk mapping was taken into account as part of the double materiality analysis and the risk factors were reviewed to ensure their consistency with the results of the double materiality analysis (chapter 4). References are made to chapter 4 “Sustainability statement”, which deals in detail with the Group’s management of environmental, social and governance impacts and risks (business ethics section).
The description of Rubis’ main risk factors (see below) presents the possible consequences in the event the risk does materialise and provides examples of measures implemented to reduce such consequences. The level of risk assessment presented is relative, i.e., it makes it possible to measure the importance (impact/probability) of the risks presented in this document in relation to each other and not in relation to similar risks presented by other issuers. Thus, the highest level of risks presented in this document does not necessarily correspond to the highest level of risks of other operators.
Category Risk Probability Impact Risks related to product transport ● Maritime transport 

● Road transport Risks of a major accident in industrial facilities Industrial and environmental risks Risks of a major accident in distribution facilities Risks related to information systems Risks related to the development of photovoltaic park projects Risks related to the external environment Country and geopolitical environment risks Climate risks Risks related to changes in the competitive environment Legal and regulatory risks Risks related to a significant change in regulations Ethics and non-compliance risks Legal risks Foreign exchange risk Risk of fluctuations in product prices Financial risks Risks related to acquisitions -
3.2 Internal control
3.2.1 Internal control and risk management system
- the reference framework relating to risk management and internal control systems issued by the French Financial Markets Authority (Autorité des Marchés Financiers) of 22 July 2010, adapted as required by the Group’s business and specific characteristics; and
- the disclosure requirements of ESRS 2 GOV-5 (risk management and internal control over sustainability reporting) of Directive (EU) 2022/2464 on the disclosure of sustainability information by companies (known as the CSRD directive).
- compliance of the Group’s activities with applicable laws and regulations;
- the effective application of the instructions and guidelines defined by the bodies of Rubis SCA and its subsidiaries;
- an existing process to identify the main risks associated with the Company’s business;
- the effectiveness of the Group’s internal processes; and
- the reliability of financial and sustainability information.
Like any risk management and internal control system, the system put in place by Rubis cannot be an absolute guarantee of the Group’s ability to achieve its objectives and eliminate all risks.
This section describes the risk management and internal control system applicable to the scope of consolidation of the Group’s accounting and financial disclosures and in terms of sustainability, which covers:
- the Energy Distribution division, controlled by Rubis SCA (wholly-owned), and its controlled subsidiaries; and
- the Photovoltaic Electricity Production activity, controlled by Rubis SCA (80%-owned), and its subsidiaries.
The exact scope for accounting and financial information disclosures, on the one hand, and in terms of sustainability, on the other hand, is presented respectively in chapters 7 and 4 of this Universal Registration Document.
The Group has defined a set of policies, procedures and operating methods specifying the way in which the operations of the Group’s entities must be carried out. These internal standards help minimise the risks of each process. They are designed and adopted by the functional departments of Rubis SCA, the Energy Distribution division, the Photovoltaic Electricity Production activity and the operating entities. They are updated according to changes in the field concerned, best practices and regulations.
Within the Energy Distribution division, the internal control manual defines the major principles of internal control and the main control points to be carried out as part of the business line and support processes (finance, human resources, legal, ethics and anti-corruption, sales, purchases, inventory management, operations & projects, etc.).
Rubis SCA draws up the Group’s strategy, coordinates and finances its development, takes the main management decisions resulting therefrom and ensures their implementation, both at the level of its direct subsidiaries and their subsidiaries. Rubis SCA has established accounting and financial structures and procedures that contribute to reliable internal controls being implemented. The Group’s decentralised managerial model gives each subsidiary or industrial site Manager considerable autonomy in the management of his or her activity.
This delegation of responsibility is closely linked to compliance with the guidelines presented below (see section 3.2.1.2) and to the regular monitoring and control by the relevant functional departments of the Energy Distribution division, the Photovoltaic Electricity Production activity and Rubis SCA.
Given the specificities of the Energy Distribution division and the Photovoltaic Electricity Production activity, the risk management and internal control procedures may vary between these two organisations. These differences are mentioned where necessary in the following sections.
The Group’s Management Board monitors changes in risks and ensures that the necessary management and internal control measures are effectively implemented. It is supported by Rubis SCA’s functional departments, the General Management of the Energy Distribution division and the Photovoltaic Electricity Production activity and their functional departments, as well as the General Management of the operating entities. The Group’s Management Committee, whose composition is described in chapter 5, helps the Management Board to exercise its risk management and internal control responsibilities.
Within the Energy Distribution division, which has the largest scope of operations in terms of contribution to the Group’s results, number of employees and countries of activity, the Internal Audit Department is responsible for monitoring the proper implementation by the division’s subsidiaries of the internal control system presented in the division’s internal control manual (see section 3.2.1.4).
The audits cover all the division’s business processes and supports (with the exception of operations covered by the technical inspection audits carried out by the division’s Technical and HSE Department) including, for example, treasury, accounting, human resources, sales, purchasing, supplies, inventories, ethics and anti-corruption (non-exhaustive list).
The audit reports are sent to the Chief Executive Officer of the audited company and to the General Management of the division.
The audit recommendations include a schedule for the implementation of corrective actions which must be respected by the company concerned.
In addition, the implementation of audit recommendations is regularly monitored by the Internal Audit Department until all the internal audit recommendations have been definitively applied.
The risk factors identified during internal audits are also used to update the relevant company’s risk mapping.
The Internal Audit Department uses a digital tool to optimise risk management and associated action plans. It also allows for a more in-depth and detailed assessment of the performance of each subsidiary’s internal control system.
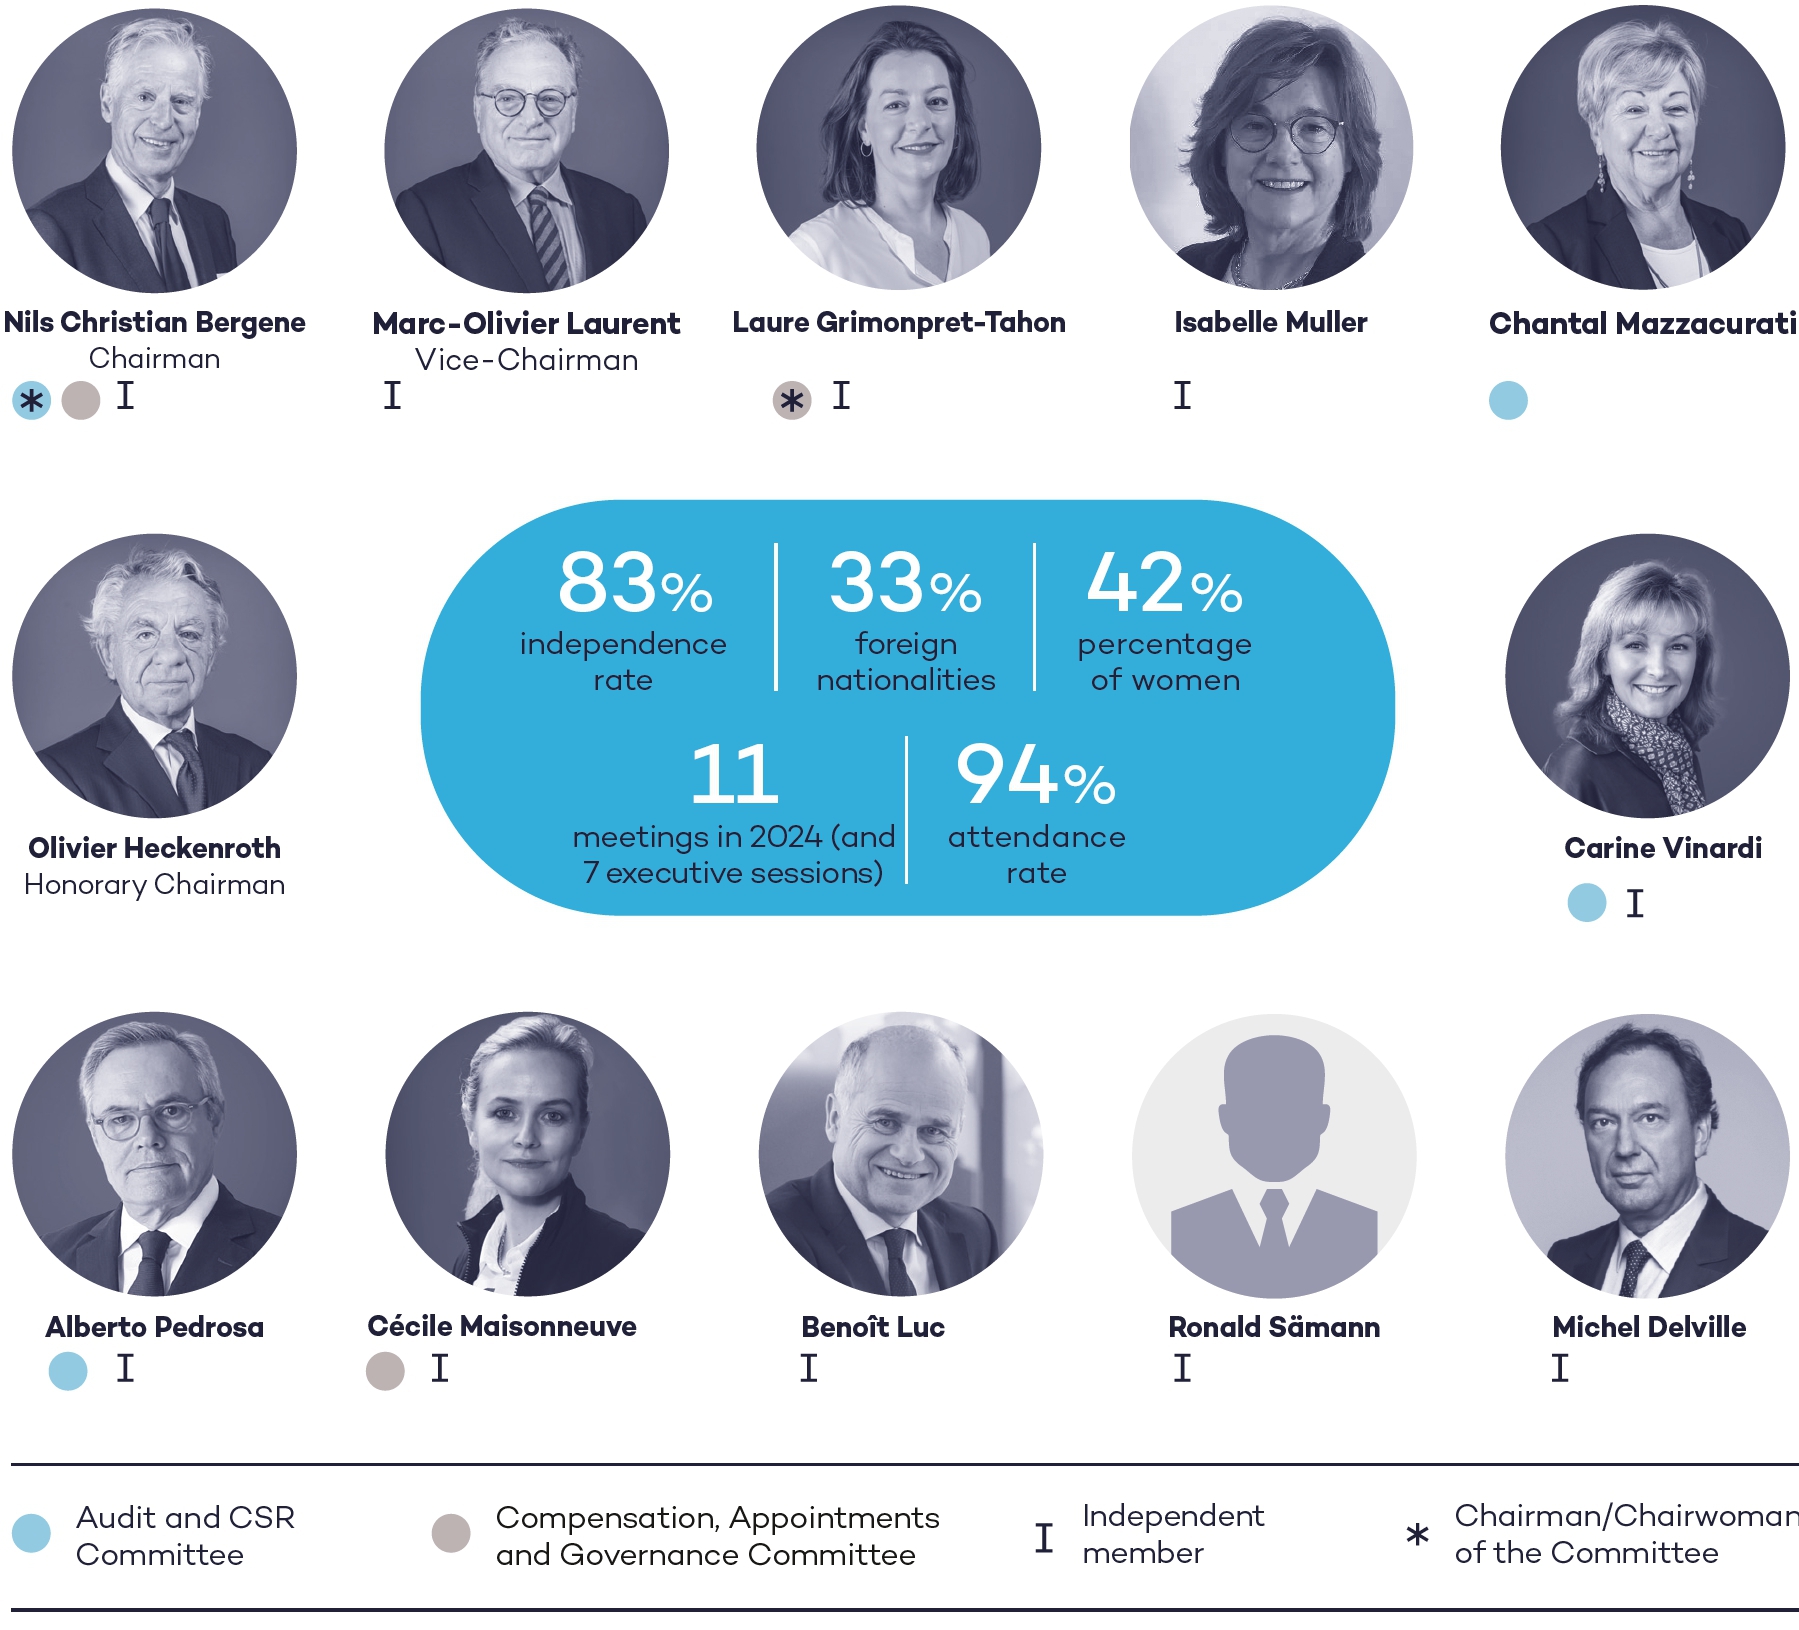
The composition and functioning of the Supervisory Board and its Audit and CSR Committee are described in chapter 5, section 5.3.2.
In accordance with the internal rules of the Group’s Supervisory Board, the Management Board is required to keep the Supervisory Board informed of the internal control procedures defined and developed by the Group’s companies.
The Supervisory Board is assisted by its Audit and CSR Committee, in particular for the following missions:
- examining the financial statements, ensuring consistency of methods, quality of data and completeness, and ensuring that the financial statements give a true and fair view;
- monitoring internal control procedures with respect to accounting and financial matters and risk exposure;
- supervising the selection procedure for Statutory Auditors (or their renewal), making recommendations to the Supervisory Board and monitoring compliance with their conditions of engagement.
In line with French Order No. 2023-1142 of 6 December 2023 transposing the European CSRD directive into French law, the missions of the Audit and CSR Committee have been extended to monitor the production of information in terms of sustainability. In addition, this Committee was also tasked with monitoring the Group’s sustainability policy and in particular its CSR Roadmap, including climate objectives and commitments, monitoring significant regulatory changes (e.g. the European green taxonomy, duty of vigilance) and their challenges for the Group and the monitoring of the main ethics, social and environmental risks.
To carry out its work, the Audit and CSR Committee hears the main Managers and Directors concerned. It also meets with the Statutory Auditors. The members of the Audit and CSR Committee have access to the same documents as the Statutory Auditors and examine the summary of the Statutory Auditors’ work.
The Managers, the main functional and operational departments and the members of the Management Committees of the Group’s various entities are the intermediaries for internal control and risk management and the main beneficiaries, but also key contributors to its proper execution.
The control activities carried out at the level of each entity are the responsibility of its Chief Executive Officer, in accordance with the framework defined at the level of their division or activity. They are assisted by the functional departments of their division or activity and are supported by their local management team. They are responsible for reporting to their division and to Rubis SCA any information on significant risks and events and contribute to updating the risk mapping via that carried out for their entity/entities.
The Group’s risk management process is based on the development of mapping and a range of complementary tools to identify risks and define actions in order to better control them.
These mappings help identify and analyse the main risks to which the Group’s activities are exposed and which are likely to have a significant adverse effect on the Group’s business, its financial position, including its results, its reputation or its outlook. The risks analysed belong to different families: market, financial, commercial, environmental, industrial, climate, logistics, social, legal, IT and corruption/influence peddling risks. The legal risk category also includes issues related to fraud and contractual breaches. The mappings are developed and/or updated once or twice a year in collaboration between the following: functional departments of Rubis SCA, functional departments of the Energy Distribution division and the Photovoltaic Electricity Production activity and General Managers of operational entities.
The significant risks for the Group in 2024 are described in section 3.1 of this chapter. The consolidated mappings as well as a review of the major events and disputes of the past period are presented to the Audit and CSR Committee, which reports to the Supervisory Board, at least at each annual and half-year closing of the financial statements (see chapter 5, section 5.3.2).
In the area of corruption, specific mappings are carried out by the subsidiaries in accordance with French law no. 2016-1691 of 9 December 2016 on transparency, the fight against corruption and the modernisation of economic life (Sapin 2). These mappings are part of the corruption prevention and detection system presented in detail in chapter 4, section 4.4.
In addition, as part of the preparation of its Sustainability Statement in accordance with Directive (EU) 2022/2464 on the publication of sustainability information by companies (known as the CSRD directive), the Group carried out a double materiality assessement of the Group’s activities. This was informed by the risk mapping and a consistency review of these mappings was carried out in the light of the results of the double materiality assessement. This exercise is presented in more detail in chapter 4, section 4.1.4.1.
These risk mapping systems are supplemented by permanent monitoring by the functional and operational departments of the risks falling within their scope of responsibility.
Lastly, the Chief Executive Officers of the operating entities must report significant incidents and main disputes to their division or activity, in line with the internal procedure, which informs the General Management, the Finance Department and the Sustainability, Compliance & Group Risk Department. The Group’s Management Board and the General Management of the activity concerned are thus kept informed of the occurrence of any incident likely to harm the Group’s results, objectives or image and of the management measures adopted.
- industrial, technical and HSE risks, accident reporting systems are in place. These systems are used to generate monitoring indicators that are regularly presented to the functional Directors concerned and, for the Energy Distribution division, to the General Management;
- sustainability, the Group Sustainability, Compliance & Risk Department actively monitors emerging risks. In 2024, it also initiated a series of conferences on the future and sustainability for the members of the Management Committees of the holding company, Rubis Énergie and Rubis Photosol in order to anticipate developments in sustainability as effectively as possible, cultivate a forward-looking mindset and make participants aware of the multiplicity of current trends and the issues that could arise in the short, medium and long term.
Within the Energy Distribution division, the most exposed given its activity and scope of operations, a crisis management procedure is applied when a crisis likely to affect the business continuity of the division or that of its customers. This guide sets out the rules for alerting and mobilising the Crisis Management Unit at the division’s head office, determines the crisis management framework for a crisis within a subsidiary of the division, and offers a standard summary of local procedures to be adopted by all subsidiaries and reiterates the main principles of crisis communication.
-
3.3 Insurance
The Group has taken out several insurance policies in order to offset the financial consequences of materialised risks. The main policies cover both property damage and operating losses as well as civil liability.
Insurance programmes are taken out with leading international insurers and reinsurers. The Group believes that these programmes are in line with the potential risks linked to its activities. However, the Group cannot guarantee that in the event of a claim, and an environmental claim in particular, all financial consequences will be covered by insurance. The Group also cannot guarantee that it will not suffer any losses that are uninsured.
3.3.1 Holding company (Rubis SCA)
Senior Managers of Rubis SCA and its controlled subsidiaries are insured, as are Senior Managers of designated 50%-owned joint ventures.
The policy covers the financial consequences of incidents resulting from any claim involving the individual or joint and several civil liabilities of the insured persons and attributable to any professional misconduct committed by such insured persons in the performance of their senior management duties.
-
4 SUSTAINABILITY STATEMENT
-
Preamble
This year marks an important milestone for Rubis with the publication of its first Sustainability Statement, in accordance with the requirements of the Corporate Sustainability Reporting Directive (CSRD). This document replaces the Non-Financial Information Statement (NFIS) and is part of a continuous improvement process. Over the coming years, the information published will need to be clarified, supplemented and improved.
The Sustainability Statement does not reflect all of the Group’s sustainability actions, but only the material elements under the meaning of the CSRD. In order to facilitate the reading and legibility of the information, Rubis has chosen to indicate in square brackets the references to the publication requirements of the standard. In addition, for a more synthetic approach to the various topics addressed, introductory pages have been produced for each ESRS in order to make the subject more accessible beyond the requirements of the standard (see following pages with the summaries for each ESRS).
It is important to underline that this first sustainability report was carried out in a short period of time given (i) the major changes that the CSRD requires in the way of presenting information and (ii) the late publication of the guidance documents, in particular those relating to the climate transition plan.
-
4.1 General disclosures [ESRS 2]
4.1.1 Basis for preparation of the Statement [BP]
This chapter of the Universal Registration Document constitutes the “Sustainability Statement”, in accordance with the requirements of European Directive 2022/2064 of 16 December 2022 “Corporate Sustainability Reporting Directive” (CSRD), which entered into force on 1 January 2024.
This directive was transposed into French law via Decree No. 2023-1394 of 30 December 2023 issued pursuant to Order No. 2023-1142 of 6 December 2023 on the publication and certification of sustainability information and on the environmental, social and corporate governance obligations of commercial companies.
The first year of application of the directive was marked by uncertainties concerning the interpretation of the texts, the absence of established practices, as well as difficulties in data collection, particularly within the value chain. In this context, Rubis ensured that it complied with the requirements of the European Sustainability Reporting Standards (ESRS) based on the information available at the time the Sustainability Statement was prepared. Due to limited access to certain data, estimates were used in accordance with ESRS standards. These interpretations may be refined as the quality of the data improves, with the emergence of new information and the strengthening of internal control practices for reporting on sustainability information.
The Sustainability Statement presents the policies and action plans set to meet the Group’s material sustainability challenges, as well as the targets and indicators selected. The information required by the Minimum Disclosure Requirements (MDR) are presented when available, with the Group continuing its work in this area.
In the context of the first year of application mentioned above, a certain amount of quantitative and qualitative data could not be collected at Group level or were partially collected. The Group has identified the themes on which work will continue in the coming years. This work concerns, for example, metrics related to compensation (see section 4.3.1.5) and biodiversity (see section 4.2.4).
The environmental, social and governance information presented in this report must be interpreted in addition to the information provided in the methodological note (see section 4.5). This note specifies the calculation methods and assumptions and estimation methods used for the most relevant indicators. The social and environmental data is collected at the legal entity level.
The Sustainability Statement was prepared on the basis of the scope of consolidation of the Group’s consolidated financial statements, taking into account operational control for environmental data. There is no significant difference between the scope of entities under financial control and the scope of entities under operational control. The treatment of the Rubis Terminal JV in the Sustainability Statement is specified in section 4.1.1.1.2.
Any acquisition or disposal of an entity is taken into account in the Sustainability Statement at the same time that it is consolidated or disposed of.
It is specified that no subsidiary included in the Group’s consolidated Sustainability Statement is required to publish its own individual or consolidated and therefore benefits from the exemption provided for by Directive 2013/34/EU.
The greenhouse gas emissions of the Group’s activities are published for all entities for which the entity exercises operational control.
The reliability of scope 3 data may be influenced by various factors, including the use of estimates, secondary data, as well as emission factors from sources of varying quality (see section 4.6.2.6).
A company’s climate change mitigation transition plan aims to provide an understanding of its past, current and future mitigation efforts in order to ensure the compatibility of its strategy and business model with the transition to a sustainable economy. However, to date, there is no consensus on reduction targets or trajectories that can be rolled out across the Group’s business sectors. Rubis believes that its current targets are not aligned with the Paris Agreement target of limiting global warming to 1.5°C by the end of the century (see section 4.2.1.2.2).
In 2024, entities with fewer than 10 employees (representing a total of 14 entities and 76 employees, i.e. 1.7% of the Group’s total own workers) were able to use a simplified reporting process that did not significantly impact the published social indicators. It is important to note that quantitative or qualitative information relating to human rights (such as health, safety, child labour, etc.) is regularly collected, regardless of the size of the entity.
In addition, the shipping activity requires the use of crews hired on temporary contracts (fixed-term contract generally). These non-permanent own workers of the Group (166 individuals in 2024) are not taken into account in the monitoring of the published social indicators.
It should be noted that the concept of operational control is not relevant for social standards (see ESRS 1 and Implementation Guidance 2 “Value chain” in Efrag, paragraph 61).
In line with ESRS standards, the information presented in the Sustainability Statement may contain forward-looking indications, in particular concerning climate-related objectives. This forward-looking information is based on data, economic assumptions and estimates relating to a given context (economic, competitive and/or regulatory situation, state of scientific knowledge, etc.) and considered reasonable by the Group at the date of publication of this document. Forward-looking statements should not be construed as guarantees that the prospects, objectives or ambitions presented will be achieved. These statements are likely to change or be significantly affected due to uncertainties related in particular to the economic, competitive and regulatory environment or the materialisation of known or unknown risks at the date of publication of this report. It is recalled that all the information published in this report reflects the state of knowledge available to date and takes into account the recent and evolving nature of regulatory requirements as well as applicable best practices.
In October 2024, Rubis completed the disposal of its 55% equity interest in the Rubis Terminal JV, following the final agreement signed in April 2024. In the absence of data available at the date of preparation of the Group’s Sustainability Statement, the environmental, social and governance data relating to the Rubis Terminal JV, now called Tepsa, are not included in the Sustainability Statement for the year ended 31 December 2024. The 2023 data has been restated to exclude those of the Rubis Terminal JV.
The removal of this entity from the reporting scope did not alter the identification of the important sustainability issues for the Rubis Group. Indeed, this activity does not present any significant sustainability issues that have not also been identified in at least one other division of the Group.
This Sustainability Statement includes information on material impacts, risks and opportunities (IROs) related to the Group due to its direct and indirect business relationships upstream and downstream of its value chain, in addition to IROs related to its own activities.
As part of the double materiality assessment, the major issues of the main links in the upstream and downstream value chain were taken into account. This covers the production, processing and transportation of the main raw materials used in the Group’s business to the end-use of products and services, as well as the end-of-life of facilities.
Depending on the nature of the issues addressed and the Group’s ability to influence, policies, actions and targets may extend beyond the scope of its operations to apply to players in the value chain or apply specifically to the management of those relationships, such as:
- the Code of Ethics and the anti-corruption programme, which are aimed at all of the Group’s stakeholders, including partners, suppliers, subcontractors;
- the Think Tomorrow 2022-2025 CSR roadmap, which includes targets applicable to the value chain such as the reduction of the carbon footprint generated by our value chain (Targeted scope 3A).
Unless otherwise stated, information on quantitative data falls within the scope of the Group’s operations.
It should be noted that a transitional provision for the first three years of publication applies for information concerning the upstream and downstream value chain. For this first-time publication, efforts were made by the Company to obtain qualitative information regarding the upstream and downstream value chain. Ongoing improvements will be made over the coming years in order to obtain more information. The details of this information and our related action plans are specified in the relevant sections.
This Sustainability Statement covers the financial year of 1 January to 31 December 2024. It also includes short-, medium- and long-term estimates, outlooks and objectives.
The short term is defined as a period of one to three years. The Group has chosen the option provided by the standard to define medium- and long-term time horizons that are more adapted to the specificities and dynamics of its activities.
These time horizons make it possible to better take into account the investment and development cycles of projects as well as the Group’s business lines.
The objectives set for 2025 or annually are short-term, while those planned for 2030 are part of a medium-term outlook.
4.1.1.2.2 UPSTREAM AND DOWNSTREAM VALUE CHAIN ESTIMATES AND SOURCES OF UNCERTAINTY REGARDING ESTIMATES AND RESULTS
Sustainability information may be subject to uncertainty due to the limitations of scientific and economic knowledge, as well as the quality of internal and external data used. Estimates concerning the upstream and downstream value chain are dealt with in the E1 standard. Certain information, such as forward-looking data, missing data and the quantification of environmental data, uses estimates and judgments based on our experience, international standards and the best information available to date. These estimates are sensitive to the methodological choices and assumptions used. The nature and scope of estimates or limitations on the scope of collection are detailed in section 4.6.2.
Although this is the first year of reporting under the CSRD, Rubis will mention the comparative data for the indicators already reported by the Group. For the other data, the comparison will be made starting with the 2026 reporting on the 2025 data.
The calculation of the carbon footprint assessment has been modified to meet the requirements of ESRS E1 (see section 4.2.1).
ESRS Disclosure Requirement Requirement Localisation of
incorporated informationESRS 2 GOV-1 Detailed presentation of the roles and responsibilities of governance bodies and their activities in terms of sustainability Chapter 5, section 5.2.1 for the Management
Board, section 5.2.2 for the Group
Management Committee and 5.3
for the Supervisory BoardESRS 2 GOV-1 Supervisory Board Chapter 5 ESRS 2 GOV-3 Compensation policy Chapter 5, section 5.4.4 ESRS 2 GOV-5 Risk management and internal controls over sustainability reporting Chapter 3, section 3.2 ESRS 2 SBM-1 Business model Chapter 1 ESRS 2 SBM-1 Major trends in the energy market and strategy Chapter 1 ESRS 2 SBM-1 Overview of activities Chapter 1 ESRS 2
ESRS E1SBM-1 Consolidated turnover, EBITDA, Capex and Opex Chapter 7 ESRS E2 E2-6 Financial effects Chapter 7, section 7.1, note 4.11 -
4.2 Environment
4.2.1 Meeting climate challenges: mitigation, diversification and adaptation [ESRS 1]
The Group recognises the importance and urgency of the fight against climate change and is fully aware of the challenges related to the energy transition in our sector. The oil and gas sector plays a key role in access to energy and to the development of populations.
Faced with changing societal expectations and the need to reduce global greenhouse gas emissions, Rubis has made a commitment to develop its activities in response to the needs of a just transition and to contribute to the reduction of global greenhouse gas emissions. This means taking into account the needs for access to energy, which are essential to guarantee this just transition, particularly in developing regions such as Africa where a large part of the population does not yet have access to energy.
In this context, the Group has evolved into a multi-energy player, developing solutions adapted to the energy transition while taking into account local realities and needs.
The table below presents the gross impacts, risks and opportunities related to climate change identified and deemed material by the Group during the double materiality assessment carried out in 2024 (see 4.1.3.3).
These material IROare linked to the Group’s strategy and business model insofar as it is a player in the energy sector, whose value chains have a key role to play in the energy and climate transition.
In 2024, the Group emitted 18.7 MtCO2e on its Scopes 1, 2 and 3 (see section 4.2.1.4.1.3), thus contributing to global warming. The majority of these emissions are related to the use of sold products by the Group, which corresponds to the combustion of gas and fossil fuels. More than 99% of these emissions come from the Energy Distribution division (the remainder coming from the Photovoltaic Electricity Production activity).
An analysis of transition risks was carried out by the Group in 2024, based on a +1.5°C warming scenario. The results are presented in more detail in sections 4.2.1.4.1.1 and 4.2.1.4.1.6.
The transition to a low-carbon economy can gradually impact, the conditions of access to financing, the decarbonisation costs and the markets served by the Group.
The Group analysed the resilience of its activities to transition risks by 2030. It concluded that its mitigation measures will enable it to be resilient in the face of these challenges (see section 4.2.1.4.1.6).
The Group is developing its Photovoltaic Electricity Production activity and is working to diversify the historical activities of its Energy Distribution division. In 2024, the development of the Group’s renewable activity continued, thus reinforcing the positive impact of this diversification. Indeed, the latter contributes to the energy transition by offering products with a lower carbon footprint.
The diversification of the Group’s activities into renewable energies is an opportunity to gain new markets and is a growth driver. In addition, this diversification could be apprehended in a positive manner from a reputational point of view due to a strategic positioning focused on lower carbon solutions (see section 4.2.1.4.2).
An analysis of the physical risks related to climate change was carried out in 2024 on the basis of a +4°C warming scenario in order to achieve a stress test of the Group’s assets and activities. The associated results are presented in section 4.2.1.5.
Climate change increases the probability and intensity of climate events that could interrupt or slow down the Group’s operations. These climate hazards, which are already present and may increase in the future, such as cyclones, fires, or floods, are likely to have financial impacts. The Group assessed its mitigation actions and considered that its activities were resilient to the physical risks related to climate change to 2030 (see section 4.2.1.5.3).
Rubis has structured its governance to integrate climate issues at all levels of the Company, in order to ensure a consistent and strategic approach.
The Management Board of Rubis SCA validates the Group’s objectives and is responsible for these issues, which are regularly addressed at the level of the Group’s various bodies: Group Management Committee, the Committees of the subsidiaries and the Sustainability Strategy Committee.
The Rubis SCA Supervisory Board examines the Group’s strategy including sustainability issues, in particular climate issues. In 2024, the Board examined the challenges relating to the Group’s climate strategy and initiatives at three meetings. The Supervisory Board relies on its specialised Committees for its work on sustainability and climate issues:
- the Audit and CSR Committee, which examined the current climate challenges for the Group in 2024 and reviewed the results of the double materiality assessment;
- the Compensation, Appointments and Governance Committee, which examined the achievement of the sustainability criteria, including the climate criterion for the annual variable compensation of the Management Board, and proposed the appointment of new members with expertise in climate issues to the Supervisory Board.
The Sustainability Strategy Committee, chaired by one of the Managing Partners, is a key body set up to monitor the management of climate and social responsibility (CSR) issues. This Committee, led by the Group Sustainability, Compliance & Risk Department, met three times in 2024. It brought together the Directors for Finance and CSR/Climate of the Energy Distribution division and the Photovoltaic Electricity Production activity. Its main role is to ensure that the Group’s climate and sustainability approach is in line with the various challenges to which the Group must respond. The duties of this Committee notably include:
- management of the Group’s carbon trajectory, defining greenhouse gas (GHG) emission reduction targets and following the decarbonisation plan;
- anticipating climate risks, by projecting the Group’s activities in a constantly changing context, taking into account the carbon markets and regulatory changes;
- the definition of the key messages to be included in the communication of the Group and the subsidiaries on sustainability and climate issues.
The decarbonisation of theGroup’s activities is implemented by its subsidiaries. The Chief Executive Officers are responsible for executing the decarbonisation approach of their respective entities and ensuring that they are in line with the Group’s objectives. They define the decarbonisation levers, assess the OpEx and CapEx required for their implementation and monitor the actions deployed.
Lastly, in 2024, Rubis continued to expand its CSR and Climate teams. A Climate & Biodiversity Expert position was created within the Group Sustainability, Compliance & Risks Department to support the definition of the Group’s sustainability strategy, in particular on climate and biodiversity-related issues.
The New Energies Committee, bringing together the Management Board and General Management of Rubis SCA and the Energy Distribution division, meets regularly to examine opportunities for diversification into new energies. Whether for organic growth, strategic partnerships or acquisitions, this Committee is exploring options to strengthen Rubis’ position in the energy transition. In 2024, this Committee met four times.
A performance criterion based on carbon intensity was introduced in 2019, accounting for 15% of the Management Board’s annual variable compensation. This criterion is triggered if the monetary carbon intensity of the Group’s operational emissions decreases during the reporting year compared to the previous year. It concerns the Group’s operating emissions (Scopes 1 and 2) in relation to gross operating profit (EBITDA). Thus, for 2024, it is triggered if the ratio between Scopes 1 and 2 emissions and EBITDA was lower in 2024 than in 2023 (see section 4.1.2.2).
Awareness-raising and training are key steps in the implementation of the Group’s climate approach. They enable employees to understand and take up the issues in order to roll out actions within their business lines.
In 2022, Rubis organised a CSR seminar to work on the Group’s roadmap. This event brought together the Chief Executive Officers of the subsidiaries, the Sustainability Contacts as well as part of the Group’s General Management, and included a Climate Fresk session, an educational workshop to better understand global warming, bringing together nearly 80 participants. A CSR seminar is planned for 2025 to prepare the next period of the Group’s CSR roadmap for 2026-2030.
In order to raise awareness among all its employees, Rubis regularly organises webinars to present the Group’s climate approach and address transition-related topics such as solarisation, hydrogen and carbon offsetting.
Lastly, the Group’s subsidiaries may be required to organise local awareness-raising actions, for example, in 2024:
- Climate Fresks in Corsica, Djibouti and Madagascar;
- climate awareness sessions in Uganda or Rwanda;
- staff meetings in Portugal addressing the results related to the reduction of the carbon footprint.
In June 2024, the Group launched the Rubis Climate School, an awareness-raising and training tool for its employees on climate change. In 2024, 336 employees took part in these online training courses, including 238 who completed the entire training course of approximately two hours. This course, designed in line with the objective of our CSR roadmap “10% of employees trained in changes in the Group's business lines, such as the energy transition, sustainability, new technologies, AI, etc.”, provides an understanding of the main principles of climate change, the calculation of the carbon footprint and the main levers to reduce the footprint.
The Group pays particular attention to existing and future decarbonisation solutions, as well as to the development of energies with a lower carbon footprint. It is also aware of the energy needs of certain regions that do not have sufficient access to energy to support their development. Rubis’ objective is to promote a fair and equitable transition by offering solutions adapted to the specificities of each region.
Given this context, Rubis has developed a first CSR roadmap Think Tomorrow 2022-2025 incorporating its climate objectives for 2030. Climate issues will be reviewed when the roadmap for the 2026-2030 period is defined.
A study of the transition impacts, risks and opportunities was carried out and led to the definition of the Group’s current climate objectives. These objectives have been approved by the Management Board. They focus on three strategic areas.
Rubis’ GHG emissions are accounted for and presented in three scopes, in accordance with the GHG Protocol:
- Scope 1: direct emissions from facilities and equipment under the direct control of the Company;
- Scope 2: indirect emissions resulting from the consumption of electricity, heating or cooling;
- Scope 3: other indirect emissions generated by activities upstream or downstream of Rubis’ operations. This scope is divided into two categories:
- Scope 3A which includes all categories of Scope 3 except category 11 (use of sold products). This scope includes the targeted scope 3A which corresponds to the emission categories of upstream transportation and distribution, including shipping and land transport, upstream electricity and business travel of the Energy Distribution division. It represents approximately 45% of the division’s 2019 Scope 3A emissions,
- Scope 3B which corresponds to the use of sold products (category 11).
The Group is committed to reducing its Scopes 1 and 2 emissions by 20% between 2019 and 2030 and to reducing its targeted scope 3A emissions by 20% over the same period.
Rubis believes that its current targets are not aligned with the Paris Agreement target of limiting global warming below 1.5°C by the end of the century. Indeed, the Group is aiming for a reduction in its Scopes 1, 2 and targeted scope 3A emissions of -20% in absolute value between 2019 and 2030, not aligned with the IPCC +1.5°C trajectory, which projects a reduction in global emissions of -43% between 2019 and 2030. This IPCC reference was considered in the absence of an adapted sectoral trajectory.
In 2024, Rubis emitted 282 ktCO2e on its Scopes 1 and 2, i.e., a reduction of 15 ktCO2e or 5% compared to 2019. To achieve its target, the Group plans to reduce its emissions by an additional 45 ktCO2e between 2025 and 2030, focusing in particular on its highest-emitting activities. Indeed, nearly 84% of Scopes 1 and 2 emissions are related to the Group’s refining and shipping activities and are generated by long-life assets, resulting in locked-in emissions until 2030 and requiring the implementation of specific decarbonisation plans. These plans have been built and integrated into the Group’s strategic plan. They mainly rely on the use of biofuels, the electrification of processes, energy efficiency projects and the solarisation of assets. The costs of the decarbonisation plans are presented in section 4.2.1.4.1.4.
In 2024, Rubis emitted 88 ktCO2e on its targeted scope 3A emissions, i.e., a reduction of 3 ktCO2e or 3% compared to 2019. To achieve its target for 2030, the Group plans to work with its shipping and road transport service providers on the use of biofuels, the optimisation of journeys and the renewal of vehicle fleets. The Group is still working to quantify the impacts and resources related to its decarbonisation plan on the targeted scope 3A (see section 4.2.1.4.1.4).
This change involves the diversification of the Energy Distribution division, as well as the development of the Photovoltaic Electricity Production activity. It enables the Group to offer products with a lower carbon footprint to its customers.
The diversification of the Energy Distribution division’s activities is structured around two challenges:
- molecules: develop the portfolio of low-carbon molecules;
- electrons: support the division's customers in their transition to electrified solutions.
By 2027, the Group aims to have a secured portfolio of more than 2.5 GWp and achieve consolidated EBITDA of €50 to €55 million. The development of the activity will continue in France, the bastion of the Photovoltaic Electricity Production activity. The business will build on this base to expand its activities internationally. The focus will be on certain countries including Italy and Eastern Europe.
In 2024, the Photovoltaic Electricity Production activity represented 4% of the Group’s EBITDA. The installed capacity at the end of the year was 523 MWp compared to 435 MWp at the end of 2023, an increase of 20%. At the end of 2024, the activity had 1.1 GWp of secured portfolio(1) and 5.4 GWp of projects under development. This development was supported by investments in this activity, which represented 32% of the Group’s CapEx in 2024, almost all of which are aligned with the taxonomy.
The table below shows a correspondence between the different parts of the Group’s transition plan and the sections of the report.
Part of the climate transition plan ([E1-1 §16]) Corresponding sections Scope (a) GHG emission reduction targets Decarbonisation
• 4.2.1.4.1.2 Decarbonisation policies and objectives
Diversification
• 4.2.1.4.2.2 Renewable energy and transition development policies and objectives
Group (b) Explanation of the decarbonisation levers identified Decarbonisation
• 4.2.1.4.1.4 Emission reduction plan, Decarbonisation levers
Diversification• 4.2.1.4.2.4 Levers for the development of renewable energy - Actions and resources
Group (c) Description and quantification of the Company’s investments and financing to support the implementation of the transition plan Including reference to taxonomy-aligned CapEx and CapEx plans • 4.2.1.4.1.3 Investments and actions in decarbonisation and diversification over the reporting period (2024)
Decarbonisation
• 4.2.1.4.1.4 Emission reduction plan, Decarbonisation levers
Diversification
• 4.2.1.4.2.4 Levers for the development of renewable energy - Actions and resources
• 4.2.1.4.2.5 Financial effects of transition opportunities
Group (d) Qualitative assessment of locked-in GHG emissions potentially related to the Company’s main assets and products • 4.2.1.4.1.4 Emission reduction plan, locked-in emissions Group (e) For activities related to NACE codes B.05, C.19, D.35.1, D.35.3, G.46.71, explanation of the objectives set to align its activities with the taxonomy of sustainable activities The Group’s activities are linked to the NACE codes indicated. The Group’s transition plan (see section 4.2.1.2.2.1) should enable it to align some of its activities with the taxonomy of sustainable activities. Group (f) Significant amounts of CapEx invested during the financial year in connection with economic activities related to coal, oil and gas • 4.2.1.4.1.3 Investments and actions in decarbonisation and diversification over the reporting period (2024) Group (g) The Company is excluded from the Paris Agreement benchmarks Rubis is excluded from the Paris Agreement Benchmarks. In fact, more than 10% of the Group’s turnover is dedicated to the distribution of liquid fuels. Group (h) Description of how the transition plan is integrated in and aligned with overall corporate strategy and financial planning Rubis’ transition plan is an integral part of the Company’s general strategy and financial planning. Its key components are presented in chapter 1. Group (i) Information on whether this transition plan is approved by the governance bodies The transition plan is approved by the Management Board (see section 4.2.1.2.1) Group (j) Progress made by the Company in implementing the transition plan Decarbonisation
• 4.2.1.4.1.3 Carbon footprint assessment and energy mix
• 4.2.1.4.1.4 Emission reduction plan
Diversification
• 4.2.1.4.2.3 Energy production
• 4.2.1.4.2.4 Levers for the development of renewable energy - Actions and resources
Group Pillar 3 – Anticipate the physical risks of climate change and strengthen the resilience of the Group's activities
In 2024, Rubis conducted a study on the physical impacts of climate change linked to a +4°C warming scenario. Several gross risks have been identified as material for certain Group assets. After analysing the mitigation measures in place, in particular their insurance mechanisms, the Group believes that its mitigation actions enable its activities to be resilient to these risks by 2030.
The remainder of the discussion in this section describes the Group’s climate approach in more detail.
- reduce operational greenhouse gas emissions, particularly from its industrial sites, vessels and trucks (Scopes 1, 2 and objective 3A);
- diversify its activities in renewable and transition energies to offer products with a lower carbon footprint (impact on our Scope 3B).
The transition risks related to climate change mitigation were analysed on the basis of two scenarios:
This scenario includes changes in the regulatory framework, particularly in Europe with the European Union’s Fit for 55 programme, as well as stakeholder expectations. The analysis was carried out by an external firm, distinguishing in particular between the Group’s business sectors and regions of operation, which are exposed to very different situations;
This scenario was designed by comparing the results of the IEA NZE +1.5°C scenario with the Group’s strategic vision. Its construction is based on projections linked to changes in markets, regulations and technologies, as well as feedback obtained during consultations with the Group’s various divisions and certain key subsidiaries.
Transition risks were analysed up to 2030, at the date of publication of this document. The main risks identified are presented in the table below.
Risk Scope Description of gross risk before risk mitigation actions Gross potential financial impact Market risk
Decline in demand for LPG in EuropeEnergy Distribution Retail & Marketing Europe By 2030, demand for LPG in Europe in the markets served by Rubis is expected to decline. The impact of this decrease will vary according to each European country where the Group operates, depending on its position in those markets. Risk +1.5°C scenario: very high
Risk Rubis scenario: very high
Potential financial consequences: decrease in sales volumesMarket risk
Decline in demand for road fuel in EuropeEnergy Distribution Retail & Marketing Europe By 2030, demand for road fuels in Rubis’ markets in Europe is expected to decline. This decrease should be differentiated according to geographical areas, in particular with a lower impact in certain peripheral areas such as the French Overseas Departments and Collectivities. Risk +1.5°C scenario: high
Risk Rubis scenario: moderate
Potential financial consequences: decrease in sales volumesMarket and reputational risk
Access to and increased cost of financingEnergy Distribution The conditions for access to loans have tightened in recent years. This new situation is mainly due to the implementation of new regulations applicable to the banking system. European regulations, such as the Taxonomy and SFDR (Sustainable Finance Disclosure Regulation), now direct financing towards sustainable activities. Risk +1.5°C scenario: very high
Risk Rubis scenario: high
Potential financial consequences: difficulty in accessing financingRegulatory risk*
Carbon markets and carbon taxesEnergy Distribution Europe Regulatory risk is considered for the refining and shipping activities. In the medium term, the Green Deal regulations require companies in the oil sector to decarbonise their activities. The emissions trading system (ETS 1), a European carbon market, which initially involved facilities with a high environmental impact, was extended to the maritime sector in 2024.
The FuelEU Maritime directive, which came into force on 1 January 2025, also requires vessel operating companies to reduce the carbon intensity of their operations.
Risk +1.5°C scenario: high
Risk Rubis scenario: high
Potential financial consequences: increase in operating costsTechnological and regulatory risk*
Cost of decarbonising SARA and shippingEnergy Distribution Support & Services Several actions should make it possible to decarbonise the Group’s highest emitting assets. The financial impacts of this decarbonisation are presented in section 4.2.1.4.1.4. Risk +1.5°C scenario: high
Risk Rubis scenario: very high
Potential financial consequences: increase in operating costs* Transition risks related to carbon markets, carbon taxes and the decarbonisation of the Group’s activities are interconnected. The increase in the price of carbon is likely to affect the profitability of emissions-intensive activities, while strengthening the economic viability of solutions with a lower carbon footprint. It can thus make certain low-carbon alternatives more competitive than traditional carbon-intensive solutions. Transition risks are included in the Group’s risk analysis processes (see chapter 3, section 3.1.2.1). Therefore, each year, every business unit assesses its exposure to climate risks.
In order to factor transition risks into its strategy and reduce its impact on climate change, the Group has developed a decarbonisation programme for its operations.
Policy name Description of the policy Scope of application Person responsible for
operational implementation
of the policyThink Tomorrow 2022-2025 CSR Roadmap The roadmap defines the Group’s approach to contributing to the mitigation of climate change Group Management Board with the support of the Group Sustainability, Compliance and Risk Department Reducing the Group’s environmental footprint is one of the three pillars of Rubis’ 2022-2025 CSR roadmap. Among the priorities of this area is the reduction of the Group’s greenhouse gas emissions. They are mainly generated by the Energy Distribution division, which represents 99.9% of Scopes 1 and 2 emissions, as well as more than 99.5% of Scope 3 emissions.
The Energy Distribution division has carried out an in-depth study, in collaboration with a specialised firm, in order to define a decarbonisation trajectory for Scopes 1, 2 and targeted 3A. This study was based on a comparison between decarbonisation trajectories that limit global warming to below +1.5°C and the strategic and technical feasibility of deploying a decarbonisation plan, with the involvement of the various functions and departments of the division. In 2024, the Group decided to partially revise its objectives, following the implementation of the first steps of its decarbonisation plan and after having updated its analysis of the technological progress and the Group’s development plans.
Thus, decarbonisation targets are now associated with clearly identified decarbonisation levers that are aligned with the Group’s development strategy. Rubis has two key objectives:
- reduce its Scopes 1 and 2 emissions by 20% between 2019(1) and 2030;
- reduce its targeted scope 3A emissions by 20% between 2019 and 2030 (Energy Distribution scope, including outsourced shipping and road transport, business travel and upstream electricity, i.e., 45% of Scope 3A of the Energy Distribution division in 2019).
The current decarbonisation targets have been validated by the Management Board and cover 100% of the Group’s Scopes 1 and 2 and 45% of Scope 3A (excluding emissions related to the use of sold products) in 2019. These targets are compatible with the future evolution of the technologies and markets envisaged by the Group. Decarbonisation actions and their underlying assumptions are detailed in the following sections of this report. To date, the decarbonisation trajectory has not been subject to an external assurance mission and is not aligned with a scenario limiting global warming to 1.5°C.
The effectiveness of the Group’s decarbonisation plan is measured and assessed on a regular basis, in particular by the governance bodies (see section 4.2.1.2.1). More specifically, an annual assessment is carried out on the basis of the update of the Group’s carbon assessment, accompanied by an analysis of the progress of decarbonisation actions and their impacts.
The Energy Distribution division has drawn up an action plan to achieve its decarbonisation objectives. It was designed with the subsidiaries and the functional departments, with the support of consultants specialised in each of the Company’s key business lines (land transport, shipping, refining, storage site management). Emission reduction targets specific to the entities have been progressively defined on the basis of this consolidated action plan, which covers the 2019-2030 period. The Group’s decarbonisation trajectory takes into account changes in volumes sold in the short and medium term as well as various levers such as the use of biofuels to reduce emissions in the Group's operations.
The Photovoltaic Electricity Production activity represents less than 0.5% of the Group’s GHG emissions, but it nevertheless takes care to manage its carbon footprint.
- The year 2019 is considered representative of the Group’s operational activity and has been used as the reference year for the definition of greenhouse gas reduction targets.
Objective Metrics 2019
Reference
year2030
Target year% reduction Scope Reduce the carbon footprint of the Group’s operations CO2 e emissions (Scopes 1, 2, in absolute value) 297 kt CO2 e 237 kt CO2e 20% Group(1) Reduction of targeted scope 3A emissions Targeted scope 3A CO2 e emissions in absolute value 91 kt CO2 e 73 kt CO2e 20% Energy Distribution division targeted scope 3A emissions including outsourced shipping and road transport, business travel and upstream electricity (45% of Scope 3A(2)) - Corresponds to 100% of the Group’s Scopes 1 and 2 emissions. Scope 2 emissions are calculated using the location-based method.
- Targeted scope 3A emissions correspond to 45% of 2019 Scope 3A emissions and 0.5% of 2019 Scope 3 emissions.
The Group’s absolute emission reduction targets do not fully reflect its operational decarbonisation efforts, as business growth has an upward impact on Scopes 1 and 2 emissions. In 2024, the Group therefore chose to monitor an additional metric to better measure its decarbonisation efforts. Since that year, the target of reducing absolute emissions has been supplemented by the monitoring of a metric taking into account the Group’s level of activity.
This new metric takes into account Scopes 1 and 2 emissions, adjusted for variations related to the volumes of sold products. It measures the impact of the decarbonisation actions of the Group’s operations while neutralising the effects of fluctuations in sales volumes. This metric, called isoactivity, is calculated with reference to 2019 sales volumes. The target of reducing absolute emissions of Scopes 1 and 2 by 20% between 2019 and 2030 should correspond to a decrease in emissions at isoactivity on the same scope of 40%.
Since 2019, Rubis has been assessing all its greenhouse gas (GHG) emissions, including those related to its sold products.
Initially carried out using the Ademe methodology and in accordance with the ISO 14064-1 standard, this assessment was refined in 2021 in accordance with the GHG Protocol. The emission factors used are taken from recognised sources (see 4.6.2.3). The carbon footprint assessment of the Group’s Photovoltaic Electricity Production activity has been carried out since 2022, the year of its acquisition by Rubis, also in accordance with the GHG Protocol.
Changes and adjustments to methodology for past emissions (including the 2019 reference year) and projected up to 2030
- In order to ensure that greenhouse gas emissions reporting complies with the GHG Protocol and the CSRD, the Group has adjusted its scope of consolidation to make it compliant with the operational control methodology as required by ESRS E1. Until now, the Group used one of the options provided by the GHG Protocol, namely the inclusion of entities not consolidated under full integration in the financial scope, based on the ownership rate (Group share). This adjustment had an impact on the absolute value of emissions (for Scopes 1 and 2 between +11% and +15% of emissions reported between 2019 and 2024, i.e., +24 to +37 ktCO2e). However, it has no impact on the objectives, nor on the Group’s ability to achieve them. These adjustments also have little impact on the variations in emissions between 2019 and 2024 and on projected emissions variations between 2019 and 2030.
- The Group has also made adjustments to its emissions calculation methodology to better align it with other benchmarks, such as the EU ETS. These adjustments had little impact on past and present emissions and on the projections up to 2030 (< 5% for Scopes 1 and 2);
- The Group also reviewed the scope 3B emissions reporting scope, corresponding to category 11 emissions related to sold products, and included certain volumes excluded from the reporting scope. This scope adjustment has an impact of between +3 and +4 MtCO2e on scope 3B.
Retrospective Key years and objectives Emissions item(1)
(in ktCO2 e)2019
Reference
year2023 2024 %
2024/20232030 Reduction in %
vs reference
yearScope 1 GHG emissions 287 284 271 -5% - - Energy Distribution 287 283 271 -5% - - Photovoltaic Electricity Production N/A 0.20 0.23 +14% - - Scope 2 GHG emissions (location based) 9.2 9.2 11.1 +20% - - Energy Distribution 9.2 9.1 11.0 +20% - - Photovoltaic Electricity Production N/A 0.06 0.09 +47% - - Scopes 1 and 2 GHG emissions (location based) 297 293 282 -4% 237 -20% Scopes 1 and 2 GHG emissions location-based at isoactivity(2) 297 281 259 -8% - - Targeted scope 3A GHG emissions
(Energy Distribution, outsourced shipping and road transport, business travel and upstream electricity)
91 74 88 +18% 73 -20% Scope 3A GHG emissions(3) 197 278 248 -11% - - Energy Distribution 197 234 178 -24% - - Photovoltaic Electricity Production N/A 44 69 +59% - - Scope 3B GHG emissions 18,193 17,382 18,125 +4% - - Energy Distribution 18,193 17,379 18,124 +4% - - Photovoltaic Electricity Production N/A 2.5 1.6 -36% - - Scope 3 GHG emissions 18,390 17,659 18,373 +4% - - TOTAL GHG EMISSIONS (SCOPES 1 + 2 + 3) 18,686 17,952 18,655 +4% - - - The data presented in the table are exact values, rounded to a sufficient number of significant figures to facilitate reading and understanding, particularly with regard to their variations. As a result, the sum of the data does not always exactly match the total displayed, which remains an exact value. This same effect can also be observed in the variations in data between several years.
- Scopes 1 and 2 emissions adjusted for 2019 sales volumes in m3. Volumes sold include all products distributed by the Group, in particular unbranded LPG, as well as the amounts from the bitumen trading activities.
- Includes emissions from the following Scope 3 categories: category 1 – Purchased goods and services, category 2 – Capital goods, category 3 – Activities in the fuel and energy sectors (not included in scopes 1 and 2), category 4 – Upstream transport and distribution, category 5 – Waste generated during operations, category 6 – Business travel.
Scopes 1 and 2 emissions decreased between 2023 and 2024. Although the Group’s activities increased, emissions decreased, in particular following reduced operating levels at the SARA refinery and, to a lesser extent, the use of biofuels.
Targeted scope 3A emissions increased between 2023 and 2024, mainly due to the increase in volumes sold by the Group, which led to an increase in outsourced shipping and land transport activities.
Retrospective Key years and objectives Emissions item(1)
(in ktCO2 e)2019
Reference
year2023 2024 %
2024/20232030 Reduction in %
vs reference
yearScope 1 GHG emissions 287 284 271 -5% - - Percentage of Scope 1 GHG emissions resulting from regulated emission trading schemes(2) 38.9%(3) - - Scope 2 GHG emissions (location-based) 9.2 9.2 11.1 +20% - - Scope 2 GHG emissions (market-based) NA NA 11.3 NA - - Share of emissions linked to instruments such as guarantees of origin or renewable energy certificates NA NA 0% - - Scope 3 GHG emissions 18,390 17,659 18,302 +4% - - Cat. 1 – Purchased goods and services 45 74 89 +19% - - Cat. 2 – Capital goods 19 83 36 -57% - - Cat. 3 – Activities in the fuel and energy sectors (not included in Scopes 1 and 2) 42 45 35 -22% - - Cat. 4 – Upstream transport and distribution 85 68 81 +19% - - Cat. 5 – Waste produced during operations 1 2.0 1.7 -16% - - Cat. 6 – Business travel 4 5 6 +16% - - Cat. 11 – Use of sold products 18,193 17,382 18,125 +4% - - Total GHG emissions - - Total GHG emissions (location-based) 18,686 17,952 18,584 +4% - - Total GHG emissions (market-based) NA NA 18,584 NA - - - The data presented in the table are exact values, rounded to a sufficient number of significant figures to facilitate reading and understanding, particularly with regard to their variations. As a result, the sum of the data does not always exactly match the total displayed, which remains an exact value. This same effect can also be observed in the variations in data between several years.
- See definition in section 4.5.7.1.1.
- Data provided on a provisional basis, subject to change following future audits.
Biogenic CO2 emissions result from natural biological processes, such as the breathing of living organisms and the degradation of organic matter. Although these emissions are significant, they are part of the natural carbon cycle, where the CO2 emitted is generally reabsorbed by plants. They therefore have no net impact on carbon accumulation in the atmosphere, unlike CO2 emissions from fossil fuels.
The Group’s biogenic CO2 emissions come from the combustion of biofuels, directly by the Group’s assets or by players in its value chain.
Breakdown of scopes 1, 2 and 3 Breakdown of scopes 1, 2 and 3
excluding emissions related to the use of sold products
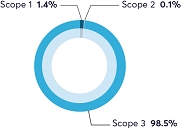
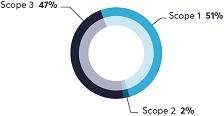
The Energy Distribution division accounts for 99.9% of Scopes 1 and 2 emissions. These emissions are mainly from refining activities (37.2%) and shipping (47.1%).
- in the numerator, emission data for Scopes 1, 2 and 3, respectively location-based and market-based from the previous section;
- in the denominator, the net turnover data reported in chapter 7 of the consolidated income statement.
Rubis mainly consumes energy to supply its fixed and mobile facilities. It is connected to local electricity grids and the electricity used is generally derived from the energy mix specific to each country where the Group operates.
Energy consumption and mix (in MWh)(1) 2023 2024 1) Fuel consumption from coal and coal products Data not available for 2023. The reporting of these indicators began in 2024. 0 2) Fuel consumption from crude oil and petroleum products 980,894 3) Fuel consumption from natural gas 32,275 4) Fuel consumption from other fossil sources 0 5) Consumption of purchased or acquired electricity, heat, steam, or cooling from fossil sources 339,882 6) Total fossil energy consumption (sum of lines 1 to 5) 1,353,051 Share of fossil sources in total energy consumption 98.4% 7) Consumption from nuclear sources 1,702 Share of consumption from nuclear sources in total energy consumption 0.1% 8) Fuel consumption from renewable sources, including biomass (also comprising industrial and municipal waste of biological origin, biogas, renewable hydrogen, etc.) 9,159 9) Consumption of purchased or acquired electricity, heat, steam, and cooling from renewable sources 9,792 10) Consumption of self-generated non-fuel renewable energy 1,380 11) Total renewable energy consumption (sum of lines 8 to 10) 20,330 Share of renewable sources in total energy consumption 1.5% Total energy consumption (sum of lines 6 and 11) 1,375,084 - The data presented in the table are exact values, rounded to a sufficient number of significant figures to facilitate reading and understanding, particularly with regard to their variations. As a result, the sum of the data does not always exactly match the total displayed, which remains an exact value. This same effect can also be observed in the variations in data between several years.
The decarbonisation strategy of the Group’s operations is based on the use of energies with a lower carbon footprint such as solar energy or biofuels. The share of renewable energies in the Group’s energy mix is therefore expected to increase in the future. The various decarbonisation levers planned by the Group are presented in section 4.2.1.4.1.4.
Energy consumption associated with Scope 2 2023 2024 Total energy consumption (in MWh) Data not
available
for 2023.
The reporting
of these indicators
began in 2024.352,755 Share of energy consumption grouped with contractual instruments such as guarantees of origin or renewable energy certificates 0% Share of contractual instruments such as guarantees of origin or renewable energy certificates not grouped with energy purchases 0% The contractual instruments used to guarantee the origin of the energy consumed include guarantees of origin. These are not significant in terms of the Group’s total energy consumption.
All of the Group’s activities have a strong climate impact. This includes both those likely to contribute to climate change and those that contribute to its mitigation. Activities linked to the Group’s strategy of diversifying towards less carbon-intensive energies (see section 4.2.1.4.2) are also considered as activities with a strong climate impact.
Energy intensity by net revenue 2023 2024 Change Total energy consumption from activities in sectors
with a high climate impact (in GWh)Data not available for 2023. The reporting of these indicators began in 2024. 1,375 NA Total energy consumption from activities in high climate impact sectors by net revenue from activities in high climate impact sectors (in MWh/€k) 0.21 Emission variation
factor (2019-2024)Change
2019-2024
(in ktCO2 e)Details Increased sales volumes +21 Since 2019, the volumes of products distributed by the Group have increased, mechanically resulting in an increase in the Group’s activities, particularly in shipping and Retail & Marketing, and therefore an increase in Scopes 1 and 2 emissions. Decline in shipping (19) This reduction in emissions is the result of a change in the Group’s sourcing model in 2020. Change in SARA operating conditions and energy efficiency levers (16) SARA emissions vary each year depending on the operational conditions of the refinery. In 2024, lower operating conditions led to a decrease in fuel consumption, which partly explains the decrease in emissions observed. Actions to improve the energy efficiency of certain equipment also contributed to this reduction in emissions. Gradual incorporation of biodiesel in the Group’s boilers and in the maritime and land fleet (1) This reduction in emissions corresponds to the Scope 1 biogenic emissions reported in the table in section 4.2.1.4.1.3. Emission variation
factor (2019-2024)Change
2019-2024
(in ktCO2 e)Details Reduction in emissions from outsourced land transport (9) Establishment of partnership relationships with service providers to encourage them to gradually renew their land fleet, to train drivers in eco-driving and to optimise routes. Increased shipping activity +4 The increase in volumes sold led to an increase in outsourced shipping and an increase in emissions.
These emissions have also increased with the adaptation of certain logistics chains serving certain regions.Increase in business travel emissions +2 Business travel increased between 2019 and 2024, resulting in an increase in associated emissions. (in thousands of euros) CapEx 2024 OpEx 2024 Expenses for oil-related economic activities 230,662 84,525 Expenses to decarbonise the Group’s operations Total 2,956 31 Taxonomy-aligned (6.5, 7.4, 7.7) 1,820 3 Other decarbonisation investments 1,135 28 Diversification expenditure Total 109,214 6,993 Taxonomy-aligned (4.1, 7.6) 109,211 6,990 Other diversification investments 3 3 TOTAL GROUP 342,832 91,549 In accordance with the requirements of DP 16-d, locked-in emissions correspond to emissions related to existing or planned assets, generating greenhouse gas emissions until 2030 and 2050.
Rubis conducted a qualitative assessment of its Scopes 1 and 2 locked-in emissions. They are mainly generated by its refining and shipping activities. The assets related to these emissions include the refinery as well as the vessels belonging to the Group and used for shipping the Group’s products. The remaining transport needs are covered by long-term charter vessels, with the end of lease date not beyond 2030. However, a renewal of these contracts is likely.
The life of the refinery and vessels owned by the Group is between 20 and 30 years and the end of life of most of these assets is expected after 2030. Most of these assets will emit direct emissions beyond 2030.
Section 4.2.1.4.1.6 discusses the transition risks associated with these assets, as well as the mitigation measures put in place to limit these risks. Among these measures, the Group’s decarbonisation plan provides for actions for these assets, in order to guarantee the achievement of its objectives. These actions are essential to ensure that the Group’s locked-in emissions do not hinder the achievement of its climate targets.
Emissions related to the use of sold products by the Company represent 18.1 MtCO2e, i.e., more than 97% of total emissions. These emissions are mainly related to the combustion of energy products. Current projections for product sales by 2030 include an overall increase in sales volumes, focused on lower-carbon energies and regions undergoing economic development and transition.
Assuming that the Scope 3 category 11 emission factors remain constant and the volumes of sold products will be higher than 2024 levels in 2030, the locked-in emissions related to the use of sold products by 2030 will be greater than 18.1 MtCO2e per year.
- The data presented in the chart are exact values, rounded to a sufficient number of significant figures to facilitate reading and understanding, particularly with regard to their variations. As a result, the sum of the data does not always exactly match the total displayed, which remains an exact value. This same effect can also be observed in the variations in data between several years.
Type of activity Change in
emissions
2024-2030
(in ktCO2 e)Lever Change in
emissions
2024-2030
(in ktCO2 e)Cumulative
CapEx
2025-2030Cumulative
OpEx
2025-2030SARA +36 Change in operational conditions +16 €45 –
55 million€110 –
130 millionShipping Increase in activities +20 SARA (35.3) Using biofuels (16) Process electrification (12) Energy efficiency (7) Solarisation of assets (0.3) Shipping (45) Use of biofuels and process optimisation (45) Retail & Marketing (0.4) Decarbonisation actions (0.4) The Group has defined a decarbonisation plan that will enable it to achieve its Scopes 1 and 2 emissions reduction targets by 2030.
The financing of the decarbonisation plan is included in the Group’s business plan and is valued at:
- €45 to €55 million in cumulative CapEx between 2025 and 2030;
- €110 to €130 million in cumulative OpEx between 2025 and 2030.
The impact of this decarbonisation plan is estimated at between -€30 and -€50 million in cumulative EBITDA between 2025 and 2030.
Estimates of OpEx, CapEx and the impact on EBITDA of the decarbonisation plan are notably based on assumptions concerning the evolution of markets and regulations up to 2030. This includes market trends, carbon taxes, biofuel costs and regulations by 2030. The actual impact on CapEx and OpEx, as well as the effect on EBITDA, will thus depend on the assumptions made as part of the decarbonisation plan and the associated uncertainties. In addition, the deployment of decarbonisation actions will be done gradually between 2025 and 2030, with an increasing impact on the EBITDA during this period. Indeed, in view of the inertia of the implementation of certain decarbonisation actions, the decarbonisation trajectory between 2019 and 2030 planned by the Group is not linear but accelerates at the end of the period to achieve the objectives.
The decarbonisation of the Group’s Scopes 1 and 2 is planned for the following three main types of assets:
In 2024, emissions from the Scopes 1 and 2 of assets decreased, mainly due to changes in the operating conditions of the refinery. Future emissions may also fluctuate depending on changes in asset operating conditions.
The Group aims to decarbonise SARA emissions via a decarbonisation plan between 2019 and 2030. This decarbonisation is managed by a task force and a dedicated roadmap. The plan is composed of the following four pillars:
- the integration of biofuels in the refining process: the integration of biofuels for the production of electricity and steam allows a rapid decarbonisation of the refinery’s Scope 1. This lever takes the form of the integration of B30, B100 and HVO to replace the standard reformate;
- the electrification of equipment: this lever is reflected in the modification of steam-consuming equipment, in particular from certain combustion turbines, by electric motors;
- energy efficiency: these are actions enabling better control of energy consumption. Mainly used in the refinery, this lever consists of measures to reduce steam leaks, insulate lines monitor and improve consumption, reduce steam consumption, etc.;
- the installation of photovoltaic panels on the roofs of the terminals. This solution is preferred for the terminals located in Guadeloupe and French Guiana in order to reduce Scope 2 emissions.
The achievement of SARA’s decarbonisation targets will depend, in particular, on the work that will be carried out during the intermediate shutdowns and during the major shutdown scheduled for 2027.
By 2030, the Group expects an increase in its volumes sold, which will require an increase in operational activities, particularly those relating to shipping. To contain and control the increase in associated emissions, the Group plans to partially decarbonise its shipping activities by relying on two levers:
- process optimisation: in particular thanks to the optimisation of routes, controls and monitoring of the heating of the bitumen transported to reduce the consumption of the bunkers;
- the use of biofuels: the Group has already experimented with the use of certain biofuels for its vessels. Among those tested are HVO (Hydrotreated Vegetable Oil) and biodiesel. The latter is used in blends with traditional fuel up to a maximum rate of 30%. These fuels all incorporate some biomass, thus reducing combustion emissions. All fuels used are certified by third-party organizations such as ISCC, and each biofuel purchased is accompanied by documentation certifying its origin and greenhouse gas emissions.
Emissions from the Retail & Marketing activity are expected to decrease by 2030. The activity represents a small share of the Group’s Scopes 1 and 2 emissions. Nevertheless, the implementation of decarbonisation plans and actions has been planned.
One of the decarbonisation levers for this activity is the solarisation of depots and administrative premises. In 2024, the solar powering of our assets intensified via the installation of photovoltaic panels on subsidiaries’ buildings, representing the equivalent of 2 MWp installed. The solarisation rate of assets is increasing and will intensify in the coming years.
With regard to the impact of land transport, an important component of the Retail & Marketing activity, some subsidiaries have started to use biofuels for their logistics fleet. This initiative should be strengthened to reduce the impact of product distribution. In addition, operations to optimise delivery rounds, the renewal of fleets towards less fuel-consuming vehicles and the training of drivers in eco-driving will continue in the coming years.
Finally, to decarbonise their light vehicle fleet and when conditions are right, some entities are gradually converting their fleet to hybrid or electric vehicles.
Between 2019 and 2024, targeted scope 3A emissions decreased by 3 ktCO2e. The Energy Distribution division has defined a decarbonisation plan to achieve its targeted scope 3A emissions reduction targets by 2030. The targeted scope 3A emissions come mainly from land and sea transport and, to a lesser extent, from business travel and upstream electricity.
The Group is still working on quantifying the impacts and resources related to its targeted scope 3A decarbonisation plan. As the levers rely mainly on the partners in its value chain, the resources required to deploy these reduction levers are complex to assess. This subject will be reviewed in the coming years.
To support its investment decision-making, in 2022 Rubis defined a methodology for using an internal carbon price (ICP), whose gradual implementation began in 2023 and continued in 2024. The teams are gradually adopting this tool, whose implementation meets several challenges:
- anticipating changes in external carbon prices;
- contributing to the achievement of the Company’s decarbonisation objectives. The ICP is a strategy support tool that prioritises low-carbon investments or promotes lower-carbon options in operational practices;
- raising awareness among management and teams of climate issues in decision-making criteria and risk assessment, particularly in countries not directly subject to a carbon market.
The approach adopted for the application of the ICP is based on the principle of shadow price or guide price via which an economic value attributed internally to carbon is integrated into investment decisions by affecting the expected profitability of a project and highlighting the associated carbon risk.
The ICP is involved in decision-making relating to the diversification strategy. This approach is particularly suited to Growth Capex and the acquisitions that the Energy Distribution division plans to make.
The ICP mechanism is primarily driven by the risk analysis associated with the implementation of carbon taxes, which vary in maturity depending on the country. The application of differentiated prices by region was deemed the most relevant approach, given the geographical locations of the Energy Distribution division. The division thus determined ICP values according to the region based on:
- the carbon price projections established by the IEA broken down by region: advanced economies, selected emerging market and developing economies and other emerging market and developing economies;
- carbon price trends observed in the European market’s Emissions Trading System (ETS).
Types of internal carbon pricing Volume
concernedPrices applied for 2024-2025 Description
of the scopeShadow CapEx price N/A* US$3-15/tCO2e for the least developed countries, US$45-90/tCO2e for developing countries and US$100-130/tCO2e for developed countries N/A* Shadow price of investment in research and development (R&D) N/A* N/A* Internal carbon fee or fund N/A* N/A* Carbon price for impairment tests N/A* N/A* * For 2024, the internal carbon pricing mechanisms were tested on a key investment project, with a low impact on the Group’s emissions. Rubis plans to roll out this mechanism more widely in the second period of its decarbonisation plan, between 2025 and 2030. At this stage, Rubis has not made a commitment to contribute to global neutrality. The Group makes very limited use of contribution actions, only in certain well-defined contexts, but does not wish to base its climate strategy on this mechanism. Above all, the Group strives to implement measures to reduce its emissions and diversify its activities. The few projects that contribute to carbon neutrality are selected by taking into account the co-benefits and the involvement and local presence of a subsidiary.
If the Group is required to use carbon credits, these are reported separately from the information on Scopes 1, 2 and 3 GHG emissions and separately from its GHG emission reduction targets.
To date, only the Vitogaz France subsidiary is carrying out a carbon offset project (low-carbon label with the ONF) and the project takes place outside the entity’s own operations.
In 2020, Vitogaz France established a partnership with the company WeNow and the National Forestry Office (ONF) to finance three reforestation projects in Auvergne-Rhône-Alpes. These projects, covering a total area of 25 hectares, are certified low-carbon by the French Ministry for the Ecological Transition. Their aim is to restore the region’s degraded public forests, by replanting trees, supporting the growth of existing forests and protecting fragile forest ecosystems. These initiatives will contribute to the absorption of atmospheric CO2 through natural carbon sinks.
The volumes of carbon absorbed are estimated using the calculation methods validated by the Low-Carbon Label, which includes the risks related to the permanence of carbon capture. The CO2 capture resulting from these reforestation projects is assessed over a period of 30 years, with a total estimate of 1,650 tCO2e.
For the 2024 reporting period, no carbon credits have been cancelled and the Group does not yet report tonnes of greenhouse gases offset. The first issuance of carbon credits from these projects is scheduled between the end of 2026 and 2027 after approval by the Ministry for the Ecological Transition and an audit, for a volume of 367 tCO2e. The second credit issue, for a volume of 1,283 tCO2e, is scheduled for 2027.
The total volume of CO2 sequestered thanks to this project corresponds to approximately three years of Scopes 1 and 2 emissions of the Vitogaz France entity.
Gross transition risks are presented in section 4.2.1.4.1.1. To reduce these risks, the Group is implementing adaptation actions presented in the table below.
Type of risk Scope Adaptation or mitigation
actionsTime horizon and progress made Group resilience Decline in LPG demand in Europe Energy Distribution Retail & Marketing Europe • Market share capture in traditional markets
• Development of LPG as an alternative fuel
• Development of complementary activities
Horizon: 2025-2030
Progress: analysis of opportunities for the development of complementary activitiesHigh
The decrease in volumes will be partly offset by the development of new offersDecline in demand for road fuel in Europe Energy Distribution Retail & Marketing Europe • Development of offers not related to fuel
Horizon: 2025-2030
Progress: analysis of opportunities for the development of complementary activitiesVery high
The decrease in volumes will be partly offset by the development of new offersAccess to and increased cost of financing Energy Distribution • Construction of the Group’s transition plan
• Establishment of disintermediated financing and expansion of the pool of banks
Horizon: 2025-2030
Progress:• construction of the Group’s transition plan
• establishment of disintermediated financing and expansion of the pool of banks
High
Access to loans is more difficult but adaptation actions limit the impact on EBITDACost of decarbonisation Energy Distribution Europe • Cost assessment of the Group’s decarbonisation plan
• Deployment of decarbonisation levers
Horizon: 2025-2030
Progress:• integration of the decarbonisation plan into the Group’s strategic plan
• details of the decarbonisation plan in section 4.2.1.4.1.4
High
See section 4.2.1.4.1.4Carbon markets and carbon tax Energy Distribution Support & Services • Estimation of the associated costs, taking into account certain exemptions from certain ultra-peripheral operating regions (Guadeloupe, French Guiana)
• Decarbonisation of the activities concerned
Horizon: 2025-2030
Progress:• incorporation of additional costs in the Group’s transition plan
• analysis of the impact of carbon markets on the Group’s OpEx
• creation of an internal carbon price
High
See section 4.2.1.4.1.4The Group believes it is highly resilient to transition risks by 2030 thanks to the adaptation actions it is implementing. The net financial impact of transition risks is therefore considered low by 2030.
4.2.1.4.2 DIVERSIFICATION INTO RENEWABLE AND TRANSITIONAL ENERGIES, IN ORDER TO OFFER PRODUCTS WITH A LOWER CARBON FOOTPRINT
Transition opportunities related to climate change mitigation were analysed on the basis of the IEA NZE +1.5°C by 2030 scenario.
The energy transition provides the Group with the opportunity to innovate and develop products and services adapted to local and regional realities, in line with international frameworks such as the Paris Agreement.
However, this transition is not homogeneous, each region in which the Group operates presents specific challenges, which requires a differentiated and local approach.
The Group has identified transition opportunities with the development of solutions to actively contribute to the transition to a less carbon-intensive economy.
Opportunity Scope Description Potential financial impact Market opportunity
Increased LPG demand in AfricaEnergy Distribution Retail & Marketing Africa The democratisation of the domestic use of LPG as a transitional energy could stimulate market growth, as the International Energy Agency anticipates. In addition to climate issues, this energy can provide environmental and social benefits by replacing firewood and kerosene, for example. Opportunity +1.5°C scenario: very high
Opportunity Rubis scenario: very high
Potential financial consequences: increase in LPG sales for transitional usesMarket opportunity Development of the portfolio of photovoltaic facilities Group The French energy and climate strategy provides for strong growth in Photovoltaic Electricity Production by 2030.
More generally, Photovoltaic Electricity Production is expected to expand in the regions where the Group operates by 2030.Opportunity +1.5°C scenario: high
Opportunity Rubis scenario: high
Potential financial consequences: development of the portfolio of photovoltaic offersMarket opportunity Development of electricity storage solutions Group In a transition scenario, the IEA forecasts global growth in the battery market. Opportunity +1.5°C scenario: high
Opportunity Rubis scenario: high
Potential financial consequences: development of new activitiesPolicy name Description of the policy Scope of
applicationPerson responsible for operational
implementation of the policyThink Tomorrow 2022- 2025 CSR Roadmap The roadmap presents the approach to diversifying the Group’s activities, in particular via the development of renewable energies Group Management Board with the support of the Sustainability, Compliance and Risk Department The diversification of the Group’s activities is based on two key pillars of the Group’s CSR roadmap strategy:
- promoting the energy transition in its markets by developing the distribution of energies with a lower carbon footprint and thus reduce the carbon intensity of the sold products;
- complementing its historical businesses by seeking investments in renewable energies.
Achieving these two challenges involves, on the one hand, the diversification of the Retail & Marketing activities of the Group’s Energy Distribution division to develop less carbon-intensive offers in its markets and, on the other hand, the development of Photosol (photovoltaic electricity producer) acquired in April 2022.
The Energy Distribution division is already present in the LPG markets in Africa and plans to strengthen its role in the energy transition by developing the supply of LPG as a cleaner and less carbon-intensive alternative energy. This fuel can replace polluting energies such as kerosene, coal or wood from deforestation, in particular for specific uses such as clean cooking (see section 4.3.4.5.2).
According to the IEA, the LPG market could experience sustained growth between 2023 and 2050 in an NZE scenario, subject to strengthened political will and the removal of certain operational obstacles. For example, although the distribution of LPG is still marginal in Madagascar, per capita consumption remains low, offering strong growth prospects for the market. The Energy Distribution division plans to develop its LPG offers in Africa to capture market share in countries where demand is growing strongly.
In line with its DNA, the Group favours a decentralised approach to identifying solutions adapted to the specific characteristics of each local environment. These projects are being developed around the following themes:
Current production of alternative fuels is expected to increase over the next 10 years. In this context, the Energy Distribution division’s roadmap focuses on a limited number of molecules, offering low-carbon alternatives to its historical portfolio such as Sustainable Aviation Fuel (SAF) or biodiesel.
The Energy Distribution division has identified the development of photovoltaic solutions as an opportunity to expand its portfolio of offers for commercial and industrial customers.
The division will offer its customers the opportunity to develop, build and operate photovoltaic installations from 100 kWp to 4,000 kWp on roofs, on parking shades or on unoccupied land.
These photovoltaic energy solutions complement and expand existing offers (liquefied gas, road fuels, aviation and marine fuels, commercial heating oil, lubricants) and meet the division’s desire to support its customers in their energy transition and the electrification of certain uses.
Moreover, the division plans to seize opportunities to develop low-carbon activities with offers specific to its local markets. These offers may, for example, include the production of decarbonised electricity and steam, based on energy sources other than biofuels or photovoltaics.
The Group has set itself ambitious objectives to guide its development strategy for its Photovoltaic Electricity Production activity by 2027:
Rubis’ diversification strategy is based, among other things, on the production of renewable energy. The table below shows the Group’s renewable and non-renewable energy production.
The production of non-renewable energy mainly corresponds to production and self-consumption activities of the Group’s refinery. On this site, the refinery uses by-products from its industrial processes to power two boilers and a cogeneration turbine.
Renewable energy production corresponds to the production of solar electricity, of which 99.8% comes from the Group’s Photovoltaic Electricity Production activity.
As a producer of photovoltaic electricity, the Group contributes to the energy transition by providing low-carbon energy to the regions. The Photovoltaic Electricity Production activity retains ownership of the facilities and operates them throughout their lifetime. In 2024, 94,250 households(1) were supplied with electricity from renewable sources by its solar installations (vs 96,750 in 2023). The photovoltaic electricity production (460 GWh in 2024) thus helped avoid 224,900 tCO2e(2) (vs 230,800 in 2023).
The division is developing its diversification approach for its two main focuses via the deployment of several projects. The resources required for this diversification approach are still being assessed.
The division is studying opportunities to develop low-carbon molecules in the regions where it operates.
A first biodiesel project based on the collection of used cooking oil is being developed in the Caribbean region and should enable the production and sale of biofuels in small quantities in this region.
- Estimate – Factor applied to electricity production, according to the unit consumption of main residences excluding heating, published by ADEME: key figures 2018 – climate, air and energy.
- Estimate – Factor applied to electricity production, based on the assessment of CO2 avoided by solar and wind electricity, published by RTE in the note “Details on CO2 footprint assessments”. Methodology: reference scenario reflecting the merit order simulated in the Europe zone by RTE.
The division has set up three strategic partnerships to support C&I customers in their energy transition by offering an offer for the solarisation of their assets:
- Photosol Mobexi, in Europe, will support Vitogaz France, Rubis Antilles Guyane and SRPP on Reunion Island. the Energy Distribution division will thus capitalise on the know-how of its sister company Photosol;
- Soléco Energy, in the English-speaking Caribbean, will enable Rubis Eastern Caribbean’s various subsidiaries (Jamaica, Barbados, The Bahamas, Bermuda, etc.) to expand their portfolio of multi-energy offers;
- Solarise Africa, in East Africa, will initially support Rubis Energy East Africa in Kenya, Uganda and Rwanda before rolling out to other countries in the region.
The project portfolio represents 30 MWp of capacity that can be deployed in the short term and a potential of around 100 MWp by 2030.
An additional step was taken in the Energy Distribution division’s diversification strategy with the launch of an offer to install and operate vehicle charging infrastructure in the French Antilles Guyane region.
This solution is mainly intended for companies, administrations and local authorities with a fleet of vehicles. The electric mobility offer thus meets the decarbonisation challenges of professionals and complements the existing fuel offer of the Rubis Antilles Guyane subsidiary. This offer is in line with companies’ need for flexibility in managing their vehicle fleet by offering:
- an app to locate recharging points and manage vehicle recharging;
- an online fleet management solution to manage usage and manage recharging budgets;
- payment solutions adapted to the policies of each company;
- access to a large network of charging stations;
- terminals adapted to customer uses and the vehicle fleet.
In 2022, Rubis acquired the company Photosol, allowing it to accelerate its transition to renewable energies and decarbonisation. With a secured portfolio of 1.1 GWp, as well as 5.4 GWp of projects under development, Rubis Photosol is one of the leading developers of photovoltaic electricity in France.
In 2024, 32% of the CapEx invested by the Group was dedicated to Photovoltaic Electricity Production projects, corresponding mainly to eligible activities and aligned with the taxonomy.
Opportunity Scope Actions Time horizon
and progress madeNet financial
impactIncreased LPG demand in Africa Energy Distribution Retail & Marketing Africa Securing Rubis’ market share in high-growth markets Horizon: 2025-2030
Progress: see section 4.2.1.4.2.2High Development of the portfolio of photovoltaic facilities Group Develop the Photovoltaic Electricity Production activity.
Develop photovoltaic offers in the markets where the Energy Distribution division is locatedHorizon: 2025-2030
Progress: see sections 4.2.1.4.2.3 and 4.2.1.4.2.4High The Group’s diversification strategy towards energies with a lower carbon footprint, notably through investment in renewable energies (photovoltaic electricity) is a key lever for mitigating transition risks. By investing in technologies and products in line with the energy transition, Rubis can anticipate the slower growth in fossil fuel-related activities beyond 2030 in certain geographical areas (particularly in Europe) while capturing new growth opportunities.
Rubis carried out an assessment of the physical risks related to climate change to which its assets and activities would be exposed with the help of a specialised consulting firm. At this stage, the analysis does not cover the Group’s value chain, which will be the subject of more in-depth studies in the future.
Rubis analysed the potential impact of physical risks on its activities by 2030 and 2050, taking into account a strong +4°C warming scenario (IPCC RCP 8.5). The data used to model the evolution of climate risks are taken from the IPCC CMIP 5 model.
The main consequence of an acute or chronic climate hazard on the Group’s assets would be an interruption or slowdown in the Group’s own operations and its value chain.
The analysis of climate risks was carried out on the four types of priority assets identified, on the basis of their respective geolocation:
The materiality of the impacts was estimated for each type of asset and for each type of risk according to the probability of occurrence of climate hazards and the extent of the damage potentially caused by this hazard.
The table below presents the physical risks related to climate change by type of assets and risk categories. These risks are assessed before any adaptation measures implemented by the Group. The table only mentions the physical risks that have a significant impact on certain assets. Therefore, other physical risks, such as extreme precipitation, drought, extreme cold or heat waves, were not considered significant for this study.
While gross physical risks are assessed for 2030 and 2050, the gross financial impact is only assessed for 2030 and at Group level. For example, although the risks related to hail present a moderate level of risk for the Photovoltaic Electricity Production activity, these risks are deemed not significant at Group level.
Actions to limit the physical impacts of climate events are implemented and monitored by the Group (see next paragraph).
In addition, as part of its approach to adapting to climate risks, although the Group does not yet have a dedicated formal policy, it has implemented an integrated insurance strategy to take into account the physical risks related to the climate. This approach takes the form of the creation of a captive and the use of parametric insurance adapted to the specific climate challenges that Rubis faces.
The captive allows better control of the financial risks associated with extreme weather events, by offering dedicated coverage while ensuring more flexible and targeted claims management. At the same time, parametric insurance, based on measurable indices (such as precipitation, temperature or wind), provides a rapid and predictable response in the event of climate incidents, by reducing the compensation period.
For all the risks assessed, adaptation actions, including in each case as a minimum insurance coverage, are considered sufficient to cover all physical risks to 2030, demonstrating the Group’s resilience to the latter.
The SARA refinery is exposed and vulnerable to the passage of a category 4 or 5 cyclone near Martinique (within a radius of less than 50 km). The scientific community expresses moderate confidence in the evolution of cyclonic phenomena in the Caribbean. Projections indicate an increase in their intensity, accompanied by a decrease in their frequency(1).
The maximum amount of potential damage related to the passage of a category 4 or 5 cyclone near the refinery is lower than the maximum compensation amount of the general insurance policy.
- 28% of depots are exposed to flooding risk. Pumping systems and retention basins are in place to limit the volume of water on on-site and accelerate the resumption of activities;
- 19% of depots are exposed to fire risk. To limit gasoline vapours, floating roofs have been installed in the tanks and it is also possible to interrupt the filling of the latter in the event of fire;
- 39% of depots are exposed to cyclone risk. Tanks can be filled upstream of the arrival of a cyclone to stabilise the structures and reduce potential material damage.
The maximum amount of potential damage related to the occurrence of one of these risks is lower than the maximum compensation amount of the general insurance policy. In addition, if one of its depots is affected by an extreme event, Rubis has the option of setting up alternative logistics to guarantee the continuity of its activities, the additional cost of which is covered by the insurance (under current conditions). Thus, the net financial impact of these risks is non-material for the Group.
According to the value of service stations in Rubis’ financial statements and the potential damage of an extreme weather event on a service station, only an event that simultaneously impacts a group of more than 30 service stations can have a material financial impact for the Group. The concentration of the network of service stations makes this scenario possible with regard to the risk of hurricanes in five geographical areas with a total of 188 stations. The maximum amount of potential damages is lower than the maximum compensation amount of the general insurance policy, which makes the net financial impact non-material for the Group.
-
4.3 Social
4.3.1 Providing a safe, stimulating working environment [ESRS S1]
Aware that the commitment of its employees is one of the key factors in the Group’s success, Rubis is committed to their professional development, with a view to attracting, developing and retaining its talent.
The Group implements concrete measures throughout its employees’ careers, giving priority to local recruitment, with more than 98% of the own workers hired in the region where they are based. It also invests in training, with 98,477 hours provided during the year, and rolls out initiatives to promote work-life balance.
Through decentralised social dialogue in close proximity to subsidiaries, Rubis ensures that its employees’ concerns are taken into account. It also sets up social protection schemes to preserve the health of its employees and provide support for the most vulnerable in the face of life’s hardships.
The Group applies strict occupational health and safety standards in all its subsidiaries. Its efforts focus on the protection of people and the prevention of accidents in the workplace.
The table below presents the gross impacts, risks and opportunities related to Rubis’ own workers deemed material during the double materiality assessment of 2024 (see section 4.1.3.3).
NAME
OF THE IRO


VALUE CHAIN UPSTREAM OPERATIONS DOWNSTREAM Secure employment 
Group Energy Distribution: Support & Services (shipping) ST The physical and moral well-being of the Company’s workforce could be affected in the event of an issue relating to job security Working time Group Energy Distribution: Retail & Marketing (road transport) and Support & Services (shipping) ST The physical and moral well-being of employees could be affected in the event of excessive working hours Adequate wage Group Energy distribution (some high-risk countries outside Europe and the French Overseas Departments and Collectivities) ST Compensation below the adequate wage of the Company’s employees could have an economic and social impact on the living conditions of employees Freedom of association and collective bargaining Group Energy distribution (some high-risk countries outside Europe and the French Overseas Departments and Collectivities) ST A lack of interaction between the company and its staff/representatives could deteriorate the social climate with a direct impact on the commitment and well-being of employees, whether physical, moral and/or psychological Social protection 
Group Energy distribution (some high-risk countries outside Europe and the French Overseas Departments and Collectivities) ST The introduction of more advantageous social protection than that provided by law, particularly in certain countries, helps to protect and improve the health of employees Work-life balance Group ST A lack of work-life balance could lead to a reduction in employee commitment and physical, moral and psychological well-being Health and safety Group ST A serious security/heath/safety incident related to the working environment of employees and affecting their physical integrity (illness, injury, death) could lead to a loss of confidence and commitment to the company, financial consequences for these employees, particularly in the event of inadequate social protection, and/or the deterioration of working conditions due to a destabilisation of the initial organisation Diversity and equity Group ST Discrimination related to gender, age, disability, etc. and/or unfair treatment could lead to a disengagement of employees up to their departure Training and skills development Group MT A failure to develop/adapt employees’ skills could have an impact on their professional development and employability Forced labour Group Energy Distribution: Support & Services (shipping) ST The use of practices assimilated to forced labour may result in a violation of human rights and/or undermine the fundamental freedoms of employees and non-employees Attractiveness and skills development 
Group MT/
LTA lack of HR attractiveness, skills development and/or high staff turnover could increase difficulties in recruiting qualified people and ultimately impact the Group’s performance Most of the material negative impacts for Rubis employees are considered to be systemic in the contexts in which the Group operates. Three material negative impacts relate to a specific population (secure employment, working hours and forced labour specifically affecting employees and non-employee workers in the shipping and road transport activity of the Energy Distribution division). Moreover, three material negative impacts (health and safety; diversity and equity; forced labour) are linked to isolated incidents and are not considered widespread or systemic. For example, these may be isolated cases of human rights violations in a subsidiary of the Energy Distribution division located in an area at risk in this respect, or an accident on a production site.
Among its employees, the Group has identified populations more specifically likely to be affected by negative impacts, in particular:
- women, who may still be victims of discrimination in terms of working conditions (27.8% of the own workers);
- employees working on industrial sites (including employees working in the offices) or drivers, liable to be exposed to occupational risks inherent to their activity (interactions with technical equipment and/or handling of hazardous products) (most of the workforce of the Energy Distribution division);
- employees located outside Europe, who are not covered by regulations as protective as those of the European Pillar of Social Rights (75% of the own workers);
- non employees workers in the shipping activity of the Energy Distribution division, where the nature of the activity requires the use of crews from employees on fixed term contracts (3.8% of the own workers) and temporary employment agencies (1.3% of the own workers). The use of temporary employment agencies can present potential risks, notably in terms of abusive hiring costs, non-compliance with working conditions or lack of social protection.
Lastly, the Group has identified a material risk related to attractiveness for talent and skills development that materialises differently depending on the Group’s activities:
- in the Energy Distribution division: depending on their geographical location, some subsidiaries may lack locally qualified resources due to a shortage of qualifying training courses in the region;
- in the Photovoltaic Electricity Production activity: in a context of energy transition, the renewable energy sector is particularly competitive.
Incorporation by reference 
Interests and views of the own workforce are described in the section “Interests and views of stakeholders [SBM-2]” Section 4.1.3.2 Since its creation, the Group has been built on a decentralised management model, leaving its divisions and subsidiaries in charge of initiating and implementing policies specific to the challenges of their own business. This pragmatic approach enables each entity to deploy appropriate action plans, both to anticipate and manage material risks and to seize the opportunities that arise. These actions are part of a common framework, based on the Group’s shared action principles: operating with integrity and responsibility, ensuring the safety of our operations, acting for a fair transition, and providing support for the development of our employees. These fundamental commitments, consistent with the corporate culture, are reaffirmed in the Group’s Code of Ethics.
The Group ensures the efficiency of the policies and actions implemented at its by monitoring social indicators reported annually by the subsidiaries through the Group reporting tool.
In addition, the Group has set specific targets for the sustainability issues for the Group in connection with the following IROs:Training and skills development; Diversity and Health and safety. Social targets and metrics are presented in the thematic sections of this chapter.
Policy
nameDescription of the policy Scope
of application
of the policyPerson responsible for
operational implementation
of the policyCode of Ethics The Group’s Code of Ethics establishes fundamental principles in terms of compliance with laws and regulations, working conditions and human rights. Notably, it reaffirms:
• compliance with local regulations on secure employment, working hours and minimum wages;
• the fundamental ILO agreements;
• commitment to balanced work schedules, promoting personal and professional development;
• the promotion of a health and safety culture, where each employee adopts a responsible behaviour in terms of health, safety and environmental protection;
• a diversity and inclusion policy, guaranteeing the absence of any discrimination and valuing the plurality of backgrounds;
• compliance with international commitments, notably those of the United Nations Global Compact, with particular vigilance on the fight against forced labour.
These principles make the Code of Ethics a reference framework guaranteeing responsible and fair practices at the Group.
Group Incorporated by reference Group Sustainability, Compliance & Risk Department HR Department and HSE Department of the Energy Distribution division HR Department of the Photovoltaic Electricity Production activity CSR roadmap The Group is committed to reducing personal injury accidents with lost time during operations, reducing their frequency, and maintaining a target of zero fatal accidents. Through its sustainability commitments, Rubis ensures overall coordination in terms of gender equality and the inclusion of people with disabilities, based on the objectives defined in its roadmap. Furthermore, the Group undertakes to train all its employees each year in order to anticipate changes in the sector and to back employees in adapting their skills to the jobs of tomorrow. Group Group Sustainability, Compliance & Risk Department HR Department and HSE Department of the Energy Distribution division HR Department of the Photovoltaic Electricity Production activity Policy Percen-
tage of
employees
covered by
the policy(1)Secure
employmentWorking
timeMinimum
wage(2)Freedom of
associa-
tion and
collective
bargainingSocial
protectionWork-life
balanceHealth
and
SafetyDiversity
and equityTraining
and skills
develop-
mentForced
labourCode of Ethics 100% x x x x x x x x x CSR roadmap 100% x x x HSE Charter 99.3% x Employee handbook/internal rules 58% x x x x x x x x x x Law/policy/agreement on training and skills development/equal opportunities 32.6% x x - Based on data collected from subsidiaries.
- 94% of employees receive a legal minimum wage (see section 4.3.1.5), however, some entities go beyond the minimum wage by offering additional compensation.
IRO Materiality
of the IROSignificance
of the informationPolicies Actions Targets Secure employment Group Energy distribution: Support & Services (shipping) Yes Yes No Working time Group Energy distribution: Retail & Marketing (road transport) and Support & Services (shipping) Yes Yes No Minimum wage* Group Energy distribution (some high-risk countries outside Europe and the French Overseas Departments and Collectivities) Yes Yes No Freedom of association and collective bargaining Group Energy distribution (some high-risk countries outside Europe and the French Overseas Departments and Collectivities) Yes Yes No Social protection Group Energy distribution (some high-risk countries outside Europe and the French Overseas Departments and Collectivities) Yes Yes No Work-life balance Group Yes Yes No Health and safety Group Yes Yes Yes Diversity and equity Group Yes Yes Yes Training and skills development/attractiveness and skills development Group Yes Yes Yes Forced labour Group Energy distribution: Support & Services (shipping) Yes Yes No * 94% of employees receive a legal minimum wage (see section 4.3.1.5), however, some entities go beyond the minimum wage by offering additional compensation. Rubis considers employees with a direct contractual relationship with the Group to be part of its own workforce, thus excluding contracts with third parties. Rubis distinguishes between two types of workers: employees and non employees.
Rubis’ own workforce consists of permanent employees and, to a lesser extent, temporary employees. These employees have full-time or part-time contracts. Their definitions are detailed in the methodology note presented in section 4.5. The “other” and “not declared” categories are not included in the tables, as this data was not reported by the subsidiaries. In the Energy Distribution division, in the Channel Islands, some employees have contracts with no guaranteed number of hours (representing three employees, i.e., 0.07% of the total headcount).
At 31 December 2024, the Group’s headcount consisted of: 4,375 employees, which increased 6% in 2024. The corresponding employee benefits expenses are presented in section 5.3 of the notes to the consolidated financial statements. The number of employees in the Photovoltaic Electricity Production activity increased by 59.6%, with 273 employees in 2024 compared with 171 in 2023. The data are presented as of 31 December 2024.
The Group’s business model is not based on a structural dependence on non-employee workers to ensure its activities on a continuous basis. Nevertheless, Rubis identifies some non employees among its own workforce:
- in the Energy Distribution division, the nature of the shipping activity requires the use of crews from temporary employment agencies, made up of non employee workers (58 non employee workers);
- in Kenya, due to its complementary activity of shops within its service stations, the entity used temporary workers to ensure its operations in 2024. In 2024, these employees represented a maximum of 10% of the Group’s employees, however, in 2025, the management of these shops will be gradually taken in-house, thus limiting the use of temporary workers.
France and Nigeria are the only countries with at least 50 employees representing at least 10% of Rubis’ total number of employees.
Type of contract at 31/12/2024 Women Men Total Number of employees 1,215 3,160 4,375 % of employees 27.8% 72.2% 100% Number of permanent employees 1,109 2,973 4,082 % of permanent employees 91.3% 94.1% 93.3% Number of temporary employees 106 187 293 % of temporary employees 8.7% 5.9% 6.7% Number of non-guaranteed hours employees 0 3 3 % of non-guaranteed hours employees 0% 0.09% 0.07% Number of full-time employees* 1,179 3,083 4,262 % of full-time employees* 98.4% 99.4% 99.1% Number of part-time employees* 19 18 37 % of part-time employees* 1.6% 0.6% 0.9% Type of contract at 31/12/2024 Europe Caribbean Africa Total Number of employees 1,094 1,325 1,956 4,375 % of employees 25% 30.3% 44.7% 100% Number of permanent employees 1,033 1,229 1,820 4,082 % of permanent employees 94.4% 92.8% 93% 93.3% Number of temporary employees 61 96 136 293 % of temporary employees 5.6% 7.2% 7% 6.7% Number of non-guaranteed hours employees 3 0 0 3 % of non-guaranteed hours employees 0.3% 0% 0% 0.07% 31/12/2024 31/12/2023 31/12/2024 31/12/2023 <30
years30-39
years40-49
years≥50
years<30
years30-39
years40-49
years≥50
years<30
years30-39
years40-49
years≥50
years<30
years30-39
years40-49
years≥50
yearsHolding company 2 8 8 11 3 5 7 11 6.9% 27.6% 27.6% 37.9% 11.5% 19.2% 26.9% 42.3% Energy Distribution 550 1,229 1,184 1,058 491 1,224 1,162 1,004 13.7% 30.6% 29.4% 26.3% 12.7% 31.5% 29.9% 25.9% Photovoltaic Electricity Production 107 96 29 17 74 64 19 14 43% 38.6% 11.6% 6.8% 43;3% 37.4% 11.1% 8.2% TOTAL 659 1,333 1,221 1,086 568 1,293 1,188 1,029 15.3% 31% 28.4% 25.3% 13.9% 31.8% 29.1% 25.2% The monitoring of employee turnover shows that the Group maintained a dynamic recruitment policy which maintained employment in 2024. Net job creations (number of new hires less all leavers) totalled 204 people. The turnover rate is 10.9 in 2024 (compared to 12.7 in 2023).
4.3.1.2.6 PROCESSES FOR ENGAGING WITH OWN WORKFORCE AND WORKERS’ REPRESENTATIVES ABOUT ACTUAL AND POTENTIAL IMPACTS [S1-2]
At the subsidiaries, social dialogue, as defined by the International Labour Organization (ILO), is structured either through employee representatives or directly with employees. At 31 December 2024, 72.5% of subsidiaries had set up a social dialogue, with 20 of them having employee representatives and 17 favouring direct exchange with their employees.
- committees and personnel representative bodies (Spain, Portugal, French subsidiaries including French Guiana, Corsica, etc.): the Social and Economic Committee (SEC) and the Health, Safety and Working Conditions Commission (CSSCT) meet regularly to discuss working conditions and health and safety issues;
- internal consultations and negotiations: negotiations include quarterly meetings with personnel representatives and annual negotiations on compensation and working conditions (France, Madagascar, Réunion Island, etc.);
- surveys and polls: employee satisfaction questionnaires and annual surveys (barometers) are conducted to collect feedback from employees (Portugal, Bermuda, Nigeria, Rwanda, Réunion Island, etc.).
The General Management of the subsidiaries is directly responsible for setting up social dialogue, with the help of their HR Department where applicable. The effectiveness of this dialogue is measured, where applicable, with regard to the maturity of the subsidiaries in this area, through the actions carried out locally:
- meetings with personnel representatives (South Africa, France, Spain, Portugal, etc.);
- regular exchanges with the personnel itself (Djibouti, Ethiopia, Togo, etc.);
- results of annual negotiations (France, Madagascar, Rwanda, etc.) leading to the conclusion of an agreement;
- results of social surveys and employee satisfaction surveys (Madagascar, Nigeria, Rwanda, South Africa, etc.).
In addition to these mechanisms, the subsidiaries organise events (bimonthly, quarterly or half-yearly) to share information with employees, such as bi-annual HR roadshows, quarterly meetings, and general personnel meetings to discuss legislative changes, statistics and future projects. Employee engagement is also strengthened by quarterly meetings dedicated to company news, financial results and ongoing initiatives. In addition, strategic seminars and annual conventions bring together all the teams.
4.3.1.2.7 PROCESSES TO REMEDIATE NEGATIVE IMPACTS AND CHANNELS FOR OWN WORKFORCE TO RAISE CONCERNS [S1-3]
Employees and external and occasional workers can make their concerns known to the Group by using the Rubis Integrity Line whistleblowing system. This system was set up by Rubis in 2018 and is presented in detail in section 4.4.2.3. It also makes it possible to report incidents anonymously.
This system is complementary to the other channels made available to employees to report potential breaches of the Code of Ethics or regulations (see section 4.4.2.3.2). An employee wishing to share their concerns can therefore choose the most appropriate channel for their report.
In addition to the information procedures mentioned in the section 4.4.2.3.2, Group employees are informed of the existence and purpose of this system by the following means: the Group intranet training, presentation posters in the subsidiaries and, for French entities, a reference in the internal regulations.
The whistleblowing procedure specifies the rights and duties of whistleblowers so that the procedure can operate smoothly in a climate of trust. Notably, they are protected against reprisals, as detailed in the section 4.4.2.3.2.
At this stage, the Group does not have a process by which it would attempt to assess employee confidence in the whistleblowing system.
The Rubis Integrity Line whistleblowing system is supplemented by local mechanisms. A procedure requires entities to inform Rubis SCA of any significant incident, including those relating to human rights issues.
Moreover, when a significant negative impact on personnel is identified, the local management of each subsidiary is required to take appropriate corrective measures to remedy the situation. This obligation is part of the Group’s overall policy on respect for human rights and the dignity of persons reaffirmed in its Code of Ethics, in accordance with international conventions and national legislation in force.
Secure employment concerns could impact the physical and mental well-being of employees. In the energy sector, economic cycles and technological developments can have a major impact on labour requirements, notably in terms of skills (see section 4.3.1.11).
In addition to these challenges, the personnel most exposed to the issue of secure employment is the personnel working on vessels, most of whom is hired under fixed-term contracts. There were 166 fixed-term contracts at 31 December 2024, representing 3.8% of employees. In the Group’s other activities, more than 93% of employees have permanent contracts.
In terms of job security, the Group does not have a single centralised policy. However, all Group subsidiaries undertake to comply with local law in this area, as well as the Group’s Code of Ethics (see section 4.3.1.2.3). The goal is to protect workers from job insecurity, particularly for the most vulnerable populations (see section 4.3.1.1). Compliance with these policies is ensured at the highest level by the General Management of the subsidiaries, with the support, where appropriate, of Human Resources. In entities covered by company agreements, this issue is also managed in this way.
The Support & Services activity (shipping) uses workers from temporary agencies or fixed-term contracts in order to respond to market fluctuations and the specific requirements of each project. These non-permanent employees are not taken into account in the published social metrics. The Group is nevertheless vigilant to ensure that the working conditions of these crews are in line with the conventions of the International Labour Organization (ILO) that apply to them. The ILO Maritime Labour Convention provides comprehensive and detailed provisions on the rights and system of protection in the workplace for seafarers. Notably, it aims to ensure decent working conditions for crews and to establish fair conditions of competition among shipowners. External audits are carried out by vetting/certification companies at the request of Group entities to ensure that working conditions on their vessels comply with ILO standards. These audits are carried out as soon as a vessel is chartered. In 2024, no non-compliance was reported during the external audits carried out on compliance with the Maritime Labour Convention.
Rubis ensures compliance with applicable working time laws and regulations. In the Energy Distribution division, vessel crews and road transport drivers are more likely to be exposed to the risk of great working hours. Sea trips are often long. These involve irregular hours, including night shifts and weekends, dictated by weather conditions. Long-distance road trips can increase the risk of accidents, in particular due to fatigue, reduced alertness and exposure time on the road. These travel conditions can impair physical recovery and adversely affect work-life balance. The issue of working hours is all the more important in countries where local regulations on working hours and overtime pay are not in line with ILO conventions, which concerns 47.3% of the Group’s headcount. In these countries, the subsidiaries implement measures that go beyond local regulations.
The subsidiaries apply the principles of the Ethics Code, which recalls compliance with the ILO agreements, and, if required, implement specific actions, as shown in the examples below.
In some countries where the Energy Distribution division operates, the legal working hours and overtime pay are not in line with those established by the ILO conventions. However, a mapping of human rights issues in the Group’s activities in 2022 confirmed that the legal working hours and overtime compensation in these activities, regardless of local regulations, are aligned with the conventions of the ILO due to more favourable internal standards.
Following the analysis of the results of this mapping, the Group defined individualised action plans for the subsidiaries that are located in higher-risk areas and a “standard” action plan in the entities identified as less exposed to risks. These action plans are currently being drawn up and will be rolled out in 2025.
In the Energy Distribution division, notably for road haulage drivers, a GPS tracking system has been installed in the fleet of lorries transporting hazardous materials, enabling better monitoring of drivers’ rest times and compliance with the required itineraries.
Compensation below the adequate wage threshold could have economic and social consequences for the Group’s employees. Notably, this could affect their quality of life, purchasing power and motivation, while increasing the risk of job insecurity and turnover. Although the Group has not yet introduced a specific policy on adequate wages, it ensures that its employees receive, at least, the legal minimum wage in the countries where it is in force.
The Group has not formalised a common salary policy due to the decentralised management of human resources and the autonomy granted to the subsidiaries. However, each subsidiary is responsible for its compensation policy and must ensure that it is consistent with the jobs held and the local standard of living. Under no circumstances may compensation be below the minimum wages in force in the territory. The Code of Ethics makes compliance with the laws and regulations in force on providing a legal minimum wage in each country where the Group operates an essential requirement (see section 4.3.1.2.3).
In addition to fixed compensation, some Group entities allow employees to receive social benefits and employee savings schemes, giving them the option to build ip capital and supplement their professional income.
The implementation of an adequate wage policy is a major project requiring significant preliminary work in view of the decentralised management of human resources at the Group. The first step is to analyse the compensation levels of all employees in the near future. While aware that the notion of a legal minimum wage does not correspond to the notion of an adequate wage, the Group is nevertheless able to confirm that:
- 25% of Rubis employees that work in Europe (including 97.8% in France) are in countries that have defined a legal minimum wage;
- 94.2% of the employees in the subsidiaries are covered by a legal minimum wage and 100% of them receive compensation at least equal to these minima.
In countries where there is no local minimum, 100% consider that the salary set by the subsidiary is adapted to the local standard of living.
In 2024, the Group’s teams (Rubis SCA and the Energy Distribution division) took part in a training cycle organised by the Global Compact to initiate discussions on an adequate wage.
All Group employees receive a base salary, to which may be added additional compensation linked to the individual or collective performance of employees (variable salary, bonuses). Salary reviews are organised at each subsidiary according to the salary policy decided by its Management and resulting from mandatory annual negotiations, where applicable. Salary reviews take into consideration several factors, such as the job held, the quality of work provided by the employee, the cost of living, etc. so that wages are consistent with market practices.
The absence of or insufficient interaction between the Company and its employees or their representatives could limit the ability of employees to express their concerns and negotiate better working conditions. This could lead to a reduction in employee engagement, as well as a deterioration of the social climate at the Company.
Cross-cutting policies (see section 4.3.1.2.3) apply to the IRO. More specifically, the Group, through its Code of Ethics, undertakes to respect fundamental conventions 87 and 98 of the International Labour Organization and to defend the freedom of association and collective bargaining.
68% of own workers are located in countries that have adopted regulations in line with the ILO fundamental conventions on freedom of association and collective bargaining.
To date, around 30 subsidiaries at the Group have set up social dialogue agreements for their employees.
In countries where local legislation does not provide for formal social dialogue or does not recognise the existence of trade unions, the subsidiaries concerned have implemented alternative mechanisms:
- quarterly or half-yearly meetings bringing together all employees to discuss social issues;
- informal events such as lunches and afterworks are organised to foster dialogue;
- suggestion boxes set up to collect employee suggestions.
43 collective agreements, company agreements or unilateral employer decisions were signed within the Energy Distribution division in 2024, covering more than 2,400 employees. These agreements mainly concern collective performance (company savings plans, profit-sharing) or more general aspects, such as the organisation of working hours, recruitment, etc.
Seven collective agreements, company agreements or unilateral employer decisions were signed at the Photovoltaic Electricity Production activity in 2024, covering more than 230 employees.
Collective bargaining coverage Social dialogue Coverage rate Employees – Europe
(for countries with more than 50 employees
representing more than 10% of total employees)Workplace representation (Europe)
(for countries with more than 50 employees
representing more than 10% of total employees)0 – 19% - - 20 – 39% - - 40 – 59% - - 60 – 79% - - 80 – 100% France France Of all the Group’s countries, France is the only country with more than 50 employees and more than 10% of the total workforce where formal social dialogue is required by law.
Aware of its societal role and keen to fight against inequalities, the Group makes it possible, through the implementation of social protection schemes, to protect the health of employees and, for the most vulnerable, to face the crises and accidents of life.
The Group thus strives to provide social coverage for all employees, including those operating in countries where it is not mandatory.
The social protection policy depends on the regulatory framework and specific local practices. In the European Union, the Group’s entities rely on local law and/or applicable collective agreements. Within the Group, 100% of the headcount is covered by a social protection policy, which includes, at a minimum, coverage of healthcare costs and personal risk insurance, in accordance with local regulations and Group standards.
The Group monitors and assesses the coverage of subsidiaries by social protection policies as follows:
- collecting data on social security coverage via the internal reporting system;
- control, entrusted to local HR teams, of compliance with regulatory obligations and contractual commitments in terms of welfare and social coverage, and assessment of the risks related to social protection, notably in the event of legislative changes or changes to the schemes in place.
Social protection is based on local regulations and practices; some subsidiaries have decided to set up voluntary measures that go beyond regulatory requirements.
- in Europe (e.g. Portugal, France, Switzerland): supplementary health insurance, temporary or permanent disability coverage, life and retirement insurance;
- in Africa (e.g. Nigeria, Kenya, South Africa, Madagascar): implementation of national insurance schemes (e.g. NHIS in Nigeria, Code de Prévoyance Social in Madagascar), specific schemes covering occupational accidents and illnesses;
- in the Caribbean (e.g. Jamaica, Haiti): collective insurance including health, accident and retirement insurance.
The provident insurance contract taken out by the Company with an insurance company helps to maintain the standard of living of the Company’s employees and their families in the event of need (work stoppage, invalidity, death).
- to provide all employees with appropriate social security coverage;
- to provide additional guarantees when necessary to improve the protection of employees against risks related to health, disability, occupational accidents and old age;
- to facilitate access to health and welfare plans for employees and, in some cases, their beneficiaries.
- 96.7% of employees have health coverage (workplace accident and disability), whether mandatory or not;
- 61.8% of employees benefit from unemployment coverage, whether mandatory or not;
- 98.8% of employees benefit from healthcare coverage, whether mandatory or not;
- 65.1% of employees receive parental leave coverage, whether mandatory or not;
- 97.2% of employees benefit from mandatory or non-mandatory pension coverage.
For example, in countries where there is no mandatory coverage of healthcare costs - i.e., the case of 16 subsidiaries - 100% of them have proactively put in place protection to cover these costs. With regard to health coverage, seven subsidiaries are not subject to a legal obligation, and among them, 85.7% have introduced health insurance on their own initiative.
An imbalance between their professional and private life could negatively impact employee engagement and well-being. An excessive workload or unsuitable hours could degrade the physical and mental health of employees by leading to stress, fatigue and dissatisfaction, and adversely affect the motivation and productivity of teams.
There is no single centralised policy, with each subsidiary applying its own systems according to local regulations, collective agreements and internal practices.
Furthermore, Rubis is committed, through its Code of Ethics, to maintaining reasonable working hours to enable everyone to fulfil their potential and find a work-life balance (see section 4.3.1.2.3).
It is then the responsibility of the Group’s subsidiaries to put in place systems adapted to local realities.
The headcount working on the industrial sites in operations mainly occupies continuous positions, organised in successive teams (3x8), in order to ensure continuity of production. This organisation makes it possible to maintain operational efficiency while guaranteeing regular rest periods for the personnel concerned.
Executives have autonomy in the performance of their duties, are flexible in organising their work and are not subject to collective working hours. They represent 17.8% of the Group’s own workers.
In addition, in a context of changing technological tools and organisational models, remote working agreements have been set up within several entities in France as well as in various European countries. These initiatives, aimed at categories of employees whose roles allow it, facilitate work-life balance.
A reduction in working hours is applied in certain subsidiaries (for example, Portugal: between 35 and 38 hours compared to 40 legal hours, and in Morocco: 36.5 hours compared to 44 legal hours).
All employees benefit from a minimum base of paid annual leave, with durations varying according to local regulations (for example, 24 days in South Africa, 30 days in Madagascar).
In terms of parenthood, several subsidiaries increase statutory leave (for example, in Kenya, the entity grants an additional month of maternity leave compared to national law, the Swiss entity extends maternity leave to 16 weeks of 100% paid leave (compared to 14 weeks with 80% of salary under national law)).
Additional leave is granted for family events (marriage, birth, adoption, death, move, family obligations).
The Group actively supports initiatives that foster a healthy work-life balance. With this in mind, team-building workshops are regularly organised at several subsidiaries, such as in Jamaica, France, Morocco, Spain and Madagascar, enabling employees to strengthen their ties, while benefiting from time to relax and improve their collaboration. The Group also encourages participation in events that unite teams around common causes, thus contributing to a fulfilling work environment. In addition, mentoring programmes have been introduced in some subsidiaries, offering employees the opportunity to share their skills and develop rewarding relationships, conducive to better management of work and personal life.
In a sector where industrial and operational risks are significant, any incident in terms of health, safety and security could generate risks for the physical integrity of employees (illness, injury, even in the most serious situations such as death). Such an event could lead to a loss of employee confidence in the Company, impact the organisation of the workers concerned and, in the absence of adequate social protection, have a financial impact on them.
Rubis pays particular attention to occupational health and safety, incorporating a rigorous management of risks specific to its operational activities. This notably includes:
- the intrinsic properties of the products handled and the handling conditions, requiring appropriate measures to ensure the safe handling of hazardous materials;
- road safety, with enhanced monitoring of transport, since the vehicles transporting products travel many kilometres each year.
In addition, the Group operates in countries or areas where workers may be exposed to health and safety risks. The entities concerned implement risk prevention systems.
Policy name Description of the policy Scope of
application
of the policyPerson responsible for the
operational implementation
of the policyHSE Charter of the Energy Distribution division The division’s HSE charter stipulates that risks affecting the health and safety of workers must be regularly assessed and that preventive and corrective measures must be implemented accordingly. Energy Distribution Technical & HSE Department QHSE Policy for the Photovoltaic Electricity Production activity The Photovoltaic Electricity Production activity is committed to guaranteeing optimal conditions for the safety of employees at work, with a target of zero accidents. Photovoltaic Electricity Production Human Resources Department, Development Department, Engineering Procurement Construction Department and Operations & Maintenance Department In accordance with local regulations and international standards (ISO 45001, OHSAS 18001), the Group looks to ensure a safe working environment and develop a culture of occupational risk prevention. The goal is to reduce accidents, improve working conditions and empower each player.
The Energy Distribution division and the Photovoltaic Electricity Production activity roll out hygiene, health, safety and environmental charters, as well as the actions stemming from them. These charters are applicable to all personnel working on the Group’s sites. They set high security standards and are implemented at each site by dedicated teams. The management and operational teams are responsible for monitoring the implementation of the HSE charters. Dedicated reporting systems are in place, which enable information on accidents to be reported and indicators to be monitored. In addition, compliance with the safety conditions and rules set by these charters is regularly monitored (see section 3.2).
As well as the Code of Ethics and the HSE charters, all subsidiaries must define an occupational health and safety policy, mainly concerning:
- systematic identification, assessment and prevention of occupational risks at each site;
- the obligation to report and analyse incidents and near misses;
- the strict application of safety protocols and the mandatory wearing of personal protective equipment (PPE);
- the integration of security measures in the design of infrastructures and work processes.
All subsidiaries apply a strict policy concerning the use of drugs and the consumption of alcohol by prohibiting their consumption. These measures aim to reduce the risk of occupational accidents, protect the health and safety of employees and promote a safe working environment.
100% of the own workers covered by a safety management system and 98.8% of workers are covered by a health management system based on legal requirements and/or recognised standards or guidelines.
The number of occupational accidents with lost time of more than one day recorded by the subsidiaries’ HR Departments increased compared to the previous financial year (52 in 2024, compared to 46 in 2023). While the change in this frequency rate is a key monitoring indicator for the Group, the teams carry out more global in-depth work to ensure all accidents are reported, wherever they occur. The Group thus strives to have reporting of all subsidiaries that is as complete as that required by European regulations. In addition to the analysis of the change in frequency rate, the quality of reporting, which can lead to increases, is thus also a key indicator of safety culture.
In the Energy Distribution scope, the update of the accident declaration process is fully operational since 2023 and provides better visibility on accidents. In 2024, the business unit recorded 44 accidents resulting in lost time for more than one day, including seven in South Africa and 15 in Portugal. Almost two-thirds of the accidents with lost time were caused by a low-level fall or were related to handling operations, resulting in sprains and musculo-skeletal pain. The health and safety efforts made by the subsidiaries over the past few years, via raising employee awareness of the risks related to activities and improving QHSE procedures have made it possible to gradually reduce the frequency rate of occupational accidents. This rate has fallen by 34.1% since 2015 in the Energy Distribution division (rate of 8.2 in 2015 compared with 5.4 in 2024, per 1 million hours worked).
Number of
occupational
accidents with
lost time > 1 dayOf which
number of
fatalitiesFrequency rate
of occupational
accidents
with lost time
(per 1 million
hours worked)Frequency rate
of occupational
accidents
with lost time
(per 200,000
hours worked)Number of
occupational
illnessesOf which number
of deaths due
to occupational
illnesses2024 2023 2024 2023 2024 2023 2024 2023 2024 2023 2024 2023 Holding company 0 0 0 0 0 0 0 0 0 0 0 0 Energy Distribution 44 43 0 0 5.4 6 1.1 1.2 5 0 0 0 Photovoltaic Electricity Production 8 3 0 0 21.7 13.1 4.3 2.6 0 0 0 0 TOTAL 52 46 0 0 6 6.2 1.2 1.2 5 0 0 0 Concerning the external service providers working on the Group’s sites, on-site accident monitoring recorded: 22 accidents in 2024, without fatal accident.
The Group places the prevention of occupational accidents at the heart of its priorities, implementing continuous actions to ensure a safe and healthy working environment.
In addition to regular training, safety audits and prevention systems (for example, the paperless work permit, the quarterly review of HSE performance indicators, the sharing of feedback with subsidiaries, etc.) are rolled out in order to reduce occupational risks and strengthen the safety culture in teams.
In general, risk prevention efforts continued, with 68.9% of employees trained in health and safety in 2024 (59.5% in 2023).
Moreover, since 2015, variable compensation for Rubis SCA’s Management Board includes a criterion relating to changes in the accident rate (rate of frequency of occupational accidents per million hours worked), underscoring its commitment and involvement in safety issues.
Lastly, in the Group’s French subsidiaries, the occupational accident prevention system is based on the Single Occupational Risk Registration Document (DUERP), which makes it possible to identify and assess the health and safety risks to which employees may be exposed. The purpose of this document is to define and organise the reporting procedure and the associated flow of information between the subsidiary and its employees when an accident occurs. It also makes it possible to list the preventive actions implemented or to be implemented to prevent these risks.
The Group pays particular attention to the risks of occupational illnesses and provides training in gestures and postures for exposed employees. In terms of health, exposure measurement campaigns are carried out by certain European subsidiaries to assess the levels of chemicals, noise, vibrations, legionella and asbestos.
The Group is also present in areas where certain non-occupational illnesses present risks. Awareness-raising and assistance programmes are set up in certain subsidiaries to fight against specific epidemics, such as AIDS (South Africa), Ebola and malaria (Nigeria), plague (Madagascar), cholera (Haiti) and chikungunya (Caribbean).
Lastly, private social security coverage systems have been set up to enable employees to access the necessary care (see section 4.3.1.7).
In the Energy Distribution division, the Technical & HSE Department has developed a tool for reporting near-misses and accidents in real time.
The Photovoltaic Electricity Production activity also has its own decentralised data reporting systems. Subsidiaries report accidents through declaration forms or monitoring files which are then compiled, if necessary, and aggregated annually at the division level.
Transport safety, and notably the reduction of road accidents, is a priority for the Group, particularly at the Energy Distribution division. As well as the regulations applicable to the transportation of hazardous materials, additional measures have been put in place for road transport. In order to prevent accidents, some of the division’s subsidiaries are stepping up their road risk prevention programmes and implementing specific instructions adapted to local contexts, such as the ban on driving at night in certain countries, as well as random blood alcohol and drug testing.
Defensive driving training programmes are rolled out in countries where road risk is increased due to driving habits, long distances to be travelled, the poor quality of road infrastructure, or the specificities of the products transported. The countries where the Group operates that are considered to be the most exposed to road safety risks are those identified by the WHO as one of the 100 most accident-prone countries: https://www.who.int/data/gho/data/indicators/indicator-details/GHO/estimated-road-traffic-death-rate-(per-100-000-population). In 2024, 81% of drivers (84% of salaried drivers and 81% of external drivers) were trained in defensive driving (see section 4.3.3.6).
In areas or countries that are particularly exposed to security risks, employee (permanent or mission) and site protection measures are defined and reinforced according to the assessment and evolution of the surrounding risks, so as to deal with malicious acts, intrusions or kidnappings.
The shipping business may be exposed to acts of piracy in certain areas in which it operates (particularly in the Gulf of Guinea and the Indian Ocean). Recommendations relating to areas designated “high risk areas” by the International Maritime Organization are also taken into account.
The Group attaches particular importance to the prevention of inappropriate behaviours at the Company. Actions to raise awareness of moral harassment, sexual harassment and sexist behaviours are implemented to ensure the physical and moral safety of employees. These initiatives, which take the form of training sessions, communication campaigns and whistleblowing systems, aim to promote a respectful and inclusive working environment.
As the prevention of psychosocial risks helps to ensure a healthy working environment, it is the Group’s responsibility to pay particular attention to this issue. By way of example, since 2023, the Photovoltaic Electricity Production activity has offered its employees the possibility of benefiting from tools dedicated to mental well-being via a platform specialising in the prevention of psychosocial risks and the quality of life and working conditions. This application provides various types of content aimed notably at preventing professional burnout and facilitating disconnection. In the Energy Distribution division, various subsidiaries (Madagascar, Nigeria, Djibouti, etc.) have carried out actions to raise awareness of employee mental health and well-being. Some have organised awareness-raising days, training on quality of life at work and dedicated seminars, notably for seafarers.
Objective Metric Scope Target 2024 2023 Reducing occupational accidents with lost time > 1 day for employees Lost time accident frequency rate > 1 day (excluding commuting accidents) Group Until 2025: lost-time accident frequency rate < 4.5 6 6.2 Achieving and maintaining 0 fatal accidents (employees) Number of fatalities from a workplace accident Group Until 2025: 0 0 0 Raising awareness of traffic accidents in an operational context (employees) Defensive driving training rates in the most exposed countries Energy Distribution 2023: 100% of drivers in the highest-risk countries are fully trained 84% of salaried drivers 88% of salaried drivers Concerning the objective of training 100% of drivers in the countries most exposed in defensive driving, this is a continuous effort by the subsidiaries to ensure that the risks generated by truck traffic are reduced for the needs of their business. The main difficulty encountered is the high turnover of drivers in some countries, making it difficult to train them within the given deadlines.
Discrimination based on gender, age, disability or any other criterion are likely to undermine the moral integrity of employees and candidates. The absence of inclusive policies could hinder access to opportunities and limit the professional development of individuals in the Company.
In accordance with its principles of non-discrimination and convinced of the importance of diversity for value creation, the Group has implemented initiatives to foster the emergence of talent without gender distinction.
Each subsidiary is responsible for applying the principles of diversity recalled in the Group’s Code of Ethics at its own level, based on local regulations, the ILO guidelines, collective agreements where applicable, as well as on internal policies or specific commitments.
At the local level, General Management, which delegates to the HR Department, is responsible for ensuring that the Group’s cross-cutting policies (see section 4.3.1.2.3) are implemented correctly.
Company agreements promoting the inclusion of women and gender equality in the workplace have also been entered into in some of the Group’s subsidiaries and complement existing measures in terms of the fight against discrimination in hiring, the promotion of equal pay, and career development. The following are among the policies and agreements signed by the subsidiaries in 2024: in Madagascar, a charter was signed to promote a caring society towards women, with objectives such as strengthening of measures in favour of parenthood, taking into account women’s health issues, the fight against sexism and sexual violence and the protection of women’s rights; in Martinique, commitments were made on the recruitment, compensation and careers of women via a collective agreement; in Kenya, a recruitment policy and salary structure guarantee gender equality; in Nigeria, an equal opportunities policy was adopted, while in Reunion Island, the agreement on professional equality signed in 2021 was renewed.
The Group’s subsidiaries are proactively implementing concrete actions aimed at reinforcing diversity and equal opportunities, adapted to local specificities and the challenges of each activity, and in particular via attracting and retaining female talent:
- talent review: process carried out jointly by Managers and the HR function to identify and provide support for female talent,
- awareness-raising and communication actions:
- Women’s History Month campaign (Caribbean), highlighting women’s contributions to events in history and contemporary society, and publicly paying tribute to the work carried out by its employees,
- mobilisation of subsidiaries for International Women’s Rights Day.
In 2024, the number of female employees rose by 7%, representing 27.8% of the total headcount (1,215 female employees at 31 December 2024 compared with 1,135 in 2023). At Rubis SCA, management positions are predominantly held by women. Across the Group, 37.8% of positions of responsibility (Managers and executives) are held by women, a higher proportion than their share of the total headcount, and 32.6% of women hold executive or managerial responsibilities compared with 20.7% of men.
To compare pay gaps between men and women in France, a professional equality index has been phased in for French companies with more than 50 employees by French law no. 2018-771 of 5 September 2018 on the freedom to choose one’s professional future.
This index, which is scored out of 100, is calculated on the basis of four or five criteria, depending on the size of the Company’s workforce:
- pay gap between men and women (40 points);
- difference in the rate of individual pay rises between men and women (35 points for companies with fewer than 250 employees; 20 points for companies with more than 250 employees);
- difference in the male/female promotion rate (15 points, only for companies with more than 250 employees);
- share of female workers receiving a pay raise following maternity leave (15 points);
- number of women represented in the top 10 compensation packages (10 points).
The headcount of the Group’s holding company, Rubis SCA, and those of Rubis Patrimoine for the monitoring of social metrics, are below the required thresholds.
Energy Distribution: the gender equality indices of the four French companies concerned were published in 2025; the results were stable between 2023 and 2024:
- SRPP (Reunion Island): 94/100 in 2024 (identical to 2023);
- SARA (French Antilles): 81/100 in 2024 (vs 90/100 in 2023);
- Vitogaz France: 91/100 in 2024 (vs 94/100 in 2023);
- Rubis Antilles Guyane: 98/100 in 2024 (identical to 2023).
Photovoltaic Electricity Production: the gender equality indexes of the two French companies concerned were published in 2025:
- gender pay gap: the gender pay gap is calculated for French companies with more than 50 employees representing six Group entities; the information is provided in the diversity metrics (S1-9) in section 4.3.1.10.2;
- total annual compensation ratio: the equity ratio is presented in chapter 5, section 5.4.4.
The equity ratio was published on a limited scope for 2024, and covers the French subsidiaries, i.e., 24% of the Group’s headcount.
The Group defined the notion of “Top 100” or “Top Management”, which includes the members of the Management Committee of Rubis SCA, Rubis Énergie and Rubis Photosol, as well as the General and Financial Directors of each country. These leaders actively contribute to major decisions that influence the strategic direction and management of the Company.
At 31 December 2024, the Group Management Committee had eight members (including the three Managing Partners), 50% of whom were women.
On average, 27.4% of the members of the Management Committees of Rubis Énergie and its subsidiaries as well as Rubis Photosol women as of 31 December 2024 (compared with 27.9% in 2023).
The percentage of women in top management is in line with the percentage of women in the overall headcount (27.8%).
The Group promotes intergenerational diversity by promoting the integration of younger generations within it.
At 31 December 2024, the Energy Distribution business unit had 42 work-study students and 160 interns, and hired 33 young people at the end of their training. To do this, the subsidiaries organise events with schools and forge long-term partnerships, aimed at attracting young talent and ensuring the transmission of knowledge between generations.
In the Photovoltaic Electricity Production activity, the professional integration of young people is fostered by recruitment through internships, apprenticeships and professionalisation contracts, as well as through partnerships with local schools, to organise site visits and present the business lines related to the operation and maintenance of solar parks. In particular, it is developing partnerships with vocational schools where it welcomes students on internships, which enables the Company to create a pool of skills to meet future recruitment needs. This generates a positive momentum for the region and job prospects for young graduates. As of 31 December 2024, 10 work-study students and ten interns were present within the division. 21 young graduates were hired in 2024.
The Group is committed to promoting the professional integration of people with disabilities through awareness-raising actions and adapted recruitment initiatives. In this respect, the Energy Distribution division has undertaken the following information: virtual reality sessions were provided to employees to better understand the issues of disability, as well as dedicated training provided to General Managers and HR Departments.
The Energy Distribution division and the Photovoltaic Electricity Production activity plan to launch an e-learning programme for all their employees and to roll out new initiatives in 2025 in order to continue efforts initiated several years ago and achieve the target of 100% of employees being made aware of the need to combat prejudice and resistance towards people with disabilities.
The Group applies a zero-tolerance policy to all forms of discrimination and harassment. Systems and training have been put in place to protect employees and promote a respectful working environment:
- accessible to all internal, external and occasional employees via a secure platform,
- makes it possible to report any breaches of the Group’s values and the principles of equality and inclusion;
- in the subsidiaries of the Photovoltaic Electricity Production activity, Managers were trained in best recruitment practices with a specific focus on the fight against discrimination.
31/12/2024 Number of serious incidents related to cases of non-respect of human rights 0 Of which serious incidents of discrimination including harassment 0 Number of complaints lodged through company channels or with the National Contact Points for the OECD guidelines 0 Amounts of fines, sanctions and compensation payments related to incidents of non-respect of human rights (in euros) 0 Objective Metric Scope Target 2024 2023 Fighting against discrimination Number of confirmed incidents of discrimination Group No proven cases of discrimination, notably through reports on its ethics alert line 0 0 Promoting diversity in our teams Percentage of women in Management Comittees • Energy Distribution and Photovoltaic Electricity Production
• Holding company
By 2025:
• 30% women on average on Management Committees (Energy Distribution and Photovoltaic Electricity Production scope)
• maintain 30% representation of the least-represented gender on the Group Management Committee
27.4%
50%
27.9%
50%
Promoting the integration of people with disabilities Percentage of employees made aware of the fight against prejudice and resistance towards people with disabilities Group By 2023: 100% of General Managers and members of Human Resources Departments aware
By 2025: 100% of employees made aware.56.3%
52.5%62.3%*
ND* There was a methodological change between the year 2023 and 2024. The 2023 data is an average of the percentages while the 2024 data takes into account the number of General Managers and members of the Human Resources Departments informed at 31 December 2024 divided by the number of General Managers and members of the Human Resources Departments who had been made aware at 31 December 2024. The development and continuous enhancement of skills makes the Company’s human resources more valuable and feeds its performance, while promoting the employability of people and their professional future.
A lack of investment in training and skills adaptation could lead to a loss of meaning and motivation for employees. In addition, the absence of professional development could slow down their development and reduce their employability, thus limiting the Company’s ability to adapt to changes in the sector.
Furthermore, the energy industry may face challenges in hiring and retaining talent. Difficulties in attracting and retaining qualified employees could adversely affect the Company’s productivity and competitiveness. This makes it essential to invest in the development of skills and the improvement of working conditions.
Based on its CSR roadmap (see section 4.3.1.2.3), the Group sets a common framework for all its subsidiaries to contribute to these changes. Each subsidiary can implement policies adapted to its organisation. By way of illustration, the subsidiaries in Nigeria and Kenya have drawn up a “Training and Development Policy” aimed at improving and maintaining the skills of its employees, by adapting to changing positions, notably in an evolving energy sector. This policy is governed by General Management, HR, Managers and the employees involved in the training process.
This decentralised approach allows each subsidiary to respond flexibly and effectively to the specific needs of its employees, while being part of a consistent and supervised sustainability strategy at Group level.
A lack of training and skills adaptation could lead to a loss of meaning and motivation, and to a deterioration in the employability of employees. To prevent these risks, the Group implements a series of initiatives enabling its employees to train throughout their careers. Depending on the needs expressed by employees during annual reviews, the Group invests in general training to support the development and enhancement of skills throughout their careers.
In 2024, 89.7% of employees (29.5% of women and 70.5% of men) benefited from an interview with their line manager, i.e., 3,394 employees out of 3,782 eligible employees. Each subsidiary is autonomous in the management of performance and career assessments, which allows it to define the frequency of internal reviews with its employees, generally set at once a year.
Continuous training enables all employees to acquire new skills in languages, management, law, customs, or changes in business lines (energy transition, sustainability, new technologies, AI, etc.).
Risk prevention and safety occupy a central place, with training in gestures and postures, and industrial, road and environmental safety, relying on ISO standards and specialised groups (such as the Gesip Groupe d’étude de sécurité des industries pétrolières et chimiques).
The e-learning course, launched in 2021 by the Group, offers modules on the fight against corruption, climate, compliance and cybersecurity, in addition to Personal Data Protection (GDPR) since 2024. It continues to evolve, with new modules on disability and HSE procedures planned for the Energy Distribution division in 2025.
The Group collaborates with partners such as Association pour la Prévention dans le Transport d’Hydrocarbures (APTH), Association de Formation dans le Négoce des Combustibles (Asfoneco), the Red Cross, and others, to strengthen training and assistance for security advisors.
Lastly, inter-departmental initiatives, such as the “Summer Schools” of the Photovoltaic Electricity Production activity, also develop the understanding of the Group’s business lines and challenges, thus give purpose to work, reinforcing the cohesion and integration of newcomers.
31/12/2024 31/12/2023 Total number
of training
hoursNumber
of employee
beneficiariesPercentage
of employees
trainedTotal number
of training
hoursNumber
of employee
beneficiariesPercentage
of employees
trainedHolding company 484 28 96.6% 788 18 69.2% Energy Distribution 94,152 3,763 92.4% 97,241 3,537 90.1% Photovoltaic Electricity Production 3,841 252 92.3% 1441 133 77.8% TOTAL 98,477 4,043 92.4% 99,470 3,688 89.5% Training hours decreased slightly: 98,477 hours of training (-1% compared to 2023) were provided in 2024 at the Group, including some distance learning. The number of employees who received training increased by 9.6% compared to 2023. The average number of training hours per employee was 22.5 hours in 2024 (18.7 hours for women and 24 hours for men).
PERCENTAGE OF EMPLOYEES TRAINED IN CHANGES IN OUR BUSINESS LINES (ENERGY TRANSITION, SUSTAINABILITY, NEW TECHNOLOGIES, AI, ETC.)
In a highly competitive sector such as renewable energy, Rubis faces increasing challenges in attracting and retaining talent. Rubis therefore takes into account the effects of the energy transition on the workforce and backs the creation of quality jobs, in line with international development priorities.
- the integration of young people in the sector: the Photovoltaic Electricity Production activity hires interns, work-study students and young graduates, as well as organising site visits in partnership with schools or welcoming students from vocational high schools;
- the international recruitment strategy: the Photovoltaic Electricity Production activity opens its doors to talent of all nationalities to promote diversity and meet skills needs;
- prospects for rapid development: with a significant proportion of employees under the age of 30, the Photovoltaic Electricity Production activity fosters internal progression to intermediate management levels.
- long-term incentive plans are in place, through the award of long-term incentivising compensation (performance shares, stock options) which aim to acknowledge the positive contributions made by certain high-potential Group executives and Senior Managers around the world in implementing the Group’s strategy and its growth. The characteristics of these plans and their performance conditions are described in detail in chapter 6, section 6.5.
In addition, the Group’s subsidiaries are committed to providing support for adaptation to market changes and to promoting internal mobility, notably through the implementation of support for employees with the evolution of the business lines as part of the energy transition: the Group’s objective is to train employees who wish to do so, and who have access to IT tools, to adapt their jobs. A specific course on “Participating in the development of our business lines” is made available to enable employees to meet the objective of: 10% of our employees trained in the development of our business lines: 238 people completed this course (see section 4.2.1.2.1.4) and 43.7% of employees received training in the development of their jobs.
Thus, by structuring its approach around continuous training, attractiveness and internal mobility, Rubis anticipates market changes while ensuring a stimulating and sustainable working environment for its employees.
Commitment Metric Scope Target 2024 2023 Supporting skills development Percentage of employees receiving training Group By 2025:
• 100% of employees trained annually
• including 10% to changes in our business lines
• 92.4%
• 43.7%
• 89.5%
• 34%
To achieve this target, Rubis relies on the autonomy of its subsidiaries, in terms of training and skills development, to define and roll out actions which are relevant to local realities and the regulatory requirements of its sector.
The Group, aware that it employs diverse workforce and operates on a global scale, recognises the existence of a risk, albeit very limited, related to practices assimilated to forced labour. This risk, if it were to occur, would only concern the shipping activity of the Energy Distribution division, as the division uses temporary employment agencies to hire non-employee workers. The use of temporary employment agencies can present risks, notably in terms of excessive hiring fees, non-compliance with working conditions or lack of social protection. They represent 1.3% of the headcount.
Cross-cutting policies (see section 4.3.1.2.3) apply to the IRO. More specifically, they are addressed through the Group’s Code of Ethics, which applies to all its subsidiaries and notably covers issues related to the prohibition of child labour and forced labour. This Code of Ethics is available on the Group’s website.
To ensure the effective implementation of these commitments, Rubis has set up awareness-raising actions and control procedures. Training sessions are organised to explain the content of the Code of Ethics and to answer employees’ questions. The Group Sustainability, Compliance & Risk Department is the point of contact for subsidiaries and employees on ethics issues.
The Group ensures that its social policy complies, in all the countries where it operates, with the principle relating to the elimination of forced and compulsory labour, in line with the ILO fundamental conventions 29 and 105.
Since 2021, the Group has been a member of the United Nations Global Compact and reaffirms its commitment annually by publishing a Communication on Progress (COP), with a view to integrating and promoting the principles of human rights protection, respect for international labour standards, environmental protection and the fight against corruption.
In 2020, the Group Sustainability, Compliance & Risk Department, in conjunction with the Energy Distribution division’s operational management, conducted an analysis of modern slavery risks in its value chain in order to ensure that adequate preventive measures are in place. This analysis was supplemented in 2022 by a broader mapping of human rights issues in the Group’s activities, with a view to rolling out an individualised action plan for subsidiaries located in particularly at-risk areas.
In 2023, a more detailed assessment of its risk mapping by country where the entities are located was carried out, in close collaboration with the General Management of the subsidiaries. The final objective is to define a “standard” action plan in entities identified as less exposed to human rights risks and individual action plans for subsidiaries or higher-risk areas. These action plans are being drawn up regarding human rights and will be finalised in 2025.
In the Energy Distribution division, the prevention of the risks of forced labour in the shipping activity is the priority point of attention. A workers management manual drawn up by the Rubis subsidiary in charge of managing wholly-owned vessels sets detailed standards to be complied with in terms of crew recruitment and working conditions (under a temporary international contract with a Group entity), in line with the principles of the ILO Maritime Labour Convention, which include the rejection of forced labour. Enhanced vigilance is exercised when dealing with crew recruitment agencies. Contracts with these agencies include specific clauses relating to the obligation to comply with international standards, and the ILO Maritime Labour Convention in particular. Annual audits are carried out on these recruitment agencies. For vessels, the services of a leading vetting company are used. Compliance with the Maritime Labour Convention is included in the preapproval criteria for each vessel.
-
4.4 Working responsibly and with integrity [ESRS G1]
Recognising that the values of responsibility, integrity, trust and professionalism are crucial for the longevity and sustainability of the Group’s activities, Rubis implements and promotes a policy of prevention, monitoring and control
for ethics and integrity in business conduct. This is achieved through actions such as the distribution of a Code of Ethics, the implementation of an Anti-corruption guide and the deployment of an ethics whistleblowing system.
4.4.1 Material impacts, risks and opportunities [ESRS 2 SBM-3, IRO 1]
The table below presents the gross impacts, risks and opportunities relating to Rubis’ business conduct identified by the Group and deemed material during the double materiality assessment carried out in 2024 (see section 4.1.3.3).
NAME
OF THE IROVALUE CHAIN UPSTREAM OPERATIONS DOWNSTREAM Business ethics and compliance risk 
Group ST Reputational risk, operational risk and civil or criminal liability due to a breach of business ethics practices Corruption in the upstream oil value chain 
Group Energy distribution (upstream oil value chain) ST Breaches of business ethics and compliance rules in the upstream value chain The material risks and impacts identified as part of the ESRS G1 – Business Conduct are “Business ethics and compliance risk” as well as “Corruption in the upstream oil value chain” impact, the latter being specific to the Energy Distribution division.
The presence of these risks and impacts has led the Group, since its creation, to make ethics and integrity central to its corporate culture. The Group’s Management Board and the General Management of the Group’s entities consider these values to be fundamental pillars for building and preserving the trust of the Group’s stakeholders. As such, they are key elements in its development.
Human, financial and technical resources are thus mobilised to disseminate and strengthen a corporate culture based on ethics and integrity. A network of Compliance Advisors is deployed in all Group entities along with dedicated tools to facilitate the effective application of our ethics policies and procedures.
Policies and procedures have been put in place to promote practices consistent with principles of ethics and integrity. Our Code of Ethics commits every employee and highlights the essential role of managers, who are called upon to lead by example, promote responsible conduct and support their teams when dealing with ethical dilemmas. In addition, the ethics whistleblowing system, Rubis Integrity Line, offers everyone the opportunity to report any concerns about ethics and integrity.
-
4.5 Methodology note
This section contains a description of methodology and cross-reference tables designed to facilitate understanding of the sustainability information. The scope and methods for reporting sustainability information as well as the key definitions contained in the internal standards on the environmental, social, societal and governance reporting are also presented there. These clarifications will enable the reader to have a more precise understanding of each information item’s scope and relevance.
4.5.1 Scope of consolidation of sustainability data
Unless expressly stated otherwise, the reporting scope for environmental information corresponds to the Group’s operational scope. Controlled companies are fully consolidated.
- for entites fully consolidated in the financial statement: the Group exercises operational control;
- for entities subject to JV consolidation methods (equity method) or in JO (joint control) in the financial statements:
- if the Group has control greater than or equal to 50%, barring exceptions, it is considered to have operational control. The share of Scopes 1 and 2 emissions allocated to the consolidated accounting group is calculated according to its consolidation rate. The remaining emissions are classified as “Companies not fully consolidated in the financial statements”,
- otherwise, barring exceptional circumstances, the Group does not exercise operational control over the entity and its associated Scopes 1 and 2 emissions are recognised in category 15 of the Group’s Scope 3. To date, emissions in this category are considered non-significant;
- if there is an exception to the previous rules, the entities concerned are specified in this section. There are no exceptions to the rules in 2024.
A list of the Group’s entities included in the scope of consolidation is drawn up each year by the Group Sustainability, Compliance & Risk Department in conjunction with the Rubis SCA Consolidation and Accounting Department and made available to any person authorised to request it.
The exact scope of reporting of environmental data may vary according to the environmental indicators, depending on their relevance and the accounting methods applied. The environmental data is collected at the legal entity level.
Environmental data is published by activity. Environmental data has been assessed and is published for all entities of the operating scope that have a material contribution to the metrics.
Unless expressly stated otherwise, the reporting scope for social information corresponds to the Group’s financial scope of consolidation. Controlled and jointly controlled companies are fully consolidated.
According to the metrics published, the information is presented separately for the holding company, the Energy Distribution division and for the Photovoltaic Electricity Production activity and/or by region. The 2023 data has been restated to exclude those of the Rubis Terminal JV (see section 4.1.1.1.2).
The exact scope of social data reporting may vary according to the social indicators, depending on their relevance and the accounting methods applied. Social data is collected at the legal entity level. In 2024, entities with fewer than 10 employees (representing 14 entities and 76 employees in total, i.e., 1.7% of the Group’s total headcount), due to a limited number of employees, benefited from a simplified reporting package (34 metrics to complete instead of 131). The metrics that are not on a Group scope are the following: breakdown by age group, job category and working hours, rate of employees receiving a pay increase, social protection (health, healthcare costs, retirement, unemployment, parental leave), employee turnover, annual interviews, disability, family leave and social dialogue.
In addition, the shipping activity requires the use of crews hired on temporary contracts (customary fixed-term contracts). These non-permanent employees of the Group (166 individuals in 2024) are not taken into account when monitoring published social metrics.
The reporting scope for societal and ethics information corresponds to the Group’s financial scope of consolidation. Controlled and jointly controlled companies are fully consolidated. In order to facilitate the reporting of information, societal/ethics data are collected at the level of the divisions, which are the data consolidating entities.
-
4.6 Appendices
4.6.1 ESRS disclosure requirements covered by the corporate Sustainability Statement [ESRS 2 IRO-2]
ESRS Disclosure Requirement Section ESRS 2 BP-1 – General basis for preparation of Sustainability Statements 4.1.1.1 BP-2 – Disclosures in relation to specific circumstances 4.1.1.2 GOV-1 – The role of the administrative, management and supervisory bodies 4.1.2.1 GOV-2 – Information provided to, and sustainability matters addressed by, the undertaking’s administrative, management and supervisory bodies 4.1.2.1 GOV-3 – Integration of sustainability-related performance in incentive schemes 4.1.2.2 GOV-4 – Statement on due diligence 4.1.2.3 GOV-5 – Risk management and internal controls over sustainability reporting 3.2 SBM-1 – Strategy, business model and value chain 4.1.3.1/Chapter 1 SBM-2 – Interests and views of stakeholders 4.1.3.2 SBM-3 – Material impacts, risks and opportunities and their interaction with strategy and business model 4.1.3.3 IRO-1 – Description of the processes to identify and assess material impacts, risks and opportunities 4.1.4.1 IRO-2 – Disclosure Requirements in ESRS covered by the undertaking’s Sustainability Statement 4.6.1 ESRS E1 ESRS 2 GOV-3 – Integration of sustainability-related performance in incentive schemes 4.2.1.2.1 ESRS 2 SBM-3 – Material impacts, risks and opportunities and their interaction with the strategy and business model 4.2.1.1 ESRS 2 IRO-1 Description of the processes to identify and assess material climate-related impacts, risks and opportunities 4.2.1.1/4.2.1.4.1.1/ 4.2.1.4.2.1/4.2.1.5 E1-1 – Transition plan for climate change mitigation 4.2.1.2.2.1 E1-2 – Policies related to climate change mitigation and adaptation 4.2.1.3/4.2.1.4.1.2/ 4.2.1.4.2.2/4.2.1.5 E1-3 – Actions and resources in relation to climate change policies 4.2.1.3/4.2.1.4.1.4/ 4.2.1.4.2.4/4.2.1.5.1.2 E1-4 – Targets related to climate change mitigation and adaptation 4.2.1.3/4.2.1.4.1.2/ 4.2.1.4.1.4/4.2.1.4.2.2 E1-5 – Energy consumption and mix 4.2.1.4.1.3/4.2.1.4.1.3/ 4.2.1.4.2.3 E1-6 – Gross Scopes 1, 2, 3 and Total GHG emissions 4.2.1.4.1.3 E1-7 – GHG removals and GHG mitigation projects financed through carbon credits 4.2.1.4.1.5 E1-8 – Internal carbon pricing 4.2.1.4.1.4 E1-9 – Anticipated financial effects from material physical and transition risks and potential climate-related opportunities 4.2.1.4.1.6/ 4.2.1.4.2.5/4.2.1.5.3 ESRS E2 ESRS 2 IRO-1 – Description of the processes to identify and assess material pollution-related impacts, risks and opportunities 4.2.2.1 E2-1 – Policies related to pollution 4.2.2.2.2/4.2.2.4.1/ 4.2.2.5.1/4.2.2.6.1/4.2.2.6.2/4.2.2.7.1 E2-2 – Actions and resources related to pollution 4.2.2.2.2/4.2.2.2.3/ 4.2.2.4.2/4.2.2.5.1/4.2.2.5.2/4.2.2.6.1/ 4.2.2.6.2/4.2.2.7.2 E2-3 – Targets related to pollution 4.2.2.4.3/4.2.2.6.1 E2-4 – Pollution of air, water and soil 4.2.2.2.4/4.2.2.5/ 4.2.2.6/4.2.2.6.2 E2-5 – Substances of concern and substances of very high concern 4.2.2.7 E2-6 – Anticipated financial effects from pollution-related risks and opportunities 4.2.2.2.5 ESRS E3 ESRS 2 IRO-1 – Description of the processes to identify and assess material water and marine resources-related impacts, risks and opportunities 4.2.3.1 E3-1 – Policies related to water and marine resources 4.2.3.3.1/4.2.3.4 E3-2 -Actions and resources related to water and marine resources 4.2.3.3.2/4.2.3.4 E3-3 – Targets related to water and marine resources 4.2.3.4 E3-4 – Water consumption 4.2.3.3.3 ESRS E4 ESRS 2 SBM-3 – Material impacts, risks and opportunities and their interaction with the strategy and business model 4.2.4.1/4.2.4.2 ESRS 2 IRO-1 -Description of processes to identify and assess material biodiversity and ecosystem-related impacts, risks, dependencies and opportunities 4.2.4.1/4.2.4.2 E4-1 – Transition plan and consideration of biodiversity and ecosystems in strategy and business model 4.2.4.3.1 E4-2 – Policies related to biodiversity and ecosystems 4.2.4.3.2/4.2.4.6.2/ E4-3 – Actions and resources related to biodiversity and ecosystems 4.2.4.5.2/4.2.4.6.1/ 4.2.4.6.2/4.2.4.7.2 E4-4 – Targets related to biodiversity and ecosystems 4.2.4.3.3/4.2.4.5.2/ 4.2.4.6.2 E4-5 – Impact metrics related to biodiversity and ecosystems change 4.2.4.5.2/4.2.4.6.1/ 4.2.4.6.2 ESRS E5 ESRS 2 IRO-1 – Description of the processes to identify and assess material resource use and circular economy-related impacts, risks and opportunities 4.2.5.1 E5-1 – Policies related to resource use and circular economy 4.2.5.3.1 E5-2 - Actions and resources related to resource use and circular economy 4.2.5.3.2 E5-3 – Targets related to resource use and circular economy 4.2.5.3.3 E5-4 – Resource inflows 4.2.5.3 ESRS S1 ESRS 2 SBM-2 – Interests and views of stakeholders 4.1.3.2 ESRS 2 SBM-3 – Material impacts, risks and opportunities and their interaction with the strategy and business model 4.3.1.1 S1-1 – Policies related to own workforce 4.3.1.2.3/4.3.1.3.1/ 4.3.1.4.1/4.3.1.5.1/4.3.1.6.1/4.3.1.7.1/ 4.3.1.8.1/4.3.1.9.1/ 4.3.1.10.1/4.3.1.11.1/4.3.1.12.1 S1-2 – Processes for engaging with own workforce and workers’ representatives about impacts 4.3.1.2.6 S1-3 – Processes to remediate negative impacts and channels for own workforce to raise concerns 4.3.1.2.7 S1-4 – Taking action on material impacts on own workforce, and approaches to managing material risks and pursuing material opportunities related to own workforce, and effectiveness of those actions 4.3.1.3.2/4.3.1.4.2/ 4.3.1.5.2/4.3.1.6.2/4.3.1.7.2/4.3.1.8.2/ 4.3.1.9.2/4.3.1.10.2/ 4.3.1.11.2/4.3.1.12.2 S1-5 – Targets related to managing material negative impacts, advancing positive impacts, and managing material risks and opportunities 4.3.1.9.3/4.3.1.10.3/ 4.3.1.11.3 S1-6 – Characteristics of the undertaking’s employees 4.3.1.2.5 S1-7 – Characteristics of non-employees in the undertaking’s own workforce 4.3.1.2.5 S1-8 – Collective bargaining coverage and social dialogue 4.3.1.6 S1-9 – Diversity metrics 4.3.1.10 S1-10 – Adequate wages 4.3.1.5 S1-11 – Social protection 4.3.1.7 S1-12 – Persons with disabilities 4.3.1.10 S1-13 – Training and skills development metrics 4.3.1.11 S1-14 – Health and safety metrics 4.3.1.9 S1-15 – Work-life balance metrics 4.3.1.8 S1-16 – Remuneration metrics (pay gap and total remuneration) 4.3.1.10.2 S1-17 – Incidents, complaints and severe human rights impacts 4.3.1.2.8/4.3.1.10.2 ESRS S2 ESRS 2 SBM-2 – Interests and views of stakeholders 4.1.3.2 ESRS 2 SBM-3 – Material impacts, risks and opportunities and their interaction with the strategy and business model 4.3.2.1 S2-1 – Policies related to value chain workers 4.3.2.2.4/4.3.2.4.1/ 4.3.2.5.1 S2-2 – Processes for engaging with value chain workers about impacts 4.3.2.2.2 S2-3 – Processes to remediate negative impacts and channels for value chain workers to raise concerns 4.3.2.2.3 S2-4 – Taking action on material impacts on value chain workers, and approaches to managing material risks and pursuing material opportunities related to value chain workers, and effectiveness of those action 4.3.2.2.4/4.3.2.4.2/ 4.3.2.5.1/4.3.2.6.1 S2-5 – Targets related to managing material negative impacts, advancing positive impacts, and managing material risks and opportunities 4.3.2.2.4/4.3.2.4.3/ 4.3.2.5.2/4.3.2.6.2 ESRS S3 ESRS 2 SBM-2 – Interests and views of stakeholders 4.1.3.2 ESRS 2 SBM-3 – Material impacts, risks and opportunities and their interaction with the strategy and business model 4.3.3.1 S3-1 – Policies related to affected communities 4.3.3.2.4/4.3.3.4.1/ 4.3.3.5.1/4.3.3.6.1 S3-2 – Processes for engaging with affected communities about impacts 4.3.3.2.2/4.3.3.5.2 S3-3 – Processes to remediate negative impacts and channels for affected communities to raise concerns 4.3.3.2.3/4.3.3.5.2 S3-4 – Taking action on material impacts on affected communities, and approaches to managing material risks and pursuing material opportunities related to affected communities, and effectiveness of those actions 4.3.3.4.2/4.3.3.5.2/ 4.3.3.6.2 S3-5 – Targets related to managing material negative impacts, advancing positive impacts and managing material risks and opportunities 4.3.3.4.3/4.3.3.5.3/ 4.3.3.6.3 ESRS S4 ESRS 2 SBM-2 – Interests and views of stakeholders 4.1.3.2 ESRS 2 SBM-3 – Material impacts, risks and opportunities and their interaction with the strategy and business model 4.3.4.1 S4-1 – Policies related to consumers and end-users 4.3.4.4.1/4.3.4.5.1 S4-2 – Processes for engaging with consumers and end-users about impacts 4.3.4.2.2 S4-3 – Processes to remediate negative impacts and channels for consumers and end-users to raise concerns 4.3.4.2.3 S4-4 – Taking action on material impacts on consumers and end-users, and approaches to managing material risks and pursuing material opportunities related to consumers and end-users, and effectiveness of those actions 4.3.4.4.2/4.3.4.5.2 S4-5 – Targets related to managing material negative impacts, advancing positive impacts, and managing material risks and opportunities 4.3.4.4.3/4.3.4.5.3 ESRS G1 ESRS 2 GOV-1 – The role of the administrative, management and supervisory bodies 4.4.2.1 ESRS 2 IRO-1 – Description of the processes for identifying and analysing material impacts, risks and opportunities 4.4.1 G1-1 – Corporate culture and business conduct policies 4.4.2.3 G1-3 – Prevention and detection of corruption and bribery 4.4.3/4.4.4 Disclosure requirement and
relative data pointSFDR Reference Pillar 3 reference Benchmark
regulation referenceEuropean
climate law
referenceSection ESRS 2 GOV-1
Board’s gender diversity, paragraph 21, point d)Indicator No. 13, Table 1, Annex 1 Annex II of Commission Delegated Regulation (EU) 2020/1816 4.1.2.1 ESRS 2 GOV-1
Percentage of board members who are independent, paragraph 21, point e)Annex II of Commission Delegated Regulation (EU) 2020/1816 4.1.2.1 ESRS 2 GOV-4
Statement on due diligence, paragraph 30Indicator No. 10, Table 3, Annex I 4.1.2.3 ESRS 2 SBM-1
Involvement in activities related to fossil fuel activities, paragraph 40, point d) i)Indicator No. 4, Table 1, Annex I Article 449a of Regulation (EU) No. 575/2013 Commission Implementing Regulation (EU) 2022/453, Table 1: Qualitative information on environmental risk and Table 2: Qualitative information on social risk Annex II of Commission Delegated Regulation (EU) 2020/1816 4.1.3.1 / Chapter 1 ESRS 2 SBM-1
Involvement in activities related to chemical production, paragraph 40, point d) (ii)Indicator No. 9, Table 2, Annex I Annex II of Commission Delegated Regulation (EU) 2020/1816 Not applicable (no involvement in activities related to chemical production) ESRS 2 SBM-1
Involvement in activities related to controversial weapons, paragraph 40 point d) (iii)Indicator No. 14, Table 1, Annex I Article 12 (1) of Delegated Regulation (EU) 2020/1818, Annex II to Delegated Regulation (EU) 2020/1816 Not applicable (no involvement in activities related to controversial weapons) ESRS 2 SBM-1
Involvement in activities related to cultivation and production of tobacco, paragraph 40, point d) (iv)Delegated Regulation (EU) 2020/1818, Article 12 (1) of Delegated Regulation (EU) 2020/1816, Annex II Not applicable (no involvement in activities related to cultivation and production of tobacco) ESRS E1-1
Transition plan to reach climate neutrality by 2050, paragraph 14Article 2 (1) of Regulation (EU) 2021/1119 4.2.1.2.2.1 ESRS E1-1
Companies excluded from the “Paris Agreement” on benchmarks paragraph 16, point g)Article 449a of Regulation (EU) No. 575/2013, Commission Implementing Regulation (EU) 2022/2453, model 1: Banking portfolio - Climate change transition risk: Credit quality of exposures by sector, issues and residual maturity Article 12 (1) (d) to (g) and Article 12 (2) of Delegated Regulation (EU) 2020/1818 4.2.1.2.2.1 ESRS E1-4
GHG emission reduction targets, paragraph 34Indicator No. 4, Table 2, Annex I Article 449a of Regulation (EU) No. 575/2013, Commission Implementing Regulation (EU) 2022/2453, model 3: Banking portfolio - Climate change transition risk: alignment metrics Article 6 of Delegated Regulation (EU) 2020/1818 4.2.1.2.2.1 / 4.2.1.4.1.2 ESRS E1-5
Energy consumption from fossil sources disaggregated by sources (only high climate impact sectors), paragraph 38Indicator No. 5, Table 1, and Indicator No. 5, Table 2, Annex I 4.2.1.4.1.3 ESRS E1-5
Energy consumption and mix, paragraph 37Indicator No. 5, Table 1, Annex I 4.2.1.4.1.3 ESRS E1-5
Energy intensity associated with activities in high climate impact sectors, paragraphs 40 to 43Indicator No. 6, Table 1, Annex I 4.2.1.4.1.3 ESRS E1-6
Gross Scopes 1, 2, 3 and Total GHG emissions, paragraph 44Indicators No. 1 and No. 2, Table 1, Annex I Article 449a of Regulation (EU) No. 575/2013 Commission Implementing Regulation (EU) 2022/2453, model 1: Banking portfolio - Climate change transition risk: Credit quality of exposures by sector, issues and residual maturity Article 5 (1), Article 6 and Article 8 (1) of Delegated Regulation (EU) 2020/1818 4.2.1.4.1.3 ESRS E1-6
Gross GHG emissions intensity, paragraphs 53 to 55Indicator No. 3, Table 1, Annex I Article 449a of Regulation (EU) No. 575/2013, Commission Implementing Regulation (EU) 2022/2453, model 3: Banking portfolio - Climate change transition risk: alignment metrics Article 8 (1) of Delegated Regulation (EU) 2020/1818 4.2.1.4.1.3 ESRS E1-7
GHG removals and carbon credits, paragraph 56Article 2 (1) of Regulation (EU) 2021/1119 4.2.1.4.1.5 ESRS E1-9
Exposure of the benchmark portfolio to climate-related physical risks, paragraph 66Annex II of Delegated Regulation (EU) 2020/1818, Annex II of Delegated Regulation (EU) 2020/1816 NA ESRS E1-9
Disaggregation of monetary amounts by acute and chronic physical risk, paragraph 66, point a)Article 449a of Regulation (EU) No. 575/2013, Commission Implementing Regulation (EU) 2022/2453, paragraphs 46 and 47, model 5: Banking portfolio - Physical risk related to climate change: exposures subject to physical risk NA ESRS E1-9
Location of significant assets at material physical risk, paragraph 66, point c)Article 449a of Regulation (EU) No. 575/2013, Commission Implementing Regulation (EU) 2022/2453, paragraphs 46 and 47, model 5: Banking portfolio - Physical risk related to climate change: exposures subject to physical risk NA ESRS E1-9
Breakdown of the carrying amount of the Company’s real estate assets by energy-efficiency classes, paragraph 67, point c)Article 449a of Regulation (EU) No. 575/2013, Commission Implementing Regulation (EU) 2022/2453, paragraph 34, model 2: Banking portfolio - Climate change transition risk: Asset-backed loans real estate - Energy efficiency of collateral NA ESRS E1-9
Degree of exposure of the portfolio to climate-related opportunities, paragraph 69Annex II of Commission Delegated Regulation (EU) 2020/1818 NA ESRS E2-4
Amount of each pollutant listed in Annex II of the E-PRTR Regulation (European Pollutant Release and Transfer Register) emitted to air, water and soil, paragraph 28Indicator No. 8, Table 1, Annex I, Indicator No. 2, Table 2, Annex I, Indicator No. 1, Table 2, Annex I Indicator No. 3, Table 2, Annex I 4.2.2.2.4 ESRS E3-1
Water and marine resources, paragraph 9Indicator No. 7, Table 2, Annex I 4.2.3.3.1 ESRS E3-1
Dedicated policy, paragraph 13Indicator No. 8, Table 2, Annex I 4.2.3.3.1 ESRS E3-1
Sustainable oceans and seas, paragraph 14Indicator No. 12, Table 2, Annex I NA ESRS E3-4
Total water recycled and reused, paragraph 28, point c)Indicator 6.2, Table 2, Appendix I NA ESRS E3-4
Total water consumption in m3 per net revenue on own operations, paragraph 29Indicator 6.1, Table 2, Appendix I NA ESRS 2- SBM 3 - E4
paragraph 16, point a) iIndicator No. 7, Table 1, Annex I 4.2.4.2.1 / 4.2.4.5.2 ESRS 2- SBM 3 - E4
paragraph 16, point b)Indicator No. 10, Table 2, Annex I 4.2.4.1 / 4.2.4.2.2 / 4.2.4.2.3 ESRS 2- SBM 3 - E4
paragraph 16, point c)Indicator No. 14, Table 2, Annex I 4.2.4.2.1 ESRS E4-2
Sustainable land/agriculture practices or policies, paragraph 24, point b)Indicator No. 11, Table 2, Annex I 4.2.4.3.2 / 4.2.4.6.2 ESRS E4-2
Sustainable oceans/seas practices or policies, paragraph 24, point c)Indicator No. 12, Table 2, Annex I NA ESRS E4-2
Policies to address deforestation, paragraph 24, point d)Indicator No. 15, Table 2, Annex I 4.2.4.6.2 ESRS E5-5
Non-recycled waste, paragraph 37, point d)Indicator No. 13, Table 2, Annex I NA ESRS E5-5
Hazardous waste and radioactive waste, paragraph 39Indicator No. 9, Table 2, Annex I NA ESRS 2- SBM3 - S1
Risk of incidents of forced labour, paragraph 14, point f)Indicator No. 13, Table 3, Annex I 4.3.1.12 ESRS 2- SBM3 - S1
Risk of incidents of child labour, paragraph 14, point g)Indicator No. 12, Table 3, Annex I NA ESRS S1-1
Human rights policy commitments, paragraph 20Indicator No. 9, Table 3, and Indicator No. 11, Table 1, Annex I 4.3.1.2.3 ESRS S1-1
Due diligence policies on issues addressed by fundamental International Labour Organization Conventions 1 to 8, paragraph 21Annex II of Commission Delegated Regulation (EU) 2020/1816 4.3.1.2.3 ESRS S1-1
Processes and measures for preventing trafficking in human beings, paragraph 22Indicator No. 11, Table 3, Annex I 4.3.1.2.3 ESRS S1-1
Workplace accident prevention policy or management system, paragraph 23Indicator No. 1, Table 3, Annex I 4.3.1.9 ESRS S1-3
Grievance/complaints handling mechanisms, paragraph 32, point c)Indicator No. 5, Table 3, Annex I 4.3.1.2.7 ESRS S1-14
Number of fatalities and number and rate of work-related accidents, paragraph 88, points b) and c)Indicator No. 2, Table 3, Annex I Annex II of Commission Delegated Regulation (EU) 2020/1816 4.3.1.9.2 ESRS S1-14
Number of days lost to injuries, accidents, fatalities or illness, paragraph 88, point e)Indicator No. 3, Table 3, Annex I 4.3.1.9.2 ESRS S1-16
Unadjusted gender pay gap, paragraph 97, point a)Indicator No. 12, Table 1, Annex I Annex II of Delegated Regulation (EU) 2020/1816 Results of the gender equality index for French companies in section 4.3.1.10.2 ESRS S1-16
Excessive CEO pay ratio, paragraph 97, point b)Indicator No. 8, Table 3, Annex I 5.4.4 ESRS S1-17
Incidents of discrimination, paragraph 103, point a)Indicator No. 7, Table 3, Annex I 4.3.1.10.2 ESRS S1-17 Non-respect of UNGPs on Business and Human Rights principles and OECD guidelines, paragraph 104, point a) Indicator No. 10, Table 1, and Indicator No. 14, Table 3, Annex I Annex II of Delegated Regulation (EU) 2020/1816, Article 12 (1) of Delegated Regulation (EU) 2020/1818 4.3.1.10.2 ESRS 2- SBM3 - S2
Significant risk of child labour or forced labour in the value chain, paragraph 11, point b)Indicators No. 12 and No. 13, Table 3, Annex I 4.3.2.6 ESRS S2-1
Human rights policy commitments, paragraph 17Indicator No. 9, Table 3, and Indicator No. 11, Table 1, Annex I 4.3.2.2.4 ESRS S2-1
Policies related to value chain workers, paragraph 18Indicators No. 11 and No. 4, Table 3, Annex I 4.3.2.2.4 / 4.3.2.4.1 / 4.3.2.5.1 ESRS S2-1
Non-respect of UNGPs on Business and Human Rights principles and OECD guidelines, paragraph 19Indicator No. 10, Table 1, Annex I Annex II of Delegated Regulation (EU) 2020/1816, Article 12 (1) of Delegated Regulation (EU) 2020/1818 4.3.2.2.4 / 4.3.2.6.1 ESRS S2-1
Due diligence policies on issues addressed by the fundamental International Labour Organization Conventions 1 to 8, paragraph 19Annex II of Delegated Regulation (EU) 2020/1816 4.3.2.2.4 / 4.3.2.4.1 / 4.3.2.5.1 ESRS S2-4
Human rights issues and incidents connected to its upstream and downstream value chain, paragraph 36Indicator No. 14, Table 3, Annex I 4.3.2.2.4 / 4.3.2.6.1 ESRS S3-1
Human rights policy commitments, paragraph 16Indicator No. 9, Table 3, Annex I, and Indicator No. 11, Table 1, Annex I 4.3.3.2.4 ESRS S3-1
Non-respect of UNGPs on Business and Human Rights, ILO principles or OECD guidelines, paragraph 17Indicator No. 10, Table 1, Annex I Annex II of Delegated Regulation (EU) 2020/1816, Article 12 (1) of Delegated Regulation (EU) 2020/1818 NA ESRS S3-4
Human rights issues and incidents, paragraph 36Indicator No. 14, Table 3, Annex I NA ESRS S4-1 Policies related to consumers and end-users, paragraph 16 Indicator No. 9, Table 3, and Indicator No. 11, Table 1, Annex I 4.3.4.4.1 / 4.3.4.5.1 ESRS S4-1
Non-respect of UNGPs on Business and Human Rights principles and OECD guidelines, paragraph 17Indicator No. 10, Table 1, Annex I Annex II of Delegated Regulation (EU) 2020/1816, Article 12 (1) of Delegated Regulation (EU) 2020/1818 NA ESRS S4-4
Human rights issues and incidents, paragraph 35Indicator No. 14, Table 3, Annex I NA ESRS G1-1
United Nations Convention against Corruption, paragraph 10, point b)Indicator No. 15, Table 3, Annex I 4.4.2.3.1 ESRS G1-1
Protection of whistle-blowers, paragraph 10, point d)Indicator No. 6, Table 3, Annex I 4.4.2.3.2 ESRS G1-4
Fines for violation of anti-corruption and anti-bribery laws, paragraph 24, point a)Indicator No. 17, Table 3, Annex I Annex II of Delegated Regulation (EU) 2020/1816 NA ESRS G1-4
Standards of anti-corruption and anti-bribery, paragraph 24, point b)Indicator No. 16, Table 3, Annex I NA -
4.7 Report on the certification of sustainability information and verification of the disclosure requirements under Article 8 of Regulation (EU) 2020/852
This is a translation into English of the statutory auditors’ report on the certification of sustainability information and verification of the disclosure requirements under Article 8 of Regulation (EU) 2020/852 of the Company issued in French and it is provided solely for the convenience of English-speaking users.
This report should be read in conjunction with, and construed in accordance with, French law and the H2A guidelines on “Limited assurance engagement - Certification of sustainability reporting and verification of disclosure requirements set out in Article 8 of Regulation (EU) 2020/852”.
This report is issued in our capacity as statutory auditors of RUBIS. It covers the sustainability information and the information required by Article 8 of Regulation (EU) 2020/852, relating to the year ended December 31, 2024 and included in the Group Management Report and presented in the Chapter 4 “Sustainability report” of the universal registration document (hereafter “the Sustainability Statement”).
Pursuant to Article L.233-28-4 of the French Commercial Code, RUBIS is required to include the above mentioned information in a separate section of the Group Management Report. This information has been prepared in the context of the first-time application of the aforementioned articles, a context characterized by uncertainties regarding the interpretation of the laws and regulations, the use of significant estimates, the absence of established practices and frameworks in particular for the double-materiality assessment, and an evolving internal control system. It enables an understanding of the impact of the activity of the Group on sustainability matters, as well as the way in which these matters influence the development of the business of the Group, its performance and position. Sustainability matters include environmental, social and corporate governance matters
Pursuant to Article L.821-54 paragraph II of the aforementioned Code our responsibility is to carry out the procedures necessary to issue a conclusion, expressing limited assurance, on:
- compliance with the sustainability reporting standards adopted pursuant to Article 29 ter of Directive (EU) 2013/34 of the European Parliament and of the Council of 14 December 2022 (hereinafter ESRS for European Sustainability Reporting Standards) of the process implemented by RUBIS to determine the information reported;
- compliance of the sustainability information included in the Sustainability Statement with the requirements of Article L. 233-28-4 of the French Commercial Code, including ESRS; and
- compliance with the reporting requirements set out in Article 8 of Regulation (EU) 2020/852.
This engagement is carried out in compliance with the ethical rules, including independence, and quality control rules prescribed by the French Commercial Code.
It is also governed by the H2A guidelines on “Limited assurance engagement - Certification of sustainability reporting and verification of disclosure requirements set out in Article 8 of Regulation (EU) 2020/852”.
In the three separate sections of the report that follow, we present, for each of the sections of our engagement, the nature of the procedures that we carried out, the conclusions that we drew from these procedures and, in support of these conclusions, the elements to which we paid particular attention and the procedures that we carried out with regard to these elements. We draw your attention to the fact that we do not express a conclusion on any of these elements taken individually and that the procedures described should be considered in the overall context of the formation of the conclusions issued in respect of each of the three sections of our engagement.
Finally, where deemed necessary to draw your attention to one or more disclosures of sustainability information provided by RUBIS in the Group Management Report, we have included an emphasis of matter paragraph hereafter.
As the purpose of our engagement is to express limited assurance, the nature (choice of techniques), extent (scope) and timing of the procedures are less than those required to obtain reasonable assurance.
Furthermore, this engagement does not provide guarantee regarding the viability or the quality of the management of RUBIS, in particular it does not provide an assessment, of the relevance of the choices made by RUBIS in terms of action plans, targets, policies, scenario analyses and transition plans, which would go beyond compliance with the ESRS reporting requirements.
It does, however, allow us to express conclusions regarding the Group’s process for determining the sustainability information to be reported, the sustainability information itself, and the information reported pursuant to Article 8 of Regulation (EU) 2020/852, as to the absence of identification or, on the contrary, the identification of errors, omissions or inconsistencies of such importance that they would be likely to influence the decisions that readers of the information subject to this engagement might make.
Any comparative information that would be included in the Sustainability Statement are not covered by our engagement.
- the process defined and implemented by RUBIS has enabled it, in accordance with the ESRS, to identify and assess its impacts, risks and opportunities related to sustainability matters, and to identify the material impacts, risks and opportunities, that lead to the publication of information disclosed in the Sustainability Statement, and
- the information provided on this process also complies with the ESRS.
On the basis of the procedures we have carried out, we have not identified any material errors, omissions or inconsistencies regarding the compliance of the process implemented by RUBIS with the ESRS.
We set out below the elements that have been the subject of particular attention in relation to our assessment of compliance with the ESRS of the process implemented by RUBIS to determine the information reported.
Information on the identification of stakeholders is set out in section 4.1.3.2 - Interests and views of stakeholders of the Sustainability Statement.
Our work consisted primarily of assessing the consistency of the primary stakeholders identified by the Group in light of the nature of its activities and its geographical location, taking into account its business relationships and value chain.
Information on the identification of impacts, risks and opportunities is provided in section 4.1.4.1 - Description of procedures for identification and assessment of significant impacts, risks and opportunities of the Sustainability Statement.
We obtained an understanding of the process implemented by the Group to identify actual or potential impacts – both negative and positive – risks and opportunities (IROs), in relation to the sustainability matters mentioned in paragraph AR 16 of ESRS 1, “Application requirements” as presented in the aforementioned section of the Sustainability Statement.
In particular, we assessed the approach implemented by the Group to determine its impacts and dependencies, which may be a source of risks or opportunities.
We obtained an understanding of the Group’s identified IROs and assessed their consistency with our knowledge of the Group and, where applicable, with the risk analyses conducted by the Group.
We assessed how the Group has taken into account the list of sustainability matters set out in ESRS 1 (AR 16) in its analysis.
Information on the assessment of impact materiality and financial materiality is provided in section 4.1.4.1 - Description of procedures for identification and assessment of significant impacts, risks and opportunities of the Sustainability Statement.
Through inquiries with management and inspection of available documentation, we obtained an understanding of the process implemented by the Group to assess impact materiality and financial materiality, and assessed its compliance with the criteria defined in ESRS 1.
In particular, we assessed the way in which the Group established and applied the materiality criteria defined in ESRS 1, including those relating to the thresholds set, in order to determine the material information reported for metrics relating to material IROs identified in accordance with the relevant ESRS standards.
Compliance of the sustainability information included in the Sustainability Statement of the Group management report with the requirements of Article L. 233-28-4 of the French Commercial Code, including the ESRS
Our procedures consisted in verifying that, in accordance with legal and regulatory requirements, including the ESRS:
- the disclosures provided enable an understanding of the general basis for the preparation and governance of the sustainability information included in the Sustainability Statement, including the basis for determining the information relating to the value chain and the exemptions from disclosures used;
- the presentation of this information ensures its readability and understandability;
- the scope chosen by RUBIS for providing this information is appropriate; and
- on the basis of a selection, based on our analysis of the risks of non-compliance of the information provided and the expectations of users, that this information does not contain any material errors, omissions or inconsistencies, i.e. that are likely to influence the judgement or decisions of users of this information.
Based on the procedures we have carried out, we have not identified material errors, omissions or inconsistencies regarding the compliance of the sustainability information included in the Sustainability Statement, with the requirements of Article L.233-28-4 of the French Commercial Code, including the ESRS.
- information related to the methodological considerations applied by the Group for the preparation of the Sustainability Statement included in section 4.1.1.1.1 – Method for preparation of the sustainability report on a consolidated basis;
- the section 4.1.1.1.2 – Significant change in scope during the reference year of the Sustainability Statement which notably states that environmental, social and governance data related to JV Rubis Terminal, for which the sale was finalized in October 2024, are not included in the Sustainability Statement for the year ended December 31, 2024.
We set out below the elements that have been the subject of particular attention in relation to our assessment of the compliance of the sustainability information included in the Sustainability Statement with the requirements of Article L.233-28-4 of the French Commercial Code, including the ESRS.
Information reported in relation to climate change (ESRS E1) is mentioned in section 4.2.1 - Meeting climate challenges: mitigation, diversification and adaptation of the Sustainability Statement.
- assessing, through inquiries with management, in particular the Group Sustainability, Compliance & Risk department, whether the description of the policies, actions and targets implemented by RUBIS addresses the following areas: climate change mitigation, climate change adaptation and renewable energies;
- assessing the appropriateness of the disclosures provided in the section 4.2.1 - Meeting climate challenges: mitigation, diversification and adaptation of the Sustainability Statement and its overall consistency with our knowledge of the Group.
- we assessed the consistency of the perimeter considered for the greenhouse gas emissions assessment with the perimeter of the consolidated financial statements, activities under operational control and across the upstream and downstream value chain;
- we obtained an understanding of the protocol used to prepare the greenhouse gas emissions statement, and checked its application, for a selection of emission categories and sites, for scope 1 and scope 2;
- with regard to scope 3 emissions, we assessed the process implemented to gather the information;
- we assessed the appropriateness of emission factors used and the calculation of the related conversions, as well as the calculation and extrapolation assumptions, taking into account the inherent uncertainty in the state of scientific or economic knowledge and the quality of the external data;
- we reconciled physical data (such as energy consumption), on a sample basis, to the underlying data used to draw up the greenhouse gas emissions assessment and traced to supporting documents.
With regards to our procedures regarding the transition plan for climate change mitigation, our work primarily consisted in:
- assessing whether the information published in the transition plan meets ESRS E1 requirements with an appropriate description of the plan’s underlying key assumptions, it being understood that we are not required to express a conclusion on the appropriateness or the level of ambition of the transition plan’s objectives;
- whether the transition plan reflects the commitments made by the entity as stated in the minutes of its governance bodies’ meetings.
Information reported in relation to the own workforce of the Group (ESRS S1) is mentioned in section 4.3.1 - Providing a safe, stimulating working environment of the Sustainability Statement.
With regards to our procedures relating to the safety indicator « Number of occupational accidents with lost time » presented in section 4.3.1.9 – Health and safety of the Sustainability Statement, which corresponds to the number of occupational accidents with lost time per million hours worked, our work consisted primarily of:
- obtaining an understanding of the process to collect and compile the published information, based on interviews conducted with management, in particular the “Technical and HSE” department;
- evaluating the process to collect and compile safety-related data in order to assess the collected information and carrying out procedures on the consolidation of these data;
- verifying the accuracy of the calculations to produce the published information, and reconciling, on a sample basis, the underlying data with the supporting documentation within a selection of subsidiaries.
Our procedures consisted in verifying the process implemented by RUBIS to determine the eligible and aligned nature of the activities of the entities included in the consolidation.
They also involved verifying the information reported pursuant to Article 8 of Regulation (EU) 2020/852, which involves checking:
- the compliance with the rules applicable to the presentation of this information to ensure that it is readable and understandable;
- on the basis of a selection, the absence of material errors, omissions or inconsistencies in the information provided, i.e. information likely to influence the judgement or decisions of users of this information.
Based on the procedures we have carried out, we have not identified any material errors, omissions or inconsistencies relating to compliance with the requirements of Article 8 of Regulation (EU) 2020/852.
We set out below the elements that have been the subject of our particular attention in relation to the compliance with the information publication requirements of Article 8 of Regulation (EU) 2020/852.
Information on the alignment of activities related to capital expenditures (Capex) is set out in section 4.2.6.4 – Capital expenditure (Capex) of the Sustainability Statement.
-
5 REPORT OF THE SUPERVISORY BOARD ON CORPORATE GOVERNANCE
This report on corporate governance was prepared in accordance with Article L. 22-10-78 of the French Commercial Code by the Supervisory Board, who approved it at its meetings held on 13 March 2025 and 17 April 2025. This report is attached to the management report.
When drafting this report, the Supervisory Board referred to information and documents obtained from the Audit and CSR Committee and the Compensation, Appointments and Governance Committee (previously called the “Compensation and Appointments Committee”), as well as discussions with the Management Board and Rubis SCA’s Finance, Legal, Consolidation § Accounting and Sustainability, Compliance and Risks Departments.
-
5.1 Corporate Governance Code
The Company refers to the Corporate Governance Code for listed companies published by the Afep and the Medef (hereinafter the “Afep-Medef Code”). This Code (updated in December 2022) is available on the websites of the Company (www.rubis.fr/en/), Afep (www.afep.com) and Medef (www.medef.com).
The Company has always strived to comply with the Afep-Medef Code’s recommendations within the limits of the particularities stemming from its legal form as a Partnership Limited by Shares and the resulting by-law provisions.
The applicable recommendations that were not fully implemented in 2024 and the explanations provided by the Company are set out in the table below.
Afep-Medef Code recommendations set aside Explanation On the proposal of General Management, the Board of Directors determines the multi-year strategic guidelines in terms of social and environmental responsibility. (…) The Board annually examines the results obtained and the opportunity, if necessary, to adapt the action plan or modify the objectives in light of changes in the Company’s strategy and technologies, shareholder expectations and the economic capacity to implement them.
(recommendations 5.1 and 5.3)
The responsibility for setting strategic guidelines, particularly in terms of social and environmental responsibility, and for adapting the resulting action plan is incumbent on the Management Board within a Partnership Limited by Shares.
However, the Supervisory Board annually reviews the Group’s strategy, particularly in terms of social and environmental responsibility (or when updated). This practice was formalised when the Supervisory Board’s internal rules were amended on 24 October 2024.
The role and articulation of responsibilities between the corporate bodies in charge of CSR are described in chapter 4, section 4.1.2.1 of this document.
The Committee examines the risks and significant off-balance sheet commitments, assesses the significance of any malfunctions or weaknesses communicated to it and informs the Board, where applicable.
(recommendation 17.2)
The Audit and CSR Committee has formalised the inclusion of significant risks and off-balance sheet commitments on its agenda. This recommendation has been applied at the Audit and CSR Committee meeting on 11 March 2025. The Appointments Committee (…) draws up a succession plan for executive corporate officers (…).
(recommendation 18.2.2)
The Compensation, Appointments and Governance Committee does not draw up a succession plan for the Management Board, since this responsibility falls to the General Partners in a Partnership Limited by Shares.
However, the Supervisory Board is informed at least once a year of the Management Board succession plan implemented by the General Partners. This practice was formalised when the Supervisory Board’s internal rules were amended on 24 October 2024.
-
5.2 Management of the Company
5.2.1 General Management: the Management Board
The Company is managed by the Management Board which is composed of four Managing Partners: Gilles Gobin, and the companies Sorgema, Agena and GR Partenaires. All Managing Partners other than Agena are General Partners and as such have unlimited joint and several liability from their personal assets for Rubis’ debts. This feature, which results from the legal form of Partnership Limited by Shares under which the Company is constituted, provides shareholders with the guarantee of extreme care in the management and administration of the Company (particularly with regard to risk management) and, consequently, a stringent selection of any new Managing Partners.
The legal form of a Partnership Limited by Shares also entails the separation of management and control functions. Management of the Company is the responsibility of the Management Board, whereas the Supervisory Board is responsible for the continuous oversight of the Company’s management.
Gilles Gobin is Statutory Managing Partner. Sorgema, Agena and GR Partenaires are non-Statutory Managing Partners.
As of 31 December 2024, the Managing Partners, and their partners, held 2,352,337 shares of the Company (representing approximately 2.28% of the share capital). In addition the General Partners block half of their partnership dividends in the form of shares for three years.
Gilles Gobin is an Essec graduate with a doctorate in Economics. He started his career at Crédit Commercial de France in 1977 where he joined the Executive Committee in 1986 as head of Corporate Finance. He left the bank in 1989 and founded Rubis in 1990.
Born on 11 June 1950
Professional address
Rubis
46, rue Boissière
75116 Paris – FranceNumber of Rubis shares held as of 31/12/2024
177,782Office within Rubis Statutory Managing Partner and General Partner since the creation of Rubis. Other key offices within the Group
• Manager of Sorgema;
• Chairman of Magerco and Manager of Thornton.
Other offices and positions held
outside the GroupNone.
- Clarisse Gobin-Swiecznik joined the Rubis Group in 2011 within Rubis Terminal. In 2017, she joined Rubis Énergie as Director of Development and Projects. In particular, she is working to diversify and adapt offers to geographical specificities, strengthening her M&A expertise and setting up the CSR & Climate Department.
Since joining Rubis in 2011, where she has held various operational positions in several business lines, Clarisse Gobin-Swiecznik has acquired an intimate knowledge of the Company. Her career path has led her to work with all subsidiaries, forging solid relationships of trust with the Group’s teams and partners.
She joined the holding company in 2020 as Managing Director in charge of New Énergies, CSR and Group Communication. As leader of the Photosol acquisition project in 2022, she steered its integration into Rubis, actively participating in the creation of the Rubis Renouvelables business unit.
Building on this career path, Clarisse Gobin-Swiecznik joined the Management Board of Sorgema, the Managing company of Rubis SCA, in July 2023. She is also Chairwoman of Rubis Renouvelables, a Director of Rubis Photosol and permanent representative of Rubis SCA on the Board of Directors of HDF Energy.
Clarisse Gobin-Swiecznik holds a DESS degree in international operational marketing and a double master’s degree in economics and English from the University of Paris X Nanterre. She began her career at Publicis, notably working for key accounts.
Limited liability company with share capital of €15,487.50
Shareholders
Gobin family group
Managers
Gilles Gobin Clarisse Gobin-Swiecznik
Registered office
34, avenue des Champs-Élysées 75008 Paris – France
Number of Rubis shares held as of 31/12/2024
1,231,609Office within Rubis Managing Partner company and General Partner since 30 June 1992. Other key offices within the Group
None.
Other offices and positions held outside the Group
None.
Jacques Riou graduated from HEC business school and has a degree in Economics. Before joining Gilles Gobin to set up Rubis in 1990, he held several roles at BNP Paribas, Banque Vernes et Commerciale de Paris, and at the investment management company Euris.
Simplified limited company
(SAS) with capital of €10,148Shareholders
Riou family groupChairman
Jacques RiouRegistered office
20, avenue du Château
92190 Meudon – FranceNumber of Rubis shares held as of 31/12/2024
942,946Office within Rubis Managing Partner company since 30 November 1992. Other key offices within the Group
None.
Other offices and positions held outside the Group
Co-Managing Partner of GR Partenaires.
GR Partenaires Limited Partnership with capital of €4,500
Shareholders
• General Partners: companies of the Gobin family group and Jacques Riou
• Limited Partners: Agena and the Riou family group
Managers
• Magerco, represented by Gilles Gobin
• Agena, represented by Jacques Riou
Registered office:
46, rue Boissière
75116 Paris – FranceNumber of Rubis shares held as of 31/12/2024
0Office within Rubis General Partner company since 20 June 1997 and Managing Partner since 10 March 2005. Other key offices within the Group
None.
Other offices and positions held outside the Group
None.
On 13 March 2025, the Company issued a press release informing the market of the intention of Gilles Gobin and Jacques Riou to step down from their positions on the Management Board following the Shareholders’ Meeting called to approve the financial statements for the 2026 financial year, to be held in 2027, and the appointment to the Management Board, subject to the approval of the Shareholders’ Meeting called to approve the financial statements for the 2024 financial year, to be held in 2025, of Jean-Christian Bergeron and Marc Jacquot as Managing Partners (who are not General Partners) from 1 October 2025.
- Gilles Gobin, Statutory Managing Partner in a personal capacity;
- Sorgema, whose co-Managing Partners are Clarisse Gobin-Swiecznik and Gilles Gobin;
- Agena, whose Chairman is Jacques Riou;
- GR Partenaires, whose Managing Partners are the company Magerco (represented by Gilles Gobin) and the company Agena (represented by Jacques Riou);
- Jean-Christian Bergeron; and
- Marc Jacquot.
The Managing Partners have the broadest powers to run and manage the Company. In accordance with legal provisions, they manage the Company, taking into consideration the social and environmental challenges connected to the Company’s business.
The Managing Partners represent and bind the Company in its relationships with third parties within the limits set by its corporate purpose and subject to the duties assigned by law to the Supervisory Board and Shareholders’ Meetings.
Thus, the Rubis SCA Managing Partners make the following decisions for the Company and/or its divisional head subsidiaries (Rubis Énergie and Rubis Renouvelables):
- strategy development;
- steering of development;
- risk management;
- closing of the consolidated and separate financial statements of the Group;
- approval of the management report (including, in a separate section, information on sustainability);
- setting, along with the subsidiaries’ General Managements, the key management decisions resulting therefrom and oversight of their implementation both at the parent company and subsidiary level.
In exercising their management authority, the Managing Partners are supported by the Senior Managers and executives of Rubis SCA, as well as those of the divisional head subsidiaries and their operating subsidiaries.
- closing of the annual and half-year consolidated and separate financial statements;
- definition of the strategy;
- convening of the Shareholders’ Meeting of 11 June 2024 and approved initial and additional draft resolutions included on the agenda of the 2024 Shareholders’ Meeting;
- decision to hold an investors day dedicated to Rubis Photosol (Photosol Day) on 17 September 2024;
- implementation of a capital increase reserved for Group employees;
- review of the performance conditions governing the exercise of stock options and the vesting of performance shares under the 6 November 2020, 1 April 2021 and 13 December 2021 plans (concerning the TSR-related performance condition);
- acknowledgement of capital increases resulting from employee subscriptions to capital increases reserved for them, option exercises and the vesting of performance shares;
- authorisation to sign a mandate with Exane BNP Paribas as part of the share buyback programme;
- recognition of the capital reduction through the cancellation of shares acquired by the Company under the share buyback programme;
- authorisation for the countersignature of the unilateral promise to purchase Rubis SCA’s stake in RT Invest SA presented by Cube Storage Europe HoldCo Ltd;
- decision to exercise the call option granted to Rubis SCA by Cube Storage Europe HoldCo Ltd as part of the disposal of Rubis SCA’s stake in RT Invest SA and authorisation to sign the Exercise Notice and Share Purchase Agreement following the exercise of the purchase option;
- authorisation to sell all of the shares representing Rubis SCA’s stake in RT Invest SA pursuant to the Share Purchase Agreement;
- payment of an exceptional interim dividend of €0.75 per share related to the disposal of Rubis’ stake in RT Invest SA;
- monitoring changes in the shareholding structure;
- monitoring of the dialogue set up by the Company and by the Chairman of the Supervisory Board with investors, analysts and proxy advisors and the expectations expressed;
- analysis of the request to include on the agenda a draft resolution relating to his appointment as a member of the Supervisory Board submitted by Mr Ronald Sämann and analysis of the request to include on the agenda an item concerning the governance of the Company and the evolution of its Supervisory Board and draft resolutions relating to the appointment of four new members of the Supervisory Board and the termination of the appointment of three members of the Supervisory Board submitted by the Compagnie Nationale de Navigation (CNN), controlled by Mr Patrick Molis; adoption of a position by the Management Board, consisting of approval of the candidacy of Mr Ronald Sämann and non-approval of the seven resolution proposals tabled by CNN, communicated to the market on 20 May 2024;
- discussions on the governance practices to be formalised and on those to be put in place, following discussions with the Supervisory Board and the Compensation, Appointments and Governance Committee (previously the Compensation and Appointments Committee) and having resulted in the updating of the internal rules of the Supervisory Board and Committees;
- review of questions asked by shareholders;
- decisions relating to the administration of the Rubis Mécénat endowment fund.
As the Management Board is composed of four members, three of whom are legal entities, the continuity of the General Management is ensured.
Article 20 of the Company’s by-laws stipulates that the appointment of any new Managing Partner is the responsibility of the General Partners. If they are not a General Partner, their appointment requires the approval of the Shareholders’ Meeting.
Within this framework, the General Partners have for several years organised a succession plan for the Management Board that respects the entrepreneurial and family nature of the Company. In order to ensure a succession under optimal conditions, measures have been implemented to enable future Managing Partners to acquire a thorough knowledge of the Group, its activities and its environment within the subsidiaries.
As formalised when its internal rules were amended on 24 October 2024, the Supervisory Board is informed of the succession plan for the Management Board prepared by the General Partners at least once a year.
- the appointment to the Management Board, subject to the prior approval of the Shareholders’ Meeting called to approve the financial statements for the 2024 financial year, to be held in 2025, of Jean-Christian Bergeron (Chief Executive Officer of Rubis Énergie) and Marc Jacquot (Group Chief Financial Officer and member of the Group Management Committee) as Managing Partners (who are not General Partners) from 1 October 2025;
- the intention of Gilles Gobin and Jacques Riou to step down from their positions on the Management Board at the end of the Shareholders’ Meeting called to approve the financial statements for the 2026 financial year, to be held in 2027.
These decisions are part of the succession process for the founders, Gilles Gobin and Jacques Riou, ongoing for several years and having notably led Clarisse Gobin-Swiecznik joining the management of Sorgema, Managing Partner of Rubis SCA, in July 2023. They will ensure an orderly transition within the Company’s Management Board. The Supervisory Board and its Committee responsible for appointments were kept informed throughout this process. The Supervisory Board provided unanimous support to these proposed appointments.
Biographies and list of offices and positions of the two Managing Partners for which the appointment is proposed for approval by the 2025 Shareholders’ Meeting
Jean-Christian Bergeron spent 28 years at TotalEnergies, where he held positions in France and abroad. He has held several strategic positions, notably as Network Director in the Marketing and Services business unit and in M&A operations in Africa and Saudi Arabia. He also held senior management operational responsibilities in France, Pakistan and Cameroon and served as Operational Director for Central and East Africa.
He joined the Rubis Group in 2019 as Chief Executive Officer for East Africa where he supervised the subsidiaries of Rubis Énergie in seven countries: Kenya, Burundi, Djibouti, Ethiopia, Rwanda, Uganda and Zambia.
Born on 7 December 1965
Professional address
Rubis Énergie
Tour Landscape
6, Place des Degrés
92800 Puteaux – France
Number of Rubis shares held as of 31/12/2024
11,035
Terms of office within the Group
Chief Executive Officer of Rubis Énergie since 1 January 2025
Other key offices within the Group
In France
Listed companies: None
Unlisted companies
• Chairman (since 13 December 2024) and member of the Board of Directors (since 22 November 2024) of RD3A (SA).
Abroad
Listed companies: None
Unlisted companies
• Vice-Chairman and Director of Bermuda Gas & Utility Company Ltd (since 1 November 2024);
• Non-resident Director and Chief Executive Officer of Ecclestone Co Ltd (since 30 April 2024);
• Chairman and member of the Board of Directors of Galana Distribution Pétrolière SA (since 16 April 2024);
• Director of Galana Distribution Pétrolière Company Ltd (since 30 April 2024);
• Chairman and member of the Board of Directors of Galana Raffinerie et Terminal SA (since 16 April 2024);
• Director of Galana Raffinerie and Terminal Company Ltd (since 30 April 2024);
• Co-Managing Partner (not General Partner) of Gazel SARL (since 21 March 2024);
• Director of Kobil Petroleum Limited;
• Chairman and member of the Board of Directors of Plateforme Terminal Pétrolier SA (since 16 April 2024);
• Director of Probakery Solutions Limited;
• Vice-Chairman and Director of Rubis Caribbean Holdings Inc. (since 1 November 2024);
• Vice-Chairman and Director of Rubis Energy Bermuda Ltd (since 1 November 2024);
• Chairman and member of the Board of Directors of Rubis Eastern Caribbean SRL (since 1 November 2024);
• Chairman of Rubis Energie Djibouti;
• Director of Rubis Energy Kenya PLC;
• Chairman and Director of Rubis Energy Rwanda Limited;
• Director of Rubis Energy Uganda Ltd;
• Director of Rubis Energy Zambia Limited;
• Director of Rubis Middle East Supply DMCC (since 1 November 2024);
• Director of Rubis West Indies Limited (since 1 November 2024);
• Vice-Chairman and Director of Sinders Ltd (since 1 November 2024);
• Director of Upper Valley Energy Limited (since 24 March 2024);
• Non-resident Director of Woodbar Ltd (since 30 April 2024).
Other offices and positions held outside the Group
• Manager of Kerbel (SCI - real estate investment company).
Marc Jacquot has more than 20 years of experience in finance, during which he has demonstrated his ability to structure and lead financial transactions and strategic financings in Europe and North America.
Before joining Rubis SCA, he was Chief Financial Officer of the Rubis Terminal JV since its creation with I Squared Capital in 2020. In this context, he played a key role in the completion of several financing transactions and mergers and acquisitions, including the acquisition of Tepsa.
He had previously worked in the geosciences sector for 11 years, holding various corporate finance positions in France and in Houston, Texas, as well as four years in investment banking in New York.
Marc Jacquot is a graduate of the University of Paris Dauphine and of the University of Paris X where he obtained a master’s degree and a postgraduate degree in finance.
Born on 15 June 1981
Professional address
Rubis
46, rue Boissière
75116 Paris – FranceNumber of Rubis shares held as of 31/12/2024
0
Functions within Rubis Group Chief Financial Officer and member of the Group Management Committee since March 2024 Other key offices within the Group
In France
None
Abroad
None
Other offices and positions held outside the Group
None
-
5.3 Supervisory Board
5.3.1 Presentation
Supervisory Board members are appointed for a term of no more than three years by the Shareholders’ Meeting. The General Partners are not allowed to take part in these appointments. The General Partners and Managing Partners are not allowed to be members of the Supervisory Board. No member of the Supervisory Board holds or has held an executive position within the Group. As the thresholds set out in Article L. 225-79-2 of the French Commercial Code have not been met, the Supervisory Board does not have any employee representative members.
The Supervisory Board appoints its Chairman from among its members. The Chairman prepares, organises, and leads the work of the Supervisory Board.
The by-laws set the age limit for Supervisory Board members at 75 years. If the number of members of the Supervisory Board over 70 years old exceeds one third of the members, the member aged 75 is deemed to have resigned at the end of the next Shareholders’ Meeting (in its ordinary form).
The by-laws stipulate that each member of the Supervisory Board must hold a minimum of 100 shares of the Company. The Supervisory Board’s internal rules supplement this provision by specifying that each member of the Supervisory Board must allocate half of the compensation they receive to the acquisition of Rubis shares until they hold 250 shares. As of 31 December 2024, the members of the Supervisory Board held 5,799,753 shares of the Company (representing approximately 5.62%(1) of the share capital).
During the financial year ended, the reappointment of Laure Grimonpret-Tahon and Nils Christian Bergene and the appointment of Isabelle Muller and Michel Delville and Benoît Luc were approved by the Shareholders’ Meeting of 11 June 2024. The external resolution presented by Ronald Sämann with regard to his appointment as member of the Supervisory Board was also approved by the latter and approved by the 2024 Shareholders’ Meeting.
At the end of the Shareholders’ Meeting of 11 June 2024, Cécile Maisonneuve, an independent member, joined the Compensation, Appointments and Governance Committee (previously the Compensation and Appointments Committee).
As of 13 March 2025, the Supervisory Board was composed of 12 members, including five women (42%), 10 independent members (83%), and four members of foreign nationality (33%).
SUMMARY PRESENTATION OF THE COMPOSITION OF THE SUPERVISORY BOARD AND OF ITS COMMITTEES (AS OF 13 MARCH 2025)
Name Age Gender Date of first
appointmentExpiry of
current term
of officeSeniority
on the BoardIndependence Participation
in the Audit and
CSR CommitteeParticipation
in the
Compensation,
Appointments
and Governance
CommitteeNils Christian Bergene (Chairman of the Supervisory Board) 70 years M 10/06/2021 2027 SM 4 years ● Chairman ● Marc-Olivier Laurent (Vice-Chairman) 73 years M 11/06/2019 2025 SM 6 years ● Michel Delville 64 years M 11/06/2024 2027 SM 1 year ● Laure Grimonpret- Tahon 43 years W 05/06/2015 2027 SM 10 years ● Chairwoman Olivier Heckenroth (Honorary Chairman) 73 years M 15/06/1995 2026 SM 30 years Benoît Luc 68 years M 11/06/2024 2027 SM 1 year ● Cécile Maisonneuve 53 years W 09/06/2022 2025 SM 3 years ● ● Chantal Mazzacurati 74 years W 10/06/2010 2025 SM 15 years ● Isabelle Muller 68 years W 11/06/2024 2027 SM 1 year ● Alberto Pedrosa 70 years M 09/06/2022 2025 SM 3 years ● ● Ronald Sämann 73 years M 11/06/2024 2027 SM 1 year ● Carine Vinardi 52 years W 09/06/2022 2025 SM 3 years ● ● Average:
65 years42% W
58% MAverage:
6.5 yearsIndependence
rate:
83%Independence
rate:
75%Independence
rate:
100%- The significant percentage of shares held by the members of the Supervisory Board (compared to 0.11% of the share capital at 31 December 2023) is due to the appointment of Ronald Sämann, an historical shareholder of the Company, to the Board, at the end of the 2024 Shareholders’ Meeting.
The terms of office of Cécile Maisonneuve, Chantal Mazzacurati, Carine Vinardi, Marc-Olivier Laurent and Alberto Pedrosa as members of the Supervisory Board expire at the end of the 2025 Shareholders’ Meeting. The Supervisory Board of 13 March 2025 decided, on the proposal of the Compensation, Appointments and Governance Committee, with each member concerned not participating in the deliberations concerning him or her, to present the renewal of the terms of office of Cécile Maisonneuve, Carine Vinardi, Marc-Olivier Laurent and Alberto Pedrosa.
To make its decision, the Supervisory Board noted in particular that Cécile Maisonneuve, Carine Vinardi, Marc-Olivier Laurent and Alberto Pedrosa, independent members, actively contributed to the work of the Board and thus enabled it to fulfil all of its duties.
- the skills in CSR and climate issues as well as the expertise in the renewable electricity production sector of Cécile Maisonneuve and Carine Vinardi;
- Alberto Pedrosa’s financial skills and expertise in the Group’s two business segments; and
- Marc-Olivier Laurent’s significant financial expertise and in-depth knowledge of market expectations.
The complementary nature of the individual skills thus represented on the Supervisory Board contributes to its proper functioning and reinforces its ability to collectively carry out its control mission.
However, given the by-laws provisions on the age limit applicable to its members, the Supervisory Board did not propose to renew the term of office of Chantal Mazzacurati.
It is stipulated that the term of office of Olivier Heckenroth, which expires at the end of the 2026 Shareholders’ Meeting, will be analysed according to these same rules.
On the proposal of the Compensation, Appointments and Governance Committee issued following a selection process carried out with the help of a specialist research firm, the Supervisory Board also decided to propose to the 2025 Shareholders’ Meeting the appointment of Suzana Nutu as an independent member of the Supervisory Board.
In reaching its decision, the Supervisory Board noted in particular that Suzana Nutu’s career has been spent in an international environment in the African (Nigeria and South Africa) and South American (Guyana) markets in which the Group operates, but also in Central and Eastern Europe (Romania), the USA and Asia, where she has been conducting M&A operations for listed companies (LafargeHolcim, Alstom and Sanofi) for 15 years. Thus, through her knowledge and experience acquired in major international companies, particularly in complex financial and development matters abroad including within the context of major and transformative operations, she will be able to provide the Board with the benefit of her tangible approach to financial communication and market expectations issues, including in terms of CSR.
Noting that only one term of office would expire at the end of the 2026 Shareholders’ Meeting and to better stagger the expiry of terms of office, in accordance with recommendation 15.2 of the Afep-Medef Code and the expectations expressed by investors, the Supervisory Board decided, on the proposal of the Compensation, Appointments and Governance Committee, to present for a term of one year (i.e., until the end of the Shareholders’ Meeting called to approve the 2025 financial statements, to be held in 2026) the renewal of the terms of office of Cécile Maisonneuve, Carine Vinardi and Alberto Pedrosa and for a period of three years (i.e., until the end of the Shareholders’ Meeting called to approve the 2027 financial statements, to be held in 2028) the renewal of the term of office of Marc-Olivier Laurent (in order to benefit from the unique nature of his market knowledge combined with his financial expertise) and the appointment of Suzana Nutu (to ensure that she takes up her term of office effectively).
The Supervisory Board, having reviewed the work and the opinion of the Compensation, Appointments and Governance Committee, considered that Cécile Maisonneuve, Carine Vinardi, Suzana Nutu, Marc-Olivier Laurent and Alberto Pedrosa met the independence criteria set by the Company and therefore should be qualified as independent.
Thus, at the end of the 2025 Shareholders’ Meeting, subject to the renewal of the terms of office as well as the appointment of Suzana Nutu and given the non-renewal of the term of office of Chantal Mazzacurati, the Supervisory Board would be composed of 12 members including five women (42%), 11 independent members (92%) and five members with a foreign nationality (42%).
On 16 January and 13 March 2025, the Supervisory Board decided, subject to the renewal of their terms of office by the 2025 Shareholders’ Meeting, that:
- Michel Delville would replace Chantal Mazzacurati as a member of the Audit and CSR Committee;
- Alberto Pedrosa would replace Nils Christian Bergene (who would remain a member of this Committee) as Chairman of the Audit and CSR Committee;
- Cécile Maisonneuve would remain a member of the Compensation, Appointments and Governance Committee; and
- Carine Vinardi would remain a member of the Audit and CSR Committee.
CHANGES IN THE COMPOSITION OF THE SUPERVISORY BOARD BETWEEN THE SHAREHOLDERS’ MEETINGS OF 11 JUNE 2024 AND 12 JUNE 2025
(Subject to the renewal of the terms of office of Cécile Maisonneuve, Carine Vinardi, Marc-Olivier Laurent and Alberto Pedrosa and the appointment of Suzana Nutu by the Shareholders’ Meeting of 12 June 2025)
Departures Appointments Renewals At the end of the SM of 11 June 2024 Hervé Claquin
Erik PointillartMichel Delville*
Benoît Luc*
Isabelle Muller*
Ronald Sämann*Nils Christian Bergene*
Laure Grimonpret-Tahon*Supervisory Board Between the SM of 11 June 2024 and the SM of 12 June 2025 - - - At the end of the SM of 12 June 2025 Chantal Mazzacurati Suzana Nutu* Marc-Olivier Laurent*
Cécile Maisonneuve*
Alberto Pedrosa*
Carine Vinardi*Biographies and list of offices and positions of the members of the Supervisory Board (as of 31 December 2024)
A graduate of Sciences Po Paris (Economic and Financial section) and Insead (Programme for Young Executives), Nils Christian Bergene began his career in 1979 at Barry Rogliano Salles (currently known as BRS) in Paris as a maritime charter broker before moving to Norway where he pursued his career in the maritime transport sector. For eight years he managed various shipping companies within the industrial group Kvaerner Industrie (now part of the Norwegian industrial group Aker). At Kvaerner, he took part in the listing of Kvaerner Shipping (gas shipping company) on the Oslo stock exchange. He then headed the shipping company Igloo (partnership between Kvaerner and Nest OY, a Finnish state-owned company), which was the world leader in the transport of chemical gases for the chemical industry. In 1993, he founded and developed the company Nitrogas with an American partner. He is still active as an independent maritime charter broker within his company. Nitrogas began by transporting liquefied ammonia (NH3) for the agro-chemical and mining industries. Its activity has been extended to liquefied petroleum gas (LPG), vessels for NH3 and LPG being complementary. Since the turn of the millennium, Nitrogas’ activity has also included the transportation of liquefied natural gas (LNG). In all these markets, he works for an international clientele, often French-speaking.
Nils Christian Bergene is a Knight of the National Order of Merit for his work for the Lycée Français René Cassin in Oslo.
Chairman of the Supervisory Board
Chairman of the Audit and CSR Committee
Member of the Compensation, Appointments and Governance
Committee
Independent member
Born on 24 July 1954
Norwegian nationality
Current main position
Maritime transport brokerProfessional address
Nitrogas
Grimelundshaugen 11
0374 Oslo
NorwayNumber of Rubis shares held
as of 31/12/2024
3,169Term of office on Rubis Supervisory Board
Date of first appointment: 10 June 2021
Date of last renewal: 11 June 2024
(previously, member of the Supervisory Board (appointed by the 6 June 2000 Shareholders’ Meeting – term expired at the end of the 5 June 2015 Shareholders’ Meeting))
End of term of office: 2027 Shareholders’ Meeting convened to approve the 2026 financial statements
List of offices held outside the Group in the last five years Current terms of office
In France
None
Abroad
None
Terms of office that have expired during the last five years
- Lorentzen & Stemoco AS ;
- Skipsreder Jørgen J. Lorentzens fond (fondation).
Holder of a master’s degree in law from the University of Liège, a graduate of HEC Liège and Insead, Michel Delville began his career in 1986 at Schlumberger (petroleum services) where he held various management positions in France and abroad in various businesses (electricity transmission and control, fuel distribution and smart cards). He then joined the Imerys Group (a world leader in speciality minerals) in 1999, where he held various financial and managerial positions, particularly in the United States, before becoming Chief Financial Officer and member of the Executive Committee in 2009. After further experience in the battery sector (Saft Group) and automotive parts distribution, he joined the SPIE Group (a European leader in multi-technical services in the energy and communications sectors) as Chief Financial Officer and member of the Executive Committee, a position he held until 2022. He was also an independent Director of the Group Prince Minerals Inc. (United States) from 2015 to 2018.
Independent member
Born on 24 August 1960
Belgian nationality
Current main position
Senior Consultant and Manager
of SCEA Clos des OliviersProfessional address
c/o Rubis
46, rue Boissière
75116 Paris – FranceNumber of Rubis shares held as of 31/12/2024
100Term of office on Rubis Supervisory Board
Date of first appointment: 11 June 2024
Date of last renewal: -
End of term of office: 2027 Shareholders’ Meeting convened to approve the 2026 financial statements
List of offices held outside the Group in the last five years Current terms of office
In France
Listed companies
None
Unlisted companies
- Manager of Carpe Diem SCI;
- Manager of Clos des Oliviers SCEA.
Abroad
None
Terms of office that have expired during the last five years
- Director of Spie Belgium;
- Director of Spie Netherland BV;
- Director of Spie UK.
With a DEA (postgraduate degree) in international and European business law and litigation, after a master’s degree from Panthéon-Sorbonne University, and a specialist master’s degree in business law and international business management from Essec, Laure Grimonpret-Tahon began her career in 2006 as counsel in Dassault Systèmes’ company and Contracts Departments before moving to Accenture Paris (2007-2014) as Legal Officer in charge of corporate matters, compliance and contracts. In 2014, she joined the Legal Department of CGI (an independent IT and business management services company). CGI is a Canadian information technology & IT solutions consulting company, listed on the Toronto and New York Stock Exchanges (NYSE). Laure Grimonpret-Tahon is currently Legal Vice-President for Western Europe and Southern Europe. This region covers around 10 countries and approximately 20,000 employees. In addition to her team management role (composed of around 40 members based in the various countries of the region), she supervises the legal aspects of M&A transactions in the region as well as the post-acquisition integration. She is also responsible for compliance aspects (Sapin 2, anti-corruption, competition, duty of care, sustainability report, etc.) and contractual policy compliance. She is also in charge of the Labour Relations Department. As such, she establishes, in conjunction with the HR Department, the corporate strategy in labour matters (in conjunction with the staff representative bodies).
Chairwoman of the Compensation, Appointments and Governance Committee
Independent member
Born on 26 July 1981
French nationality
Current main position
Vice-President Legal CGIProfessional address
CGI
Carré Michelet 10-12 Cours Michelet 92800 Puteaux – FranceNumber of Rubis shares held as of 31/12/2024
433Term of office on Rubis Supervisory Board
Date of first appointment: 5 June 2015
Date of last renewal: 11 June 2024
End of term of office: 2027 Shareholders’ Meeting convened to approve the 2026 financial statements
List of offices held outside the Group in the last five years Current terms of office
In France
Listed companies
None
Unlisted companies
- Member of the Board of Directors of CGI Information Systems and Management Consultants Holding SAS;
- Member of the Strategy Committee of CGI Information Systems and Management Consultants Holding SAS.
Abroad
None
Terms of office that have expired during the last five years
• Member of the Board of Directors of Umanis SA.
With a master’s degree in law and political science, and a bachelor’s degree in history, Olivier Heckenroth began his career in 1977 with the Société Commerciale d’Affrètement et de Combustibles (SCAC). He was subsequently technical advisor first to the Information and Communications Unit of the French Prime Minister (1980-1981), and then to the French Ministry of Defence (1981-1987). He is also a former auditor of the Institut des Hautes Études de Défense Nationale. In 1987, he was appointed Chairman and CEO of HV International before becoming Chairman (2002-2004), and then Chairman and CEO (2004-2007) of HR Gestion. Since 2004, Olivier Heckenroth was Managing Partner of SFHR, a licensed Bank in 2006, then Banque Hottinguer in 2012. He was a Management Board member and CEO of Banque Hottinguer from 2013 to 2019. In 2021, he founded Heckol Ltd, whose main purpose is to provide services relating to the definition of investment strategies and risk analyses in the finance, security and digital business sectors.
Honorary Chairman of the Supervisory Board
Non-independent member
Born on 10 December 1951
French nationality
Current main position Chairman of GFA Courtassy
Professional address
GFA Courtassy
Mas de la Baronne 13122 Ventabren – FranceNumber of Rubis shares held as of 31/12/2024
8,000Term of office on Rubis Supervisory Board
Date of first appointment: 15 June 1995
Date of last renewal: 8 June 2023
End of term of office: 2026 Shareholders’ Meeting convened to approve the 2025 financial statements
List of offices held outside the Group in the last five years Current terms of office
In France
None
Abroad
None
Terms of office that have expired during the last five years
- Representative of Banque Hottinguer on the Board of Directors of Sicav Stema, HR Patrimoine Monde and HR Patrimoine Europe;
- Chairman of the Audit Committee of Banque Hottinguer;
- Member of the Supervisory Board of Banque Hottinguer;
- Director of Sicav HR Monétaire, Larcouest Investissements and Ariel.
Marc-Olivier Laurent is a graduate of HEC and holds a PhD in African social anthropology from Paris-Sorbonne University. Between 1978 and 1984, he was responsible for investments at Institut de Développement Industriel (IDI). From 1984 to 1993, he headed the M&A, Corporate Finance and Equity division of Crédit Commercial de France. He joined Rothschild & Co in 1993 as Managing Director, and then Partner. Until 2022, he was Managing Partner of Rothschild & Co Gestion and Executive Chairman of Rothschild & Co Merchant Banking. He left his operational duties in the Rothschild Group and is currently Chairman of the Supervisory Board of Rothschild & Co and Managing Partner of the Five Arrows Long Term fund.
Vice-Chairman of the Supervisory Board
Independent member
Born on 4 March 1952
French nationality
Current main position
Chairman of the Supervisory
Board of Rothschild & Co and
Managing Partner of the Five
Arrows Long Term FundProfessional address
Rothschild & Co Five Arrows
Managers
23 bis, avenue Messine
75008 Paris – FranceNumber of Rubis shares held
as of 31/12/2024
23,868Term of office on Rubis Supervisory Board
Date of first appointment: 11 June 2019
Date of last renewal: 9 June 2022
End of term of office: 2025 Shareholders’ Meeting convened to approve the 2024 financial statements
List of offices held outside the Group in the last five years Current terms of office
In France
Listed companies
None
Unlisted companies
• Chairman and member of the Supervisory Board of Caravelle.
Abroad
None
Terms of office that have expired during the last five years
- Managing Partner of Rothschild & Co Gestion SAS (RCOG);
- Executive Chairman of Rothschild & Co Merchant Banking;
- Member of the Supervisory Board of Arcole Industries;
- Chairman and Member of the Board of Directors of Institut Catholique de Paris (ICP).
A civil engineer (ESTP Paris), Graduate in Economics (Paris Sorbonne), Master class in MIT and IFPEN, Benoît Luc occupied several Senior Management positions within TotalEnergies Group and energy joint ventures. After having assumed positions as Managing Director of several affiliates (Turkey, Italy) he was promoted to Senior Vice President Strategy-Research-Developments for Downstream Activities in 2007. He was particularly involved in Energy demand anticipation, Research and Development of new products or processes reducing environmental emissions, as well as M&A transactions. As Senior Vice President Europe and member of the Total Management Committee from 2012 to 2020, he accelerated the group’s energy transition through the acquisition and integration of new companies linked to the development of electric vehicles, hydrogen and new mobility services. As Energy Consultant, he is particularly involved in the development of new Classes and Master Classes on Energy Transition. He delivers the course “Climate Change and Energy Transition” in several best-in-class Universities worldwide. He is a Knight of the French Order of Merit.
Independent member
Born on 26 July 1956
French nationality
Current main position
Energy consultant and
professor of higher educationProfessional address
BL Consultants
13 rue de Tourville
78100 Saint-Germain-en-Laye – FranceNumber of Rubis shares held
as of 31/12/2024
150Term of office on Rubis Supervisory Board
Date of first appointment: 11 June 2024
Date of last renewal: -
End of term of office: 2027 Shareholders’ Meeting convened to approve the 2026 financial statements
List of offices held outside the Group in the last five years Current terms of office
In France
Listed companies
None
Unlisted companies – Associations
(non-profits)- Member of the Board of Directors and Audit Committee of ESTP;
- Chairman of the Board of Directors of TPA (non-profit association of higher education teachers).
Abroad
None
Terms of office that have expired during the last five years
- Chairman of the Board of Directors of Total subsidiaries in the United Kingdom, Germany, Italy, Spain and the Netherlands;
- Member of the Board of Directors of Total France.
A graduate of École Normale Supérieure, Sciences Po Paris, and Université Paris IV-Sorbonne (Master), Cécile Maisonneuve began her career in 1997 at the French National Assembly as an administrator and then as an advisor, holding these positions for 10 years successively within the Defence, Law and Foreign Affairs commissions. She moved to the Areva Group, where she was responsible for their prospective and international public affairs before becoming the Head of the Energy-Climate Centre of the Institut Français des Relations Internationales in 2013. She joined the Vinci Group in 2015, and headed their innovation and prospective lab, La Fabrique de la Cité, for six years. She currently heads Decysive, a research, advisory and know-how transmittal firm focusing on energy, environmental and geopolitical issues. She monitors these issues as a Senior Fellow of Institut Montaigne and as an advisor to the Energy-Climate Centre of the Institut Français des Relations Internationales. She also writes monthly columns in L’Express and Les Échos. Cécile Maisonneuve has experience of electricity markets through her work monitoring energy transition policies at European and national level and the dynamics of electricity markets, both as an expert at the Centre Energie Climat of the Institut Français des Relations Internationales and the Institut Montaigne, and as a consultant for Decysive.
Member of the Compensation,
Appointments and Governance
Committee
Independent member
Born on 23 July 1971
French nationality
Current main position
Senior Manager of DecysiveProfessional address
Decysive SRL
Rue Alfred Giron 4
1050 Ixelles
BelgiumNumber of Rubis shares held
as of 31/12/2024
250Term of office on Rubis Supervisory Board
Date of first appointment: 9 June 2022
Date of last renewal: -
End of term of office: 2025 Shareholders’ Meeting convened to approve the 2024 financial statements
List of offices held outside the Group in the last five years Current terms of office
In France
None
Abroad
None
Terms of office that have expired during the last five years
- Member of the Board of Directors of La Française de l’Énergie (listed company);
- Member of the Supervisory Board of Global Climate Initiatives.
Chantal Mazzacurati is a graduate of HEC business school. She spent her entire career with BNP and then BNP Paribas, where she held a variety of roles in finance, first in the Finance Department, then as Director of Financial Affairs and Industrial Investments, and finally as Head of the Global Equities business line.
Member of the Audit and CSR
CommitteeNon-independent member
Born on 12 May 1950
French nationality
Current main position
Chief Executive Officer of Groupe Milan SASProfessional address
Groupe Milan
6, rue de Varenne
75007 Paris – FranceNumber of Rubis shares held
as of 31/12/2024
8,075Term of office on Rubis Supervisory Board
Date of first appointment: 10 June 2010
Date of last renewal: 9 June 2022
End of term of office: 2025 Shareholders’ Meeting convened to approve the 2024 financial statements
List of offices held outside the Group in the last five years Current terms of office
In France
Listed companies
None
Unlisted companies
- Member of the Management Board of Groupe Milan.
Abroad
None
Terms of office that have expired during the last five years
- Member of the Supervisory Board of BNP Paribas Securities Services (and member of the Risk Monitoring and Appointments Committee).
Isabelle Muller, Engineering graduate (École Centrale de Paris 1978) and holding Masters in Economics (Cornell University, USA 1980) and Political Science (Sciences Po Paris 1983), has an international career in operational and strategic management positions, R&D and in public affairs in the energy industry.
She began her career in 1981 at TotalEnergies in renewable energy and then industrial production. Head of Economic Studies then Senior Expert in the Strategy Department (1995), she contributed to investments and M&A in France and internationally. In charge of research programmes (energy, chemicals, pharmaceuticals and climate) in the Research, Technology and Environment division, she became Director of the Solaize Research Centre (energy products and environment) in 2001.
In 2006, she became Chief Executive Officer of a professional association in Brussels (FuelsEurope) and then in 2012 in Paris (UFIP French Petroleum Industry Union). She has actively contributed to European and French energy and climate transition policies and regulations, participated in several COPs and collaborated on projects with the European Commission.
Appointed member of the National Energy Transition Council (CNTE) (2015-2021), she was Chairwoman of Medef Commissions (Environment, then Energy, Climate Competitiveness, 2012-2021) and Chairwoman of a professional committee.
IFA-certified Director (2020), she is a member of Boards of Directors in the commercial and non-profit sectors and teaches the energy transition in international higher education institutions. She is fluent in French, English and German.
Independent member
Born on 3 February 1957
French nationality
Current main position
Climate and energy transition
university professor (ESTP,
Leeds University, UK)Professional address
c/o Rubis
46, rue Boissière
75116 Paris – FranceNumber of Rubis shares held
as of 31/12/2024
100Term of office on Rubis Supervisory Board
Date of first appointment: 11 June 2024
Date of last renewal: -
End of term of office: 2027 Shareholders’ Meeting convened to approve the 2026 financial statements
List of offices held outside the Group in the last five years Current terms of office
In France
Listed companies
None
Unlisted companies
- Director of Axens;
- Member of the French Language Enrichment Commission (Ministry of the Economy and Finance);
- Director of CentraleSupelec Alumni.
Abroad
None
Terms of office that have expired during the last five years
- General Delegate of UFIP (French Union of Petroleum Industries) from 2012 to 2020;
- Chairwoman of the Professional Oil Committee (2012-2020);
- Member of the French National Energy Transition Council from 2015 to 2020;
- Co-Chair of the Medef Energy and Climate Committee (2017-2020) and Chairwoman of the Environment and Sustainability Commission (2012-2017).
A graduate of Instituto Tecnologico de Aeronautica, with specialisations earned from FGV and Insead/Cedep, Alberto Pedrosa began his career in Brazil with the Rhône-Poulenc Group in 1976. Based in France starting in 1985, Mr Pedrosa held General Management positions carrying international responsibilities at Rhône-Poulenc, Rhodia, Alstom and Renault. Upon returning to Brazil in 2013, he headed Tereos’ local subsidiary and other sugar companies. He is currently a company Director and consultant. Alberto Pedrosa has expertise in the sectors of energy distribution (supervision of the subsidiary in charge of energy production and marketing for a major international chemicals group), renewable electricity production (Director of an international group specialising in the design, construction and the start-up of operations of large-scale photovoltaic energy production facilities), storage of petroleum and chemical products (advisor to a leading international group in the storage of liquid bulk) and the supply chain (Supply Chain Global Manager, member of the Executive Committee of an international chemical group).
Member of the Audit and CSR Committee
Independent member
Born on 1 June 1954
Italian and Brazilian
nationalitiesCurrent main position
Company’ DirectorProfessional address
Rua Dr Melo Alves 717
01417-010 São Paulo
BrazilNumber of Rubis shares held
as of 31/12/2024
300Term of office on Rubis Supervisory Board
Date of first appointment: 9 June 2022
Date of last renewal: -
End of term of office: 2025 Shareholders’ Meeting convened to approve the 2024 financial statements
List of offices held outside the Group in the last five years Current terms of office
In France
Listed companies
None
Unlisted companies
- Member of the International Advisory Board of EDHEC Business School.
Abroad
Listed companies
None
Unlisted companies
- Member of the Board of Directors of SNEF Latam Engenharia e Tecnologia SA.
Terms of office that have expired during the last five years
- Member of the Americas Advisory Board of Cie Plastic Omnium SE;
- Vice-Chairman of the Advisory Board of HPE Automotores do Brasil Ltda.
Ronald Sämann graduated summa cum laude from the Faculty of Medicine of the University of Zurich (Switzerland) in 1977 and holds a doctorate from the same faculty. Between 1980 and 1985, he worked as a general practitioner in a medical practice in Zurich.
Ronald Sämann entered the business world in 1986 as the owner of the family-owned Car-Freshner Corporation (CFC), which he still owns to this day. CFC is an international manufacturer and distributor of consumer air fresheners based in Watertown (New York, United States), which specialises in the development of industrial perfume compositions.
In 2001, he acquired the British listed company H Young Holdings PLC and has been its Chairman and Chief Executive Officer since then. H Young operates internationally in the sports and leisure and automotive aftermarket sectors, including the sale and distribution of its own brand products and third-party brands.
Independent member
Born on 4 June 1951
Swiss and Canadian
nationalitiesCurrent main position
Chairman and CEO
of H Young Holdings PLCProfessional address
H Young Holdings PLC
Buckingham House
10-24 West Street
Newbury
West Berkshire RG14 1BD
United KingdomNumber of Rubis shares held
as of 31/12/2024
5,755,058Term of office on Rubis Supervisory Board
Date of first appointment: 11 June 2024
Date of last renewal: -
End of term of office: 2027 Shareholders’ Meeting convened to approve the 2026 financial statements
List of offices held outside the Group in the last five years Current terms of office
In France
None
Abroad
Listed companies
None
Unlisted companies as corporate officer
- H Young Holdings PLC and its subsidiaries;
- Lakefield Holdings Limited;
- Rinaldo Rinaldini Ltd;
- Julius Sämann Ltd.
Terms of office that have expired during the last five years
- Casinella SA;
- Wunder-Baum AG;
- Vestur AG;
- Julius Sämann AG.
An Itech Lyon engineer, Carine Vinardi holds a PhD in Industrial Engineering from UTC Compiègne-Sorbonne University. She began her career in 1997. Having worked in industry, Ms Vinardi has experience in operational management and managing cross-functional positions in different international companies and along the entire value chain. Until July 2024, she was head of R&D and Operations at the Tarkett Group, which specialises in floor coverings and sports surfaces.
Member of the Audit and CSR
CommitteeIndependent member
Born on 13 February 1973
French nationality
Current main position
Company’ DirectorProfessional address
c/o Rubis
46, rue Boissière
75116 Paris – FranceNumber of Rubis shares held
as of 31/12/2024
250Term of office on Rubis Supervisory Board
Date of first appointment: 9 June 2022
Date of last renewal: -
End of term of office: 2025 Shareholders’ Meeting convened to approve the 2024 financial statements
List of offices held outside the Group in the last five years Current terms of office
In France
Listed companies
None
Unlisted companies
- Independent Director, member of the Supervisory Board of Forlam SAS.
Abroad
None
Terms of office that have expired during the last five years
- R&D and Operations EVP of Tarkett (listed company).
Biography and list of terms of office and positions of the new member of the Board for whom the appointment is proposed to the Shareholders’ Meeting of 12 June 2025
Born in 1974, Suzana Nutu is a graduate of Insead and the École Nationale d’Administration (ENA). She began her career in Romania in the cement group Lafarge, where she held various positions in finance and industrial management control. She then moved on to become Head of the Group’s Central Treasury Control Department in Paris, Internal Control Manager for the United States and the Middle East and Management Controller for the Central and Eastern Europe region, overseeing revenue of €2 billion.
Since 2011, Suzana Nutu has been working in the field of mergers and acquisitions. She supervised divestment transactions for Lafarge in Latin America (Ecuador, Guyana, Honduras) and the United States, as well as the sale of listed companies in the Philippines and Nigeria during the merger of Lafarge with Holcim. She then held the position of Vice-President of Mergers and Acquisitions of the Alstom Group, where she was responsible for several transactions in the digital mobility sector.
Since the end of 2017, she has been Head of Mergers and Acquisitions at Sanofi, where she handles acquisitions and divestments in the non-prescription drug sector. She executed around 10 transactions for this segment, representing approximately €5 billion in revenue and 11,000 employees. More recently, she oversaw the sale of this activity to private equity funds.
Independent member
Born on 23 February 1974
French and Romanian
nationalitiesCurrent main position
M&A Director SanofiProfessional address
Sanofi
46 avenue de la Grande Armée
75017 Paris – FranceNumber of Rubis shares held
as of 31/12/2024
400Term of office on Rubis Supervisory Board
Date of first appointment: 12 June 2025 (subject to her appointment by the Shareholders’ Meeting)
End of term of office: 2028 Shareholders’ Meeting convened to approve the 2027 financial statements
List of offices held outside the Group in the last five years Current terms of office
In France
None
Abroad
None
Terms of office that have expired during the last five years
None
As the Company is incorporated under the legal form of a Partnership Limited by Shares (Société en Commandite par Actions), by law, the Supervisory Board is responsible for continuous oversight of the Company’s management. For this purpose, the Supervisory Board enjoys the same powers as the Statutory Auditors. As such, the Supervisory Board may not interfere in the management of the Company. The Supervisory Board reports annually to the shareholders on its supervisory duties.
The Supervisory Board is assisted in the performance of its duties by its own Committees: the Audit and CSR Committee and the Compensation, Appointments and Governance Committee (previously the Compensation and Appointments Committee).
Following extensive dialogue and in-depth work between the Chairman of the Supervisory Board, the Chairwoman of the Compensation, Appointments and Governance Committee and the Management Board carried out in the second half of 2024, and in the continuity of the changes implemented over the last two years, the Supervisory Board’s missions were strengthened in order to meet the expectations expressed by investors (in particular during governance roadshows).
The evolution of the Supervisory Board’s role has resulted in significant changes to its internal rules, some of which formalise existing practices and others introducing new missions for the Supervisory Board (version adopted on 24 October 2024).
On 5 September 2024, the Supervisory Board’s internal rules had previously been updated to include the impact of the transposition of the CSRD into French law on the role of the Supervisory Board.
The Supervisory Board’s recurring duties are specified in its internal rules (updated on 5 September 2024, then on 24 October 2024):
- ensuring the consolidated and separate financial statements, both annual and half-year, and the annual sustainability report;
- ensuring the consistency of the methods, quality, completeness and fair presentation of the financial statements;
- making a proposal on the principal Statutory Auditors in view of their appointment by the Shareholders’ Meeting and verifying their independence;
- proposal of auditor(s) in charge of the mission to certify the sustainability information with a view to their appointment by the Shareholders’ Meeting and verification of their independence;
- annual review of its composition, the selection process of its future members and the independence of its current and future members;
- monitoring of the Management Board’s succession plan put in place by the General Partners (for which the minimum frequency of once a year was established by the amendment of the Supervisory Board’s internal rules of 24 October 2024);
- establishing specialised Committees to assist it with the performance of its duties and appointing their members;
- conducting an annual self-assessment and implementing and monitoring the three-year formal assessment conducted by a specialist firm;
- providing an advisory opinion on the compensation policy applicable to the Managing Partners in accordance with the provisions of Article L. 22-10-76 of the French Commercial Code;
- assessing (based on work previously carried out by the Compensation, Appointments and Governance Committee) that the compensation of the Managing Partners to be paid or awarded in respect of the past financial year complies with the compensation policy previously approved by the shareholders at the Shareholders’ Meeting and with the by-law stipulations;
- setting the compensation policy applicable to its members;
- assessing (based on work previously carried out by the Compensation, Appointments and Governance Committee) the compliance of the components of compensation of the Chairman of the Supervisory Board to be paid or awarded in respect of the past financial year with the policy previously approved by the shareholders at the Shareholders’ Meeting;
- breakdown of the aggregate amount of compensation to be granted to members of the Supervisory Board, including a portion based on attendance and any Chairmanship and/or participation in Committees;
- monitoring of the validation carried out by the Statutory Auditors of the compliance of the rights of the General Partners in the results;
- granting authorisation prior to the conclusion of related-party agreements;
- assessing the efficiency of the procedure for evaluating ordinary agreements entered into on arm’s length terms and improving such procedure as appropriate;
- assessing the financial and non-financial risks related to the business and monitoring the corrective measures that have been put in place;
- preparing the report on corporate governance (which is attached to the management report) pursuant to Article L. 22-10-78 of the French Commercial Code;
- preparing the report on its mission to the Shareholders’ Meeting;
- deliberating on the professional and wage equality policy;
- ensuring the quality of financial and sustainability information provided to shareholders and the market;
- monitoring the exchanges the Company has with its shareholders and the market.
Strengthened missions of the Supervisory Board resulting from the internal rules adopted on 24 October 2024:
- review by the Supervisory Board of the Group’s strategy presented by the Management Board each year (and at each update);
- review by the Supervisory Board of the budget and its main parameters presented by the Management Board each year;
- consultation of the Supervisory Board so that it expresses its prior opinion on significant operations (transactions exceeding €100 million (assessed in enterprise value)) and on strategic operations, on the basis of relevant information provided in advance by the Management Board so that it can issue this opinion in full knowledge of the facts.
To enable the Supervisory Board to carry out its duties, the internal rules (updated on 5 September 2024, then on 24 October 2024) require the Management Board to inform it of subjects such as:
- the Group’s business (at least once a year by providing a detailed activity report of the Company, its subsidiaries and its entire portfolio);
- trends in each division and future prospects within the framework of the strategy set by the Management Board;
- acquisitions and/or disposals of businesses or subsidiaries, equity interests and, more generally, any major investment;
- changes in bank debt and financial structure within the framework of the financial policy set by the Management Board;
- internal control procedures defined and developed by companies of the Group, under the authority of the Management Board, which is responsible for overseeing the implementation of those procedures;
- draft agendas for Shareholders’ Meetings;
- any major acquisition that is not part of the defined strategy prior to its completion;
- the compensation policy for the Managing Partners for the current financial year as determined by the General Partners and the components of the compensation policy for the Managing Partners paid or awarded in respect of the financial year ended;
- CSR projects and issues;
- compliance issues (including the corruption prevention programme (Sapin 2)).
Additional information to be communicated by the Management Board to the Supervisory Board (resulting from the internal rules adopted on 24 October 2024):
- changes in governance and/or control (of the Managing Partners, senior executives of the legal entity Managing Partners and/or General Partners);
- at least annually, the Management Board succession plan implemented by the General Partners, the minimum frequency of information due to the Supervisory Board having been formalised;
- major press releases (particularly of financial and governance nature) prior to their publication.
The bodies involved in defining the CSR policy within the Group, the actions carried out and the control of their implementation are described in the sustainability report (see chapter 4, section 4.1.2.).
The Supervisory Board examines annually (and at each update) the strategy implemented by the Group for CSR issues. It is informed by the Management Board of changes in the business environment and the main CSR challenges facing the Company, in particular those related to the climate, as well as projects and related issues.
As part of its mission of continuous oversight of the Company’s management, the Supervisory Board examines the annual sustainability report and in particular the processes for preparing sustainability information, disclosure on control processes and management of sustainability risks and sustainability policies and their implementation. It hears the sustainability auditor(s) on the plan and methodology for verifying sustainability information and on the main problems that may be encountered in the performance of its mission. The Supervisory Board reports on this continuous oversight mission and, where applicable, comments on the sustainability disclosure in its report to the Annual Shareholders’ Meeting.
The Supervisory Board also examines the quality of the sustainability disclosure provided by the Management Board to the shareholders and to the market.
In addition, the Supervisory Board receives the report on the work carried out by the Audit and CSR Committee, which:
- the process of developing sustainability information, including the process used to determine the information to be disclosed in accordance with sustainability reporting standards,
- the development of sustainability risk management systems,
- the effectiveness of the internal control and risk management systems with regard to the procedures relating to the preparation and processing of sustainability information;
- regulatory changes and emerging trends in CSR impacting the Company and its subsidiaries and their consideration by them,
- the implementation of the Company’s CSR commitments, including climate issues.
In addition, the Supervisory Board receives the report on the work carried out by the Compensation, Appointments and Governance Committee, which:
- examines the non-financial performance criteria (related to workplace safety, climate and, more broadly, the Group’s CSR policy) proposed by the General Partners as part of a Management Board’s compensation policy aligned with the Group’s strategy;
- establishes the rate of achievement of the non-financial performance criteria (linked to the Group’s CSR policy) included in the Management Board’s compensation policy for the last financial year; and
- identifies specific skills, in particular CSR and climate-related challenges, which could enrich the Board’s work and serve as a basis for the selection of new candidates.
On cross-divisional issues likely to be the subject of joint reflection, in particular concerning CSR issues, the Committees may coordinate their work through their joint Chairmen and/or members. They may also meet in joint session at the initiative of their Chairmen.
The composition of the Supervisory Board is designed to ensure that it is able to fulfil all its duties.
In order to examine and give an opinion on its current and future composition, the Supervisory Board relies on:
- the work of its Compensation, Appointments and Governance Committee;
- the responses to a questionnaire sent annually to each of its members;
- the results of the annual assessment conducted in 2024 by the Chairman of the Supervisory Board and the Chairwoman of the Compensation, Appointments and Governance Committee;
- the results of the formalised triennial assessment of its operation conducted by a specialist firm in the last quarter of 2022 and the first quarter of 2023.
On the advice of the Compensation, Appointments and Governance Committee, the Supervisory Board ensures that its members have complementary skills (based notably on education and professional experience) and are diverse from a personal point of view (based in particular on nationality, gender and age).
Following work carried out by the Compensation, Appointments and Governance Committee, an update of the skills matrix was approved by the Supervisory Board on 5 September 2024 in order to adapt it in particular to the new objectives of the Board. Other factors are also taken into account (independence, compliance with the rules on multiple directorships and the person’s ability to fit in with the Supervisory Board’s culture).
The selection of new candidates and the renewal of the terms of office of current members are examined by the Committee and then by the Supervisory Board in the light of the above-mentioned factors, with a view to enriching the work of the Supervisory Board.
The selection of any new candidates is carried out by the Committee, which may use a specialist firm (as was the case since 2021). The candidates, selected on the basis of precise criteria (profiles, independence and skills) set by the Supervisory Board on the advice of the said Committee, are interviewed by the Committee, which forwards its opinion to the Supervisory Board. The latter selects the candidates proposed to the future Shareholders’ Meeting.
Thus, during its meeting of 13 March 2025, the Supervisory Board, on the recommendation of the Compensation, Appointments and Governance Committee, decided to propose four reappointments in view of the wide range of skills of Cécile Maisonneuve and Carine Vinardi (particularly in the areas of CSR climate and in the renewable electricity production sector) and of Alberto Pedrosa (skills covering in particular the Group’s two business segments) as well as the significant financial expertise and in-depth knowledge of market expectations of Marc-Olivier Laurent.
On the same day, the Supervisory Board, on the recommendation of the Compensation, Appointments and Governance Committee, selected a new candidate, Suzana Nutu, in particular to enable the Board to benefit from her extensive experience in listed companies and to retain, following the non-renewal of the term of office of Chantal Mazzacurati, a significant proportion of members with financial expertise.
Suzana Nutu has significant financial expertise (10 years in internal control, treasury, then as Deputy Chief Financial Officer) and in M&A (management of large-scale strategic transactions for 15 years). Her participation in the management of large listed groups (LafargeHolcim, Alstom and, currently, Sanofi) has given her a good knowledge of financial communication issues and exchanges with the market, including on CSR-related topics. Lastly, she has international experience, particularly in the African (Nigeria and South Africa) and South American (Guyana) markets in which the Group operates, but also in Central and Eastern Europe (Romania), the USA and Asia.
The Supervisory Board considered that the complementary nature of the skills would thus be maintained, with the profile of the new candidate and those of the four candidates whose terms of office are proposed for renewal helping to enrich its work and that of the Committees, thus enabling it to fully fulfil all of its missions.
Following work carried out by the Compensation, Appointments and Governance Committee, the skills matrix used for several years was updated by the Supervisory Board on 5 September 2024 so that the nature of the skills analysed corresponds precisely to the expectations and objectives thereof.
For example, noting that international experience had become a prerequisite in the selection of a new candidate, this skill was removed, while strengthening knowledge of the obligations and expectations related to the stock market listing was considered a key element and is therefore a new category.
Management
of large
international
groupsExperience
in a French
listed
companyFinancial
expertise
and M&ALegal/
ComplianceHuman
Resources
manage-
mentCSR/
ClimateFacility
Security/
Operations
and IT/Cyber-
securityEnergy
Distribution
sectorRenewable
Electricity
Production
sectorNils Christian Bergene ● ● ● Marc-Olivier Laurent ● ● ● Michel Delville ● ● ● ● ● ● Laure Grimonpret-Tahon ● ● ● ● ● ● Olivier Heckenroth ● ● ● ● Benoît Luc ● ● ● ● ● ● ● ● Cécile Maisonneuve ● ● ● ● ● Chantal Mazzacurati ● ● ● Isabelle Muller ● ● ● ● ● ● ● Alberto Pedrosa ● ● ● ● ● ● ● Ronald Sämann ● Carine Vinardi ● ● ● ● ● ● TOTAL 9 9 9 4 6 6 6 6 4 (75%) (75%) (75%) (33%) (50%) (50%) (50%) (50%) (33%) Each year, the Supervisory Board assesses the independence of its members and of potential candidates. It relies on the work carried out and the advice issued by the Compensation, Appointments and Governance Committee. To assess whether or not its members are independent, the Supervisory Board refers to the definition and criteria set out in the Afep-Medef Code. In this respect it considers that a member is independent when he/she has no relationship of any kind whatsoever with the Company, its Group or its Management that may compromise the exercise of his/her freedom of judgement. Therefore, to be qualified as independent, a member of the Supervisory Board must meet all the following criteria:
- not be, or have been during the previous five years, an employee or executive corporate officer ( dirigeant mandataire social exécutif) of the Company, or an employee, executive corporate officer or Director of one of the Company’s consolidated companies;
- not be an executive corporate officer of a company in which the Company holds a direct or indirect position as a Director, or in which an employee designated in such capacity or an executive corporate officer of the Company (currently or who has so been within the past five years) holds a directorship;
- not be a customer, supplier, investment banker, finance banker or consultant:
- that is significant to the Company or its Group, or
- for which the Company or its Group represents a significant share of business;
- not have close family ties with a corporate officer;
- not have been a Statutory Auditor of the Company during the previous five years;
- not have been a member of the Supervisory Board for more than 12 years, since a member can no longer be classified as independent as of the anniversary date of their 12 years of service;
- the Chairman of the Supervisory Board cannot be considered independent if he/she receives variable compensation in cash or securities or any compensation linked to the performance of the Company or the Group;
- not represent a significant shareholder (> 10% of share capital and/or voting rights) that exercises control over the Company.
In accordance with the recommendations of the Afep-Medef Code, the Supervisory Board is free to determine that one of its members cannot be qualified as independent even though he/she fulfils the independence criteria listed above.
After examining the situation of each of its members in the light of the work and opinion of the Compensation, Appointments and Governance Committee, the Supervisory Board, at its meeting of 13 March 2025, considered that Laure Grimonpret-Tahon, Cécile Maisonneuve, Isabelle Muller, Carine Vinardi, Nils Christian Bergene, Marc-Olivier Laurent, Michel Delville, Benoît Luc, Alberto Pedrosa and Ronald Sämann met the independence criteria set by the Company and by the Afep-Medef Code and should therefore be classified as independent. The Committee analysed the situation of Nils Christian Bergene and confirmed that, given the interruption of his term of office as a member of the Supervisory Board for six full years (between 2015 and 2021), Nils Christian Bergene met the independence criteria of the Afep-Medef Code. This classification was confirmed by the French High Committee on Corporate Governance (HCGE) in May 2024, which had been questioned on his specific case. In addition, the Compensation, Appointments and Governance Committee carried out an in-depth analysis of the situation of Marc-Olivier Laurent as non-executive Chairman of the Supervisory Board of Rothschild & Co, given the contractual relationship of this institution with the Company during the 2024 financial year. The Committee noted that Marc-Olivier Laurent did not hold an executive or operational managerial position at Rothschild & Co, that he therefore had no direct or indirect decision-making powers, either at the level of Rubis SCA or Rothschild & Co, nor was he involved in the conclusion of any mandates with the clients of Rothschild & Co and did not receive compensation of any kind in connection with these mandates. Furthermore, the Committee took into consideration the application of usual arm’s length conditions to these contractual relationships, while emphasising the non-exclusivity provision – since other mandates have been concluded with other banks – and the insignificant amount for Rothschild & Co as for the Company of fees due or paid (thus excluding any economic dependence of one on the other). The Compensation, Appointments and Governance Committee concluded that the existence of non-material business relationships on an arm’s length basis with one of the leading banks in France did not call into question the non-executive Chairman’s classification as independent. The Supervisory Board, having taken note of the work and the opinion of the said Committee, confirmed that Marc-Olivier Laurent met the independence criteria set by the Company , in accordance with the Afep-Medef Code, and should therefore be qualified as independent. Finally, the Supervisory Board considered that Chantal Mazzacurati and Olivier Heckenroth could not be qualified as independent due to their length of service within the Board.
Independence criteria Not an
employee or
corporate
officer
within the
past five
yearsAbsence
of cross-
directorshipsNo
significant
business
relationshipsNo close
family
ties with a
corporate
officerNot a
Statutory
Auditor
in the last
five yearsSeniority on
the Board
≤ 12 yearsNo variable or
performance-
related
compensationShare
capital and
voting rights
≤ 10%Indepen-
denceNils Christian Bergene ● ● ● ● ● ● ● ● ● Marc-Olivier Laurent ● ● ● ● ● ● ● ● ● Michel Delville ● ● ● ● ● ● ● ● ● Laure Grimonpret-Tahon ● ● ● ● ● ● ● ● ● Olivier Heckenroth ● ● ● ● ● ● ● Benoît Luc ● ● ● ● ● ● ● ● ● Cécile Maisonneuve ● ● ● ● ● ● ● ● ● Chantal Mazzacurati ● ● ● ● ● ● ● Isabelle Muller ● ● ● ● ● ● ● ● ● Alberto Pedrosa ● ● ● ● ● ● ● ● ● Ronald Sämann ● ● ● ● ● ● ● ● ● Carine Vinardi ● ● ● ● ● ● ● ● ● Independence rate 83% As of 13 March 2025, the independence rate of the Supervisory Board stood at 83% (which complies with the stipulations of its internal rules and the recommendations of the Afep-Medef Code).
In addition, after examining the situation of Suzana Nutu in light of the work and opinion of the Compensation, Appointments and Governance Committee, the Supervisory Board, at its meeting of 13 March 2025, considered that this candidate met the independence criteria set by the Company and by the Afep-Medef Code and should as a result be qualified as independent.
-
5.4 Corporate officer compensation
5.4.1 Principles of the compensation policy applicable to corporate officers
Decision-making process followed for the determination, review and implementation of the compensation policy
Pursuant to Article L. 22-10-76(I) of the French Commercial Code, in Partnerships Limited by Shares whose shares are admitted to trading on a regulated market:
- the policy applicable to the Management Board’s compensation is set by the General Partners (deciding unanimously, unless otherwise provided in the by-laws) after receiving an advisory opinion from the Supervisory Board and taking into account, as applicable, the principles and conditions provided for in the by-laws;
- the compensation policy applicable to members of the Board is established by the Supervisory Board.
In addition, under the terms of the internal rules of the Company’s Supervisory Board and of the Compensation, Appointments and Governance Committee:
- the advisory opinion on the General Partners’ proposal concerning the compensation policy applicable to the Management Board is issued by the Supervisory Board each year in the light of the work previously carried out by the Compensation, Appointments and Governance Committee;
- each year, the Compensation, Appointments and Governance Committee submits to the Supervisory Board a draft compensation policy applicable to Supervisory Board members.
The compensation policies applicable to the Management Board and to the members of the Supervisory Board are submitted each year (and at the time of each significant change) for the approval of the Shareholders’ Meeting (in its ordinary form).
The compensation policy applicable to the Company’s corporate officers is designed to ensure stability. However, at the beginning of each year, the General Partners review the components of the Management Board’s compensation policy to validate its consistency and relevance. The General Partners may, if necessary, propose the adjustment of certain parameters of the compensation policy in order to strengthen the structure of the compensation and align it with the interests of the shareholders and taking into account expectations expressed by the latter.
Each year, the compensation policy (ex ante) of the corporate officers is subject to the advisory opinion of the Supervisory Board before being presented to the approval of the Shareholders’ Meeting.
Under the same conditions, the compensation policy applicable to members of the Supervisory Board may be revised by a decision of the Supervisory Board and subject to the approval of the Shareholders’ Meeting.
The compensation policy for the Managing Partners does not allow the General Partners to derogate from its application, within the meaning of Article L. 22-10-76-III of the French Commercial Code.
The compensation policy for Supervisory Board members does not allow the Supervisory Board to derogate from its application, within the meaning of Article L. 22-10-76-III of the French Commercial Code.
In the event of shareholders not approving a resolution relating to a compensation policy, the compensation policy previously approved by the shareholders continues to apply and a draft resolution presenting a revised compensation policy must be submitted for approval at the next Ordinary Shareholders’ Meeting.
Each year, the Shareholders’ Meeting and that of the General Partners vote on the components (fixed, variable and exceptional) comprising the total compensation and benefits of any kind paid during or awarded in respect of the past financial year via separate resolutions for each Managing Partner (except when no compensation of any kind is paid to it during or awarded in respect of this financial year) and for the Chairman of the Supervisory Board.
If the compensation policy approved by the Shareholders’ Meeting is not complied with, no compensation of any kind whatsoever may be determined, awarded or paid by the Company, under penalty of being null and void.
Prior to the shareholders’ vote, in accordance with its internal rules, the Company’s Compensation, Appointments and Governance Committee:
- determines the components of compensation to be paid or awarded in respect of the past financial year to the Management Board in accordance with the policy approved by the Shareholders’ Meeting held during this financial year. The Supervisory Board verifies the compliance of these items with this policy;
- determines the components of compensation to be paid or awarded in respect of the past financial year to the Chairman of the Supervisory Board in accordance with the policy approved by the Shareholders’ Meeting held during this financial year. The Supervisory Board verifies the compliance of these items with this policy;
- proposes an allocation of the aggregate amount to be granted to the members of the Board in respect of the past financial year. The Supervisory Board verifies that such amount and breakdown comply with the policy it established for the past financial year and which was approved by shareholders during this financial year.
Lastly, with the approval of the General Partners, the Shareholders’ Meeting votes on a single draft resolution concerning information on the fixed, variable and exceptional compensation paid during or awarded in respect of the past financial year to all corporate officers.
Compensation policy in line with the corporate interest, business strategy and the sustainability of the Company
On the advice of the Supervisory Board, the General Partners ensure that the compensation policy applicable to the Management Board complies with the Company’s corporate interest, is in line with its business strategy and contributes to the Company’s sustainability.
Thus, the compensation policy applicable to the Management Board is in line with the Company’s interests to the extent that:
- its overall amount is measured against that paid to executive corporate officers of companies with equivalent market capitalisation (the Company conducts in-house studies or commissions studies from external firms to ensure this on a regular basis);
- the conditions governing employee compensation are taken into account since the fixed compensation of Gilles Gobin, Sorgema, Agena and GR Partenaires as Managing Partners is updated according to the indexed change in the hourly salary rates of employees (which in the meantime guarantees that any change in the fixed compensation is moderate);
- the annual variable compensation is capped; and
- no exceptional compensation of any kind is authorised.
The General Partners and the Supervisory Board are also kept informed of the equity ratios and changes in those ratios in relation to the compensation of corporate officers and employees and the Company’s performance.
The Management Board’s compensation policy is in line with the Group’s commercial strategy and contributes to the Company’s long-term viability, insofar as the criteria for annual variable compensation and the multi-year variable compensation (that Jean-Christian Bergeron and Marc Jacquot will benefit from) are based on results in line with the Group’s objectives (as set out in the budget or guidance), the performance of the Group’s new business line and consideration of CSR issues as a whole (gradual improvement of employees’ working conditions through the setting of health/safety objectives and gradual reduction in CO2e emissions).
Under the same conditions, the Supervisory Board ensures that the compensation policy that applies to its members is consistent with the Company’s corporate interest and contributes to its sustainability. Thus, the maximum annual compensation package of the Supervisory Board is measured and compared with the packages of non-executive corporate officers of companies with equivalent market capitalisation. The Compensation, Appointments and Governance Committee relied on a comparative study of market practices (based on a sample of 29 companies, (public limited companies in French SA or SE form listed on the SBF 120 with a market capitalisation close to that of the Company (between €2 and €4.5 billion) and listed partnerships limited by shares, French SCAs) to propose to the Supervisory Board the changes submitted to the 2025 Shareholders’ Meeting. In addition, this compensation is related in part to each member’s responsibilities (chairing and/or membership of Committees) and to his/her attendance.
Finally, just like the expectations expressed by shareholders during the governance roadshows led by the Chairman of the Supervisory Board, the remarks and votes expressed by shareholders on compensation issues during Shareholders’ Meetings are analysed by the General Partners, on the one hand, and by the Supervisory Board and its Compensation, Appointments and Governance Committee, on the other. Thus, taking into consideration the 72% support for the Management Board’s compensation policy for the 2024 financial year by the Shareholders’ Meeting of 11 June 2024, the General Partners have proposed to the market their intention to change the structure of the Managing Partners’ annual variable compensation as of the 2025 financial year in order to adjust the nature of certain criteria as well to introduce more linearity in the achievement scales and full alignment with benchmarks (budget or guidance), which are themselves demanding in nature.
-
5.5 Additional information
No Managing Partner or member of the Supervisory Board has any conflict of interest between his/her duties to Rubis and his/her private interests and/or other duties to which he/she is bound.
To Rubis’ knowledge, and regardless of the regulated agreements and commitments, there is no arrangement or agreement between the Company and the main shareholders, clients, suppliers or others pursuant to which the members of the Supervisory Board or the Managing Partners have been selected.
No Managing Partner or member of the Supervisory Board has ever been convicted of fraud, filed for bankruptcy or been placed in receivership or liquidation.
No Managing Partner or member of the Supervisory Board has ever been the subject of a criminal prosecution or official public sanction pronounced by statutory or regulatory authorities.
No Managing Partner or member of the Supervisory Board has ever been prevented by a court from acting as member of an issuer’s administrative, management or supervisory body, or from being involved in the management or direction of an issuer’s affairs in the last five years at least.
Absence of any agreements binding a member of the Supervisory Board or a Managing Partner to Rubis or to one of its subsidiaries
There are no service contracts binding the Managing Partners or the members of the Supervisory Board to Rubis or any one of Rubis’ subsidiaries.
No loans or guarantees have been granted or made on behalf of the Managing Partners or the members of the Supervisory Board.
The Group’s related parties include affiliates (joint undertakings and joint ventures, see notes 8 and 9 to the consolidated financial statements) and the main Managers and close members of their family.
Agreements entered into by Rubis SCA with subsidiaries that it does not, directly or indirectly, wholly-own (such as Rubis Terminal, RT Invest, Rubis Terminal Infra and Rubis Photosol), may be classified as related-party agreements and be the subject of the Statutory Auditors’ special report on related-party agreements mentioned below.
Transactions between the parent company and its fully consolidated subsidiaries are eliminated in the consolidated financial statements.
Related-party agreements are described in the Statutory Auditors’ special report on related-party agreements in chapter 7, section 7.4.3. They are also explained in the presentation of the draft resolutions in the Notice of meeting for the Shareholders’ Meeting of 12 June 2025.
Procedure for assessing agreements relating to ordinary course transactions entered into on arm’s length terms
In accordance with Article L. 22-10-12 of the French Commercial Code, an internal charter on the regular assessment of regulated and non-regulated agreements was adopted by the Supervisory Board at its meeting of 12 March 2020.
On 10 March 2022, the Supervisory Board amended this charter for the purpose of specifying that the assessment of any agreement relating to an ordinary transaction entered into under arm’s length terms would be carried out by the Company’s internal departments, with the assistance of the Statutory Auditors, if need be.
The Supervisory Board meeting of 13 March 2025 was informed by the Secretary of the Supervisory Board that no difficulties were encountered in the implementation of this procedure during the 2024 financial year. The Supervisory Board therefore considered that no improvements needed to be made.
Restrictions on the disposal by members of the Supervisory Board and Managing Partners of their interests in Rubis’ share capital
To Rubis’ knowledge, no restrictions have been agreed by the Managing Partners or by the members of the Supervisory Board with respect to the sale of their shares in the Company, with the exception of rules governing trading in Rubis securities provided for by applicable legal provisions (see the section entitled “Blackout periods” below).
Internal prudential rules provide for blackout periods during which time transactions in Rubis securities are prohibited for the Managing Partners and members of the Supervisory Board as well as for certain employees and external suppliers. These blackout periods start 30 days prior to the date scheduled for the publication of the annual and half-year results and 15 days prior to the date scheduled for the publication of quarterly revenue, and end the day after publication of such results. Furthermore, and in any event, trading in Rubis securities is prohibited if inside information is held (and until the day after its publication).
To the Company’s knowledge, the Managing Partners and members of the Supervisory Board of Rubis carried out the following transactions involving the Company’s securities in the 2024 financial year:
19 March 2024 • Vesting by Clarisse Gobin-Swiecznik of 6,884 Rubis shares at a price of €24.64 each. 6 November 2024 • Vesting by Ronald Sämann of 100,000 Rubis shares at a price of €22.06 each. 11 December 2024 • Vesting by Nils Christian Bergene of 1,200 Rubis shares at a price of €23.40 each. Summary table of delegations of authority to increase the share capital currently in force and use made of such delegations in 2024
This table, which is an integral part of the Supervisory Board’s report on corporate governance, appears in chapter 6, section 6.2.4 of this Universal Registration Document.
The procedures for shareholder participation and voting at Shareholders’ Meetings, which form an integral part of the Supervisory Board’s report on corporate governance, are set out in chapter 6, section 6.1.4 of this Universal Registration Document. They are described in Articles 34 to 40 of the Company’s by-laws (which are available on the Company’s website).
None of the elements described in Article L. 22-10-11 of the French Commercial Code is liable to have an impact in the event of a public tender offer or exchange offer.
In accordance with the standard NEP 9510 published on 7 October 2018, the Statutory Auditors’ specific verifications implemented pursuant to Article L. 22-10-71 of the French Commercial Code on the Supervisory Board’s report on corporate governance are described in the Statutory Auditors’ report on the annual financial statements in chapter 7, section 7.4.2 of this Universal Registration Document.
-
6 INFORMATION ABOUT THE COMPANY AND ITS CAPITAL
-
6.1 Information about the Company
Rubis is a French Partnership Limited by Shares (société en commandite par actions) governed by Articles L. 226-1 to L. 226-14 and L. 22-10-74 to L. 22-10-78 of the French Commercial Code and, insofar as they are compatible with the above-mentioned articles, by the provisions relating to Limited Partnerships (sociétés en commandite simple) and public limited companies (sociétés anonymes). In application of this legal framework, the Company is also governed by its by-laws.
- General Partners, who have the status of merchants and are indefinitely and jointly and severally liable for corporate debts;
- Limited Partners (or shareholders), who are non-merchants and whose liability is limited to the amount of their contributions.
The law and Rubis’ by-laws make the Partnership Limited by Shares a modern structure that is adapted to the principles of good corporate governance, as reflected by:
- the very clear separation of powers between the Management Board, which governs corporate affairs, and the Supervisory Board, whose members are appointed by the shareholders and which is tasked with overseeing the Company’s management, and notably giving its opinion on the compensation policy applicable to the Management Board, determining the components of the compensation to be awarded and paid ex-post to corporate officers and monitoring projects implemented as part of the sustainability work, including the sustainability report (CSRD);
- the unlimited personal liability of the General Partner, which attests to the appropriate match between commitment of assets, power and responsibility;
- the awarding to the Supervisory Board of the same powers and rights to communication and of investigation as those granted to the Statutory Auditors;
- the right of shareholders to oppose the appointment of a candidate for the Management Board when he/she is not a General Partner.
6.1.1 General Partners
- Gilles Gobin;
- Sorgema, a limited liability company (société à responsabilité limitée) whose Managers are Gilles Gobin and Clarisse Gobin-Swiecznik and whose shareholders are members of the Gobin family group;
- GR Partenaires, a limited partnership whose General Partners are the Gobin family group companies and Jacques Riou. The Limited Partners of GR Partenaires are Agena and members of the Riou family group.
-
6.2 Information on share capital and share ownership
6.2.1 Share capital as of 31 December 2024
-
6.3 Dividends
6.3.1 Dividend paid to the Limited Partners (or shareholders)
The Company pursues a stable dividend policy, with a payout ratio of around 60% to 75% taking into consideration the Group’s generation of free cash flow.
The capital gain recorded following the disposal of the Company’s stake in Rubis Terminal gave rise to the exceptional payment, on 8 November 2024, of an interim dividend for 2024 of €0.75 per share, to which will be added the amount of the annual ordinary dividend paid as part of the Company’s distribution policy.
Accordingly, the Company will propose to the 2025 Shareholders’ Meeting a total dividend (exceptional interim dividend and annual ordinary dividend) of €2.78 per ordinary share, i.e., €0.75 per ordinary share corresponding to the interim dividend paid on 8 November 2024 and €2.03 per ordinary share as an annual ordinary dividend. Excluding the exceptional payment of the interim dividend, the dividend per share increased more than 2.5% compared to the dividend paid for the 2023 financial year (€1.98 per ordinary share).
Date of Shareholders’ Meeting Financial year
concernedNumber of shares concerned Net dividend
paid
(in euros)Total net amounts
distributed
(in euros)11/06/2024 2023 103,524,854 ordinary shares 1.98 204,979,211 08/06/2023 2022 102,876,685 ordinary shares 1.92 197,523,235 09/06/2022 2021 102,720,441 ordinary shares
514 preferred shares1.86
0.93191,060,020
47810/06/2021 2020 100,950,230 ordinary shares
5,188 preferred shares1.80
0.90181,710,414
4,66911/06/2020 2019 100,345,050 ordinary shares
3,722 preferred shares1.75
0.87175,603,837
3,238 -
6.4 Employee shareholding
As of 31 December 2024, Group employees owned 2.17% of Rubis’ share capital and voting rights through the Rubis Avenir mutual fund. Since the fund was put in place in 2002, Rubis has carried out an employee shareholding scheme for employees and/or corporate officers of eligible companies (companies with their registered office in France) every year. All these transactions have attracted a high level of participation by the Group’s employees.
6.4.1 Capital increase reserved for Group employees: 2024 transaction
Acting pursuant to the Combined Shareholders’ Meeting’s delegation of 8 June 2023, on 5 January 2024, the Management Board carried out a capital increase reserved for employees of eligible Group companies through the FCP Rubis Avenir mutual fund.
In accordance with Article L. 3332-19 of the French Labour Code and the delegation granted by the shareholders, the subscription price for new shares was set at 70% of the average opening prices during the 20 trading days preceding the 5 January 2024 meeting. This average amounted to €22.44, resulting in a subscription price of €15.71.
This transaction resulted in the subscription of 559,881 new shares for a total amount of €8,795,730.51, representing the payment of the par value in the amount of €699,851.25 and a share premium in the amount of €8,095,879.26. The subscription rate of the Group’s employees was 65.95%.
A new employee shareholding scheme through the sale of shares previously bought back by the Company as part of the share buyback programme authorised by the Ordinary Shareholders’ Meeting of 11 June 2024 (22nd resolution) was approved by the Management Board on 2 January 2025. The scheme involves a maximum of 400,000 shares and is ongoing at the date of filing of this document.
-
6.5 Stock options, performance shares and preferred shares
In accordance with the provisions of Articles L. 225-184 and L. 225-197-4 of the French Commercial Code, this section constitutes the special report of the Management Board on stock options, performance shares and preferred shares.
6.5.1 Award policy
The Company has set up stock option plans and performance share plans to motivate and retain high-potential executives and Senior Managers of subsidiaries whom it wishes to keep in its workforce over the long term to ensure its future growth. These plans also enable the Company to ensure that the interests of beneficiaries are aligned with those of shareholders over the long term.
The Managing Partners and the General Partners of the Company do not benefit from any such plan. Subject to the approval of the Shareholders’ Meeting of 12 June 2025, Jean-Christian Bergeron and Marc Jacquot will join the Management Board from 1 October 2025. The compensation policy applicable to them as Managing Partners from that date provides for an annual allocation of shares subject to performance conditions.
In accordance with the recommendations of the Afep-Medef Code, all plans issued by the Company are fully subject to performance conditions and a condition of the beneficiaries being in the Group’s workforce. The latter is assessed on the day of the exercise of the options or on the day of the vesting of the performance shares.
-
6.6 Relations with investors and financial analysts
The Group’s Management and the Financial Communication Department maintain a regular dialogue with financial analysts and all of the Company’s shareholders, whether individual or institutional, French or foreign, current or potential.
Roadshows and conferences are regularly organised by financial intermediaries in the main financial markets.
A series of meetings is in particular organised to mark the presentation of the annual results (in March), the half-year results (in September), at the time of the publication of the quarterly activity report or any other significant event.
In total, in 2024, more than 280 meetings were organised in France and abroad (seven countries covered).
Documents and information relating to the Company (in particular its by-laws and other corporate documents such as the Notice of meeting) and the 2024 consolidated financial statements may be consulted on the Company’s website (www.rubis.fr). The consolidated financial statements and the separate financial statements for 2024 and those of previous years are also available at the Company’s registered office, under the conditions provided for by law.
The Company’s press releases, the 2022 and 2023 Universal Registration Documents and earlier Registration Documents filed with the French Financial Markets Authority (AMF), together with their updates, where applicable, are available on the Company’s website.
Presentations made by the Group at the time its annual and half-year results are published, as well as quarterly financial information (revenue for the first, third and fourth quarters) and presentations relating to strategy and sustainability challenges can also be consulted on the Company’s website.
Regulated information is posted on the Company’s website for at least five years and on the website of the French Legal and Administrative Information Directorate (www.info-financiere.fr).
Finally, declarations on the crossing of thresholds are published on the AMF’s website (www.amf-france.org).
Trade and Companies Register: 784 393 530 RCS Paris
LEI: 969500MGFIKUGLTC9742
APE code: 6420Z
ISIN code: FR0013269123
Listing venue: Euronext Paris
Main indices: CAC MID 60 and SBF 120 -
7 FINANCIAL STATEMENTS
-
7.1 2024 consolidated financial statements and notes
(in thousands of euros) Notes 31/12/2024 31/12/2023 Non-current assets Intangible assets 4.3 113,618 90,665 Goodwill 4.2 1,763,436 1,659,544 Property, plant and equipment 4.1.1 1,895,219 1,746,515 Property, plant and equipment – right-of-use assets 4.1.2 248,901 230,764 Interests in joint ventures 9 29,385 310,671 Other financial assets 4.5.1 127,522 168,793 Deferred taxes 4.6 24,687 28,770 Other non-current assets 4.5.3 188,463 11,469 TOTAL NON-CURRENT ASSETS (I) 4,391,231 4,247,191 Current assets Inventory and work in progress 4.7 715,790 651,853 Trade and other receivables 4.5.4 871,761 781,410 Tax receivables 30,844 34,384 Other current assets 4.5.2 48,095 42,214 Cash and cash equivalents 4.5.5 676,373 589,685 TOTAL CURRENT ASSETS (II) 2,342,863 2,099,546 TOTAL ASSETS (I + II) 6,734,094 6,346,737 (in thousands of euros) Notes 31/12/2024 31/12/2023 Shareholders’ equity – Group share Share capital 129,005 128,994 Share premium 1,537,708 1,553,914 Retained earnings 1,166,915 948,449 TOTAL 2,833,628 2,631,357 NON-CONTROLLING INTERESTS 127,739 131,588 EQUITY (I) 4.8 2,961,367 2,762,945 Non-current liabilities Borrowings and financial debt* 4.10.1 1,206,174 1,166,074 Lease liabilities 4.10.1 220,350 200,688 Deposit 152,681 151,785 Provisions for pensions and other employee benefit obligations 4.12 52,907 40,929 Other provisions 4.11 184,542 137,820 Deferred taxes 4.6 73,177 83,659 Other non-current liabilities 4.10.3 163,472 148,259 TOTAL NON-CURRENT LIABILITIES (II) 2,053,303 1,929,214 Current liabilities Borrowings and bank overdrafts (portion due in less than one year)* 4.10.1 762,505 783,519 Lease liabilities (portion due in less than one year) 4.10.1 37,116 38,070 Trade and other payables 4.10.4 863,686 792,512 Current tax liabilities 39,601 25,245 Other current liabilities 4.10.3 16,516 15,232 TOTAL CURRENT LIABILITIES (III) 1,719,424 1,654,578 TOTAL EQUITY AND LIABILITIES (I + II + III) 6,734,094 6,346,737 (in thousands of euros) Notes Change 31/12/2024 31/12/2023 NET REVENUE 5.1 0% 6,643,939 6,629,977 Consumed purchases 5.2 (4,943,668) (4,945,929) External expenses 5.4 (540,764) (488,810) Payroll expenses 5.3 (289,855) (253,739) Taxes (148,659) (143,646) Gross operating income (EBITDA) -10% 720,993 797,853 Other operating income 2,834 6,740 Net depreciation and provisions 5.5 (214,617) (189,454) Other operating income and expenses 5.6 (5,415) 6,222 Current operating income -19% 503,795 621,361 Other operating income and expenses 5.7 86,396 7,350 Operating income before share of net income from joint ventures -6% 590,191 628,711 Share of net income from joint ventures 9 6,806 14,930 Operating income after share of net income from joint ventures -7% 596,997 643,641 Income from cash and cash equivalents 12,828 15,869 Cost of gross financial debt (95,940) (87,858) Cost of net financial debt 5.8 +15% (83,112) (71,989) Interest expense on lease liabilities (13,463) (12,370) Other finance income and expenses 5.9 (67,884) (134,409) Profit (loss) before tax +2% 432,538 424,873 Income tax 5.10 (81,435) (57,860) Total net income -4% 351,103 367,013 Net income, Group share -3% 342,293 353,694 Net income, non-controlling interests -34% 8,810 13,319 Earnings per share (in euros) 5.11 -4% 3.30 3.43 Diluted earnings per share (in euros) 5.11 -4% 3.30 3.42 (in thousands of euros) 31/12/2024 31/12/2023 TOTAL CONSOLIDATED NET INCOME (I) 351,103 367,013 Foreign exchange reserves (excluding joint ventures) 161,516 (182,210) Hedging instruments (7,553) (26,782) Income tax on hedging instruments 1,951 6,917 Financial assets at fair value through comprehensive income (21,259) (21,006) Restatements due to hyperinflation 38,801 18,647 Taxes on restatements due to hyperinflation - (215) Items recyclable in P&L from joint ventures 2,454 (7,596) Items that will subsequently be recycled in P&L (II) 175,910 (212,245) Actuarial gains and losses (9,149) (3,836) Income tax on actuarial gains and losses 1,020 65 Change in fair value of buyback option on non-controlling interests (16,100) (39,200) Items not recyclable in P&L from joint ventures - 73 Items that will not subsequently be recycled in P&L (III) (24,229) (42,898) COMPREHENSIVE INCOME FOR THE PERIOD (I + II + III) 502,784 111,870 Share attributable to the owners of the Group’s parent company 494,113 104,559 Share attributable to non-controlling interests 8,671 7,311 Shares
outstandingOf which
treasury
sharesShare
capitalShare
premiumTreasury
sharesConsolidated
reserves and
earningsTranslation
differencesShareholder’s
equity
attributable to
the owners of the
Group’s parent
companyNon-controlling
interestsTotal
consolidated
shareholders’
equity(in number of shares) (in thousands of euros) EQUITY AS OF 31/12/2022 102,953,566 84,987 128,692 1,550,120 (1,990) 1,247,246 (190,604) 2,733,464 126,826 2,860,290 Comprehensive income for the period 283,586 (179,027) 104,559 7,311 111,870 Change in interest (22,399) (22,399) 9,673 (12,726) Share-based payments 8,666 8,666 8,666 Capital increase 241,606 302 3,794 4,096 1,763 5,859 Treasury shares (22,456) 633 (131) 502 502 Dividend payment (197,524) (197,524) (13,985) (211,509) Other changes (7) (7) (7) EQUITY AS OF 31/12/2023 103,195,172 62,531 128,994 1,553,914 (1,357) 1,319,437 (369,631) 2,631,357 131,588 2,762,945 Comprehensive income for the period 334,071 160,042 494,113 8,671 502,784 Change in interest (1,170) (1,170) (855) (2,025) Share-based payments 8,415 8,415 67 8,482 Capital increase 1,009,079 1,261 7,571 8,832 537 9,369 Capital decrease (1,000,000) (1,250) (23,777) (25,027) (25,027) Treasury shares 23,148 (796) 182 (614) (614) Dividend payment (282,284) (282,284) (12,269) (294,553) Other changes 6 6 6 EQUITY AS OF 31/12/2024 103,204,251 85,679 129,005 1,537,708 (2,153) 1,378,657 (209,589) 2,833,628 127,739 2,961,367 (in thousands of euros) 31/12/2024 31/12/2023 TOTAL CONSOLIDATED NET INCOME FROM CONTINUING OPERATIONS 351,103 367,013 Adjustments: Elimination of income of joint ventures (6,806) (14,930) Elimination of depreciation and provisions 250,269 222,146 Elimination of profit and loss from disposals (89,197) 1,344 Elimination of dividend earnings (708) (363) Other income and expenditure with no impact on cash and cash equivalents(1) 14,702 7,623 CASH FLOW AFTER COST OF NET FINANCIAL DEBT AND TAX 519,363 582,833 Elimination of income tax expenses 81,435 57,860 Elimination of the cost of net financial debt and interest expense on lease liabilities 96,574 84,359 CASH FLOW BEFORE COST OF NET FINANCIAL DEBT AND TAX 697,372 725,052 Impact of change in working capital* 38,792 (91,682) Income tax paid (70,986) (70,752) CASH FLOWS RELATED TO OPERATING ACTIVITIES 665,178 562,618 Impact of changes to consolidation scope (cash acquired – cash disposed) 6,592 387 Acquisition of financial assets: Energy Distribution division (8,291) (3,396) Acquisition of financial assets: Renewable Electricity Production division(2) (10,210) (8,543) Disposal of financial assets: Rubis Terminal JV(2) 124,403 - Acquisition of property, plant and equipment and intangible assets (247,862) (283,340) Change in loans and advances granted 13,230 (30,252) Disposal of property, plant and equipment and intangible assets 4,619 6,175 (Acquisition)/disposal of other financial assets (161) (193) Dividends received 6,340 6,111 CASH FLOWS RELATED TO INVESTING ACTIVITIES (111,340) (313,051) (in thousands of euros) Notes 31/12/2024 31/12/2023 Capital increase 4.8 8,832 4,096 Share buyback (capital decrease) 4.8 (25,027) - (Acquisition)/disposal of treasury shares (796) 633 Borrowings issued 4.10.1 1,303,894 1,028,541 Borrowings repaid 4.10.1 (1,328,075) (1,092,443) Repayment of lease liabilities 4.10.1 (41,993) (36,516) Net financial interest paid(3) (97,384) (81,285) Dividends payable (282,284) (197,524) Dividends payable (non-controlling interests) (12,269) (13,993) Acquisition of financial assets: Renewable Electricity Production division (2,827) (14,627) Other cash flows from financing operations 1,065 8,502 CASH FLOWS RELATED TO FINANCING ACTIVITIES (476,864) (394,616) Impact of exchange rate changes 9,714 (70,173) CHANGE IN CASH AND CASH EQUIVALENTS 86,688 (215,222) Cash flows from continuing operations Opening cash and cash equivalents(4) 4.5.5 589,685 804,907 Change in cash and cash equivalents 86,688 (215,222) Closing cash and cash equivalents(4) 4.5.5 676,373 589,685 Financial debt excluding lease liabilities 4.10.1 (1,968,679) (1,949,593) Cash and cash equivalents net of financial debt (1,292,306) (1,359,908) - Including change in fair value of financial instruments, IFRS 2 expense, etc.
- The impact of changes in scope is described in note 3.
- Net financial interest paid includes the impacts related to restatements of leases (IFRS 16).
- Cash and cash equivalents net of bank overdrafts.
* Breakdown of the impact of change in working capital: Notes 31/12/2024 31/12/2023 Impact of change in inventories and work in progress 4.7 (41,465) (79,897) Impact of change in trade and other receivables 4.5.4 38,788 (68,257) Impact of change in trade and other payables 4.10.4 41,469 56,472 Impact of change in working capital 38,792 (91,682) The financial statements for the financial year ended 31 December 2024 were finalised by the Management Board on 16 April 2025 and approved by the Supervisory Board on 17 April 2025, who authorised their publication.
The 2024 consolidated financial statements have been prepared in accordance with the international accounting standards issued by the IASB (International Accounting Standards Board) and adopted by the European Union. These standards include IFRS (International Financial Reporting Standards) and IAS (International Accounting Standards), as well as the interpretations of the IFRS Interpretations Committee.
Rubis SCA (hereinafter “the Company” or, together with its subsidiaries, “the Group”) is a Partnership Limited by Shares registered and domiciled in France. Its registered office is located at 46, rue Boissière 75116 Paris, France.
- Energy Distribution, which includes the distribution of fuels, heating oils, lubricants, liquefied gases and bitumen, as well as logistics, which includes trading-supply, the refining activity and shipping;
- the Renewable Electricity Production, which mainly includes the Photovoltaic Electricity Production business (Rubis Photosol) specialising in large ground-based facilities, car park shades and rooftop installations for professionals.
The Rubis Terminal Invest joint venture (hereinafter “Rubis Terminal”) specialises in the Bulk Liquid Storage of products (fuels, chemicals and agrifood products) for commercial and industrial customers. It was recognised in the Group’s financial statements according to the equity method until 31 March 2024 (see note 3.2.1).
The consolidated financial statements are prepared based on historical costs with the exception of certain categories of assets and liabilities, in accordance with IFRS rules. The categories concerned are specified in the notes below.
To prepare its financial statements, the Group’s Management must make estimates and assumptions that affect the carrying amount of assets and liabilities, income and expenses, and the information disclosed in the notes to the financial statements.
The Group’s Management makes these estimates and assessments on an ongoing basis according to past experience as well as various factors that are deemed reasonable and that constitute the basis for these assessments.
The amounts that will appear in its future financial statements may differ from these estimates, in accordance with changes in these assumptions or different conditions.
The main estimates made by the Group’s Management relate, in particular, to the fair values of assets and liabilities acquired in business combinations, the recoverable value of goodwill and intangible assets and property, plant and equipment, and the measurement of employee benefit obligations (including share-based payments), the measurement of other provisions and leases (lease term used and incremental borrowing rates, described in note 4.1.2) and the measurement of options to purchase non-controlling interests.
The consolidated financial statements for the financial year ended 31 December 2024 include the financial statements of Rubis SCA and its subsidiaries.
The results and financial position of Group subsidiaries whose functional currency differs from the reporting currency (i.e., the euro) and is not the currency of an economy in hyperinflation, are translated according to the following principles:
- assets and liabilities are translated at the exchange rate prevailing as of the reporting date;
- income and expenses are translated at the average exchange rate for the period;
- these foreign exchange differences are recognised in other comprehensive income, under “Foreign exchange reserves”;
- cumulative translation differences are reclassified to profit or loss in the event of the disposal or liquidation of the equity interest to which they relate.
Goodwill and fair value adjustments arising on the acquisition of a foreign entity are treated as assets and liabilities of the foreign entity and translated at the exchange rates prevailing as of the balance sheet date.
All significant transactions conducted between consolidated companies as well as internal profits are eliminated.
Foreign exchange differences arising from the elimination of transactions and transfers of funds denominated in foreign currencies between consolidated companies, are subject to the following accounting treatment:
- foreign exchange differences arising from the elimination of internal transactions are recorded as “Translation differences” in equity and as “Non-controlling interests” for the portion attributable to third parties, thereby offsetting their impact on consolidated income;
- foreign exchange differences on fund movements for reciprocal financing are classified under a separate heading in the consolidated statement of cash flows.
The consolidated financial statements are prepared in euros and the financial statements are presented in thousands of euros.
Since 2021, Suriname has been a hyperinflationary country. The impacts of hyperinflation in this country were not material across the Group over the financial year.
Haiti has been considered to be a hyperinflationary economy since 2023 on the basis of the criteria set out in IAS 29 “Financial reporting in hyperinflationary economies”, and, in particular, a cumulative inflation rate in Haiti over the last three years of more than 100%.
IAS 29 requires that financial statements based on historical value be restated in order to correct the loss in the general purchasing power of the local currency. This consists of applying a consumer price index to each historical value presented in the financial statements so that the financial statements are presented in units that are current at the end of the reporting period. The change in the consumer price indices, for example those published by the Haitian Institute of Statistics and Information for Haiti, was used by the Group to take into account the impacts of hyperinflation.
- the revaluation of goodwill and property, plant and equipment (including right-of-use assets) of €20 million and €18 million respectively;
- an increase in consolidated equity excluding profit or loss for the period of €39 million (other comprehensive income) and an expense of €10 million recognised in “Other finance income and expenses”.
STANDARDS, INTERPRETATIONS AND AMENDMENTS ADOPTED BY THE EUROPEAN UNION AND MANDATORY FROM 1 JANUARY 2024
The following standards, interpretations and amendments, published in the Official Journal of the European Union as of the reporting date, were applied for the first time in 2024:
These standards, interpretations and amendments had no material impact on the Group’s financial statements as of 31 December 2024.
The Group has not opted for the early adoption of the standards, interpretations and amendments whose application is not mandatory as of 31 December 2024 or which have not yet been adopted by the European Union.
The Group does not carry out any transactions in Ukraine or Russia and has no assets in these territories. In addition, it does not source from Ukrainian or Russian suppliers. To date, the Group has not identified any direct exposure to this risk.
Accounting policies
The Group applies IFRS 10, 11 and 12, as well as amended IAS 28, on the scope of consolidation.
Full consolidation
All companies in which Rubis exercises control, i.e., in which it has the power to influence the financial and operating policies in order to obtain benefits from their activities, are fully consolidated.
Control as defined by IFRS 10 is based on the following three criteria that must be met simultaneously in order to determine the exercise of control by the parent company:
- the parent company has power over the subsidiary when it has effective rights that give it the ability to direct the relevant activities, i.e., activities that have a significant impact on the subsidiary’s returns. Power may be derived from voting rights (existing and/or potential) and/or contractual arrangements. The assessment of power depends on the nature of the relevant activities of the subsidiary, the decision-making process within it and the breakdown of the rights of its other shareholders;
- the parent company is exposed or entitled to variable returns due to its ties with the subsidiary, which may vary depending on its performance;
- the parent company has the ability to exercise its power to influence returns.
Joint arrangements
In a joint arrangement, the parties are bound by a contractual agreement giving them joint control of the Company. Joint control is deemed to exist when decisions regarding the relevant activities require the unanimous consent of the parties that collectively control the business.
Joint arrangements are classified in one of two categories:
- joint operations: these are partnerships in which the parties exercising joint control over the business have direct rights to the assets and obligations for related liabilities, of the business. Joint operations are accounted for according to the percentage interest held by the Group in the assets and liabilities of each joint operation;
- joint ventures: these are partnerships in which the parties exercising joint control over the business have rights to the net assets of the enterprise. The Group accounts for its joint ventures using the equity method, in accordance with IAS 28.
The consolidated financial statements for the financial year ended 31 December 2024 include the Rubis SCA financial statements and those of its subsidiaries listed the table in note 12.
The changes in the scope of consolidation concerned business combinations as defined by IFRS 3, the acquisition of groups of assets and disposals.
Following the final agreement signed on 10 April 2024, Rubis completed on 16 October 2024 the disposal of its 55% stake in the Rubis Terminal JV (now called Tepsa) to I Squared Capital for a selling price of €384 million.
In 2024, Rubis received an initial payment of €124 million. The balance (€260 million excluding interest) will be received in three instalments of the same amount in 2025, 2026 and 2027.
The gain on disposal net of commissions and other expenses stands at €89 million and is presented under “Other operating income and expenses”.
The line “Share of net income from joint ventures” as of 31 December 2024 includes Rubis’ share of Rubis Terminal’s net income for the period from 1 January 2024 to 31 March 2024, date the investment was classified as “assets held for sale” in accordance with IFRS 5.
During 2024, Rubis Photosol continued its development, by making several investments in projects located in France and Italy in particular and reaching the RTB stage (Ready-to-Build). The intangible asset recognised as of 31 December 2024 in respect of these transactions amounted to €9.8 million. Rubis Photosol also acquired 51% of the shares of ENER 5, a specialist in roof-based photovoltaic activities. The impacts on the consolidated financial statements, including goodwill at the end of December 2024, are not material.
At the same time, the Energy Distribution sector made two equity investments in the renewable energy sector. Soleco Energy Limited (35.3%) and EZdrive Antilles (49%) are both classified as partnerships and consolidated using the equity method. Their contributions to the 2024 financial statements are not material.
In addition, the Rubis Energy Burundi subsidiary was included in the scope of consolidation as of 1 January 2024. This entity, acquired in 2019 as part of the KenolKobil acquisition, was not consolidated due to political and monetary problems. The situation has returned to normal and activities are now operating unhindered. The impacts on the consolidated financial statements as of 31 December 2024 are not material.
Accounting policies
The gross amount of property, plant and equipment corresponds to its acquisition cost.
Maintenance and repair costs are recorded as expenses as soon as they are incurred, except for those incurred to extend the useful life of the asset, in particular during shutdowns for major maintenance, which are then recorded as fixed assets and depreciated over the period between two shutdowns.
Depreciation is calculated according to the straight-line method for the estimated useful life of the various categories of fixed assets, as follows:
Duration Buildings 10 to 40 years Technical facilities 10 to 20 years Equipment and tools 5 to 30 years Transport equipment 4 to 5 years Facilities and fixtures 10 years Office equipment and furniture 5 to 10 years The depreciation periods result from the different types of property, plant and equipment within the various activities, in particular buildings, complex facilities and equipment or tooling.
Borrowing costs are included in fixed asset costs when significant.
Gross value
(in thousands
of euros)31/12/2023 Change
in scopeAcquisitions Disposals Reclassifications Hyperinflation Translation
differences31/12/2024 Other property, plant and equipment 350,308 427 17,103 (4,376) 10,864 7,254 6,033 387,613 Prepayments and down payments on property, plant and equipment 8,908 6,727 (127) (12,794) 171 2,885 Assets in progress 222,978 3,668 179,079 (1,697) (192,900) 553 7,372 219,053 Machinery, equipment and tools 2,037,943 1,049 31,806 (31,200) 94,624 18,807 43,340 2,196,369 Land and buildings 1,135,881 2,790 4,899 (12,941) 100,035 41,106 26,061 1,297,831 TOTAL 3,756,018 7,934 239,614 (50,341) (171) 67,720 82,977 4,103,751 Depreciation
(in thousands
of euros)31/12/2023 Change
in scopeIncreases Disposals Reclassifications Hyperinflation Translation
differences31/12/2024 Other property, plant and equipment (189,433) (256) (16,783) 3,629 (73) (7,141) (2,556) (212,613) Facilities and equipment (1,323,040) (543) (98,127) 28,048 628 (14,687) (18,968) (1,426,689) Land and buildings (497,030) (491) (45,215) 14,325 39 (30,491) (10,367) (569,230) TOTAL (2,009,503) (1,290) (160,125) 46,002 594 (52,319) (31,891) (2,208,532) NET VALUE 1,746,515 6,644 79,489 (4,339) 423 15,401 51,086 1,895,219 Accounting policies
IFRS 16 defines the right of use conveyed by a lease as an asset which represents the lessee’s right to use the underlying asset for a given period. This right-of-use asset is recognised by the Group as of the effective date of the lease (when the asset becomes available for use).
The Group adopted the following exemptions under the standard:
- leases with a term of less than 12 months did not give rise to the recognition of an asset or liability;
- leases related to low-value assets were excluded.
The discount rates used to value rights of use were determined based on the incremental borrowing rate for the business segment in which the Group operates, plus a spread to reflect the specific economic environments of each country. These rates are defined according to the asset’s useful life.
The right-of-use asset is measured at cost, which includes:
- the initial amount of the lease liability;
- the advance payments made to the lessor, net of any benefits received from the lessor;
- the significant initial direct costs incurred by the lessee for the conclusion of the lease, i.e., the costs that would not have been incurred if the lease had not been entered into;
- the estimated cost of any dismantling or restoration of the leased asset in accordance with the terms of the lease, where appropriate.
The depreciation is booked on a straight-line basis over the term of the lease and is recognised as an expense in the income statement. The right-of-use asset is impaired if there is any indication of loss in value.
The lease term is the non-cancellable period during which the lessee has the right to use the underlying asset, after taking into account any renewal or termination options that the lessee is reasonably certain to exercise.
Fixed assets financed by finance leases are presented as assets under “Right-of-use assets”. The corresponding liability is recognised as a “Lease liability”.
Gross value
(in thousands
of euros)31/12/2023 Change
in scopeAcquisitions Disposals Reclassifications Hyperinflation Translation
differences31/12/2024 Other property, plant and equipment 1,525 15 134 (240) 15 1,449 Transport equipment 64,064 105 39,873 (13,667) 3,753 94,128 Machinery, equipment and tools 32,551 1,095 (337) 5,111 1,088 39,508 Land and buildings 266,418 2,113 23,874 (11,639) 1,083 5,660 13,532 301,041 TOTAL 364,558 2,233 64,976 (25,883) 1,083 10,771 18,388 436,126 Depreciation
(in thousands
of euros)31/12/2023 Change
in scopeIncreases Disposals Reclassifications Hyperinflation Translation
differences31/12/2024 Other property, plant and equipment (696) (321) 130 (7) (894) Transport equipment (31,717) (22,179) 2,386 (1,805) (53,315) Machinery, equipment and tools (19,430) (2,306) 299 (4,346) (803) (26,586) Land and buildings (81,951) (21,247) 5,446 (101) (4,072) (4,505) (106,430) TOTAL (133,794) (46,053) 8,261 (101) (8,418) (7,120) (187,225) NET VALUE 230,764 2,233 18,923 (17,622) 982 2,353 11,268 248,901 Accounting policies
Business combinations prior to 1 January 2010
Business combinations carried out prior to 1 January 2010 have been recognised according to IFRS 3 unrevised, applicable from that date. These combinations have not been restated, as revised IFRS 3 must be applied prospectively.
On first consolidation of a wholly controlled company, the assets, liabilities and contingent liabilities have been valued at their fair value in accordance with IFRS requirements. Valuation discrepancies generated at that time have been recorded in the relevant asset and liability accounts, including the non-controlling interests’ share, rather than solely for the proportion of securities acquired. The difference between the acquisition cost and the acquirer’s share of the fair value of the identifiable net assets in the acquired company is recognised in goodwill if positive and charged to income under “Other operating income and expenses” if negative (badwill).
Business combinations subsequent to 1 January 2010
IFRS 3 revised and IAS 27 amended modified the accounting policies applicable to business combinations carried out after 1 January 2010.
The main changes with an impact on the Group’s consolidated financial statements are:
- recognition of direct acquisition expenses;
- revaluation at fair value through profit and loss of interests held prior to the controlling interest, in the case of an acquisition via successive securities purchases;
- the possibility of valuing non-controlling interests either at fair value or as a proportional share of identifiable net assets, on a case-by-case basis;
- recognition at fair value of earn-out payments on the takeover date, with any potential adjustments being recognised in profit and loss if they take place beyond the assignment deadline;
- adjustments of the price recorded on acquisitions made by the Group are presented in cash flows from investing activities on the same basis as the initial price.
In accordance with the acquisition method, on the date of takeover, the Group recognises the identifiable assets acquired and liabilities assumed at fair value. It then has a maximum of 12 months with effect from the acquisition date to finalise recognition of the business combination in question. Beyond this deadline, adjustments of fair value of assets acquired and liabilities assumed are recognised directly in the income statement.
Goodwill is determined as the difference between (i) the transferred counterpart (mainly the acquisition price and any earn-out payment excluding acquisition expenses) and the total non-controlling interests, and (ii) the fair value of assets acquired and liabilities assumed. When positive, this difference is recognised as an asset in the consolidated balance sheet or, when negative (badwill), under “Other operating income and expenses”.
After the adoption of the revised IFRS 3, an option exists for the measurement of non-controlling interests as of the acquisition date: either at the fraction they represent of the net assets acquired (the partial goodwill method) or at fair value (the full goodwill method). The option is available on a case-by-case basis for each business combination.
For the purpose of allocating goodwill generated during the various business combinations, the groups of cash-generating units (CGUs) used by Rubis are:
- the Energy Distribution activity (Europe);
- the Energy Distribution activity (Africa);
- the Energy Distribution activity (Caribbean);
- the Photovoltaic Electricity Production activity.
This allocation is based on the organisation of the Group’s General Management and on internal reporting which, in addition to monitoring business activity, tracks return on capital employed, i.e., the lowest level at which goodwill is tracked for internal management purposes.
Goodwill impairment
Goodwill is subject to an impairment test at least once per year, or more frequently if there are indications of a loss in value, in accordance with the requirements of IAS 36 “Impairment of assets”. Annual tests are performed during the fourth quarter.
Impairment testing consists of comparing the recoverable value and the net carrying amount of the CGU or group of CGUs, including goodwill. A CGU is a uniform set of assets (or group of assets) whose continued use generates cash inflows that are largely independent of cash inflows generated by other groups of assets.
The recoverable value is the greater of the fair value less costs of disposal and value in use.
Value in use is determined on the basis of discounted future cash flows.
The fair value minus disposal costs corresponds to the amount that could be obtained from the disposal of the asset (or group of assets) under normal market conditions, minus the costs directly incurred to dispose of it.
When the recoverable value is lower than the net carrying amount of the asset (or group of assets), an impairment, corresponding to the difference, is recorded in the income statement and is charged primarily against goodwill.
These impairments of goodwill are irreversible.
(in thousands of euros) 31/12/2023 Change
in scopeHyperinflation Translation
differences31/12/2024 Energy Distribution activity (Europe) 283,022 (922) 282,100 Energy Distribution activity (Africa) 521,894 (2,780) 66,430 585,544 Energy Distribution activity (Caribbean) 312,284 3,527 19,533 17,152 352,496 Photovoltaic Electricity Production activity 542,344 952 543,296 GOODWILL 1,659,544 1,699 19,533 82,660 1,763,436 In accordance with IFRS 3, any material difference resulting from the final measurement of the assets acquired and liabilities assumed of the companies acquired was recognised as a retrospective adjustment to goodwill if it was recognised within 12 months following the acquisition date and related to events existing at the acquisition date.
- value in use calculations are based on cash flow forecasts using the financial budgets, for the 2024 financial year, and medium-term forecasts approved by Management at the reporting date. The forecast period used by management is generally five years;
- the main assumptions made concern volumes processed and unit margins. Cash flows are extrapolated by applying a growth rate determined according to the growth forecasts specific to each CGU or group of CGUs. These rates are included in a range of -1% to 4% in the impairment tests as of 31 December 2024.
- the value in use is based on cash flow projections over a period of 35 years, based on the business plan prepared by management, including the SPVs in operation, the portfolio of existing and future projects, international development as well as related energy storage and roof-based energy activities;
- the main assumptions are the electricity resale price, discount rates and the ability to develop the existing portfolio and generate new projects.
The discount rate used, based on the concept of weighted average cost of capital (WACC), reflects current market assessments of the time value of money, and the specific risks inherent in each CGU or group of CGUs.
CGU Group 2024 rate 2023 rate Energy Distribution activity (Europe) 5.7% 5.5% Energy Distribution activity (Africa) 10.1% 10.5% Energy Distribution activity (Caribbean) 9.9% 10.1% Photovoltaic Electricity Production activity (France) 8.1% 8.5% Photovoltaic Electricity Production activity (international development) 11.7% For the Energy Distribution activity, the discount rates presented were determined by using the 2024 EBITDA of each country as the basis for the weighting within a group of CGUs. For the Photovoltaic Electricity Production activity, WACCs are determined by region according to the status of the projects.
For the Energy Distribution activity, a 1% increase in the discount rate or a 1% reduction in the growth rate would not result in the impairment of goodwill as of 31 December 2024.
The Group is encountering operational difficulties in Haiti given the political, economic and security environment in the country, which affects all business sectors. The recoverable value as of 31 December 2024 was determined based on value in use. Value in use is based on expected cash flows discounted at a rate of 16.5%. A 1% increase in the discount rate would have an impact of around €14 million on the recoverable value of the CGU.
For the Photovoltaic Electricity Production activity, analyses of sensitivity to Aurora selling price curves and to the discount rates (+0.5%) rule out the risk of impairment of the Photosol goodwill as of 31 December 2024.
Accounting policies
Intangible assets are accounted for at their acquisition cost.
Intangible assets with a finite useful life are amortised according to the straight-line method for the periods corresponding to their expected useful lives and are subject to an impairment test whenever events or changes in circumstances indicate that their carrying amounts may not be recoverable.
In accordance with IFRS 15, the costs of obtaining contracts related to LPG distribution in France are capitalised as “Other intangible assets” and depreciated over the average useful life of the corresponding contracts (10 years).
An intangible asset resulting from development (or the development phase of an internal project) may be recognised if, and only if, the criteria defined by IAS 38.57 are met. For the Renewable Electricity Production activity, development costs, whether direct and indirect, external or internal, are capitalised when the success of the corresponding projects is probable and the other criteria of IAS 38 are met. The Group considers that these criteria are met when a project falls within the development portfolio, i.e., when the contractual elements and technical studies indicate that the feasibility of a project is probable. When the conditions for the recognition of an internally generated fixed asset are not met, project development expenses are recognised as expenses in the financial year in which they are incurred. The capitalisation of costs ends at the start-up of the plant’s operations.
In accordance with IAS 36 “Impairment of assets”, the Group examines whether there is an indication of impairment of intangible assets with a finite useful life and intangible assets in progress at the end of each reporting period. If such indications exist, the Group performs an impairment test to assess whether the carrying amount of the asset is higher than its recoverable value, defined as the higher of the fair value less transaction costs and value in use.
Gross value
(in thousands of euros)31/12/2023 Change
in scopeAcquisitions Disposals Reclassifications Translation
differences31/12/2024 Other concessions, patents, similar rights and development costs 38,587 678 16,223 (437) 1,065 1,276 57,392 Leases 2,197 62 2,259 Other intangible assets 88,951 10,079 2,734 (390) (1,062) 62 100,374 TOTAL 129,735 10,757 18,957 (827) 3 1,400 160,025 Amortisation
(in thousands of euros)31/12/2023 Change
in scopeIncreases Disposals Reclassifications Translation
differences31/12/2024 Other concessions, patents and similar rights (13,380) (349) (1,399) 107 6 (865) (15,880) Other intangible assets (25,690) (5,247) 390 20 (30,527) TOTAL (39,070) (349) (6,646) 497 6 (845) (46,407) NET VALUE 90,665 10,408 12,311 (330) 9 555 113,618 - the intangible asset of €40 million recognised in 2022, as part of the acquisition of Photosol, in respect of long-term power purchase agreements concluded at a contractual fixed price with electricity distributors;
- intangible assets for €19 million corresponding to the acquisition costs of developed and ready-to-build projects (Renewable Electricity Production activity).
Changes in scope mainly correspond to the acquisition of developed and ready-to-build projects in France and Italy for €9.8 million (see note 3.2).
Information about non-controlling interests, interests in joint operations and in joint ventures is given in notes 7 to 9.
Accounting policies
Financial assets are recognised and measured in accordance with IFRS 9 “Financial instruments”.
Classification and measurement
Financial assets are recognised in the Group balance sheet when the Group is a party to the instrument’s contractual provisions.
The classification proposed by IFRS 9 determines how assets are accounted for and the method used to measure them. Financial assets are classified based on two cumulative criteria: the management model applied to the asset and the characteristics of its contractual cash flows.
Based on the combined analysis of the two criteria, IFRS 9 distinguishes between three categories of financial assets, with measurement and accounting treatments specific to each category:
- the financial assets are measured at amortised cost; or
- the financial assets are measured at fair value through other comprehensive income; or
- the financial assets are measured at fair value through profit or loss.
Financial assets at amortised cost mainly include bonds and negotiable debt securities, loans and receivables.
Financial assets at fair value through other comprehensive income mainly include equity securities, previously classified as securities held for sale.
Financial assets measured at fair value through profit or loss include cash, SICAV and other funds.
The Group used the fair value hierarchy in IFRS 7 to determine the classification level of the financial assets:
- level 1: quoted prices in active markets for identical assets or liabilities;
- level 2: use of data other than the quoted prices listed in level 1, which are observable for the assets or liabilities in question, either directly or indirectly;
- level 3: use of data relating to the asset or liability which are not based on observable market data.
Impairment of financial assets
IFRS 9 introduces an impairment model based on expected losses.
Measurement and recognition of derivative instruments
The Group uses derivative financial instruments to manage its exposure to fluctuations in interest rates, foreign exchange rates and raw material prices. The Group’s hedging policy includes the use of swaps, caps and floors. The derivative instruments used by the Group are valued at their fair value. Unless otherwise specified below, changes in the fair value of derivative instruments are always recorded in the income statement.
Derivative instruments may be designated as hedging instruments in a fair value or future cash flow hedging relationship:
- a fair value hedge protects the Group against the risk of changes in the value of any asset or liability, resulting from foreign exchange rate fluctuations;
- a future cash flow hedge protects the Group against changes in the value of future cash flows relating to existing or future assets or liabilities.
The Group only applies cash flow hedges.
Hedge accounting is applicable if:
- the hedging relationship is clearly defined and documented at the date it is set up;
- the hedging relationship’s effectiveness is demonstrated from the outset and throughout its duration.
As a consequence of the use of hedge accounting of cash flows, the effective portion of the change in fair value of the hedging instrument is recorded directly in other comprehensive income. The change in value of the ineffective portion is recorded in the income statement under “Other finance income and expenses”. The amounts recorded in other comprehensive income are recycled in the income statement during the periods when the hedged cash flows impact profit and loss.
Breakdown of financial assets by class
(IFRS 7) and by category (IFRS 9)
(in thousands of euros)Value on balance sheet Fair value Note 31/12/2024 31/12/2023 31/12/2024 31/12/2023 At amortised cost 1,151,152 885,822 1,151,152 885,822 Other receivables from interests (long term) 4.5.1 12,739 11,241 12,739 11,241 Loans, deposits and guarantees (long term) 4.5.1 61,364 65,552 61,364 65,552 Loans, deposits and guarantees (short term) 4.5.2 16,825 16,150 16,825 16,150 Trade and other receivables 4.5.4 871,761 781,410 871,761 781,410 Other non-current assets 4.5.3 188,463 11,469 188,463 11,469 Fair value through other comprehensive income 58,413 95,730 58,413 95,730 Equity interests 4.5.1 15,812 41,883 15,812 41,883 Non-current derivative instruments 4.5.1 37,607 50,117 37,607 50,117 Current derivative instruments 4.5.2 4,994 3,730 4,994 3,730 Fair value through profit or loss 676,373 589,685 676,373 589,685 Cash and cash equivalents 4.5.5 676,373 589,685 676,373 589,685 TOTAL FINANCIAL ASSETS 1,885,938 1,571,237 1,885,938 1,571,237 Unlisted equity interests and other available-for-sale financial assets are considered to be level 3 (non-observable data).
The fair value of derivative instruments is determined using valuation models based on observable data (level 2).
Cash and cash equivalents are detailed in note 4.5.5. They are classified as level 1, with the exception of term deposits of €116 million, which are considered as level 2.
Other non-current financial assets include in particular equity interests, other receivables from investments (more than one year), long-term securities, long-term loans, long-term deposits and guarantees, and long-term marketable securities that are not considered cash and cash equivalents.
Gross value
(in thousands of euros)31/12/2024 31/12/2023 Equity interests 86,134 91,749 Other receivables from investments 12,739 11,241 Loans, deposits and guarantees 61,364 66,325 Fair value of financial instruments 37,607 50,117 TOTAL OTHER NON-CURRENT FINANCIAL ASSETS 197,844 219,432 Impairment (70,322) (50,639) NET VALUE 127,522 168,793 - the 17.2% equity interest in HDF Energy subscribed in 2021 totalling €78.6 million;
- non-controlling interests held by the SARA refinery in diversification projects;
- shares of the EIG held by Rubis Antilles Guyane.
Loans, deposits and guarantees mainly include treasury bonds held by distribution entities established in Kenya on the Kenyan Government for €34.7 million.
Impairments include €67.9 million for the impact of the fair value measurement of the equity interest in HDF Energy due to the decline in its share price compared to the initial subscription price. The contra-entry is recognised in other comprehensive income.
Other current assets mainly include prepaid expenses as well as the portion due in less than one year of receivables from investments, loans and deposits and guarantees paid, advances and deposits paid to acquire new businesses, marketable securities that cannot be considered as cash or cash equivalents, and hedging instruments at fair value.
(in thousands of euros) 31/12/2024 31/12/2023 Loans, deposits and guarantees 17,122 16,150 Fair value of financial instruments 4,994 3,730 Gross current financial assets 22,116 19,880 Impairment (297) Net current financial assets 21,819 19,880 Prepaid expenses 26,276 22,334 Current assets 26,276 22,334 TOTAL OTHER CURRENT ASSETS 48,095 42,214 The other receivables mainly correspond to the portion of the receivable relating to the sale of the Rubis Terminal JV due in more than one year (see note 3.2.1).
Accounting policies
Trade receivables, generally due within a period of one year, are recognised and accounted for at the initial invoice amount less an allowance for impairment recorded as the amount deemed to be unrecoverable. Doubtful receivables are estimated when there is no longer any probability of recovering the entire receivable. Impaired receivables are recorded as losses when they are identified as such. The Group uses the simplified approach allowed under IFRS 9 to calculate provisions for expected losses on trade receivables. Due to the Group’s low rate of past losses, the application of the impairment model for financial assets based on expected losses did not have a material impact for the Group.
In certain subsidiaries, Rubis has set up receivables disposal programmes enabling it to sell trade receivables and receive cash payments.
Trade receivables are deconsolidated once the Group has transferred its rights to receive payments for the asset as well as all the risks and rewards attached to the receivables.
When the risks and rewards of the asset have not been fully transferred, the receivables sold remain on the asset side of the balance sheet while the financing received is treated as financial debt in exchange for the receivables concerned.
Trade and other receivables include trade receivables and related accounts, employee receivables, Government receivables and other operating receivables.
Other operating receivables correspond in particular to the portion of the receivable due in less than one year relating to the disposal of the Rubis Terminal JV (see note 3.2.1).
Rubis has set up receivables disposal and factoring programmes, particularly in Martinique and the Cayman Islands, under which the subsidiary sells trade receivables to the factor or financial institution in exchange for cash. Some programmes are deconsolidating.
As of 31 December 2024, the carrying amount of the receivables sold was €32 million, almost all of the risks and rewards of these receivables having been transferred.
(in thousands of euros) NET CARRYING AMOUNT AS OF 31/12/2023 871,761 Net carrying amount as of 31/12/2023 781,410 Change in trade and other receivables on the balance sheet (90,351) Impact of change in the scope of consolidation 5,254 Impact of translation differences and restatements related to hyperinflation 41,140 Impact of reclassifications (1,145) Impact of change in receivables on asset disposals 87,085 Impact of change in other current assets and other receivables due in more than one year (3,195) Change in trade and other receivables on the statement of cash flows 38,788 Accounting policies
Cash and cash equivalents include current bank accounts and UCITS units which can be mobilised or sold in the very short term (less than three months) and which present no significant risk of change in value, according to the criteria stipulated in IAS 7. These assets are recognised at fair value through profit or loss.
The Group’s exposure to equity risk mainly relates to HDF Energy securities acquired in 2021 (see note 4.5.1).
The Group’s maximum credit risk exposure from trade receivables at the reporting date is as follows for each region:
Amount of assets due (in thousands of euros) Carrying
amountImpairment Net carrying
amountAssets not
yet dueLess than
6 months6 months to
1 yearMore than
1 yearTrade and other receivables 912,815 41,054 871,761 655,015 130,642 66,468 19,636 Tax receivables 30,844 30,844 29,014 1,112 5 713 Other current assets 48,391 296 48,095 47,627 120 347 1 TOTAL 992,050 41,350 950,700 731,656 131,874 66,820 20,350 Accounting policies
Deferred taxes are recognised for all temporary differences between the carrying amount and the tax basis, using the liability method.
Deferred tax assets are recognised for all deductible temporary differences, carryforwards of unused tax losses and unused tax credits, subject to the probability of taxable profit/earnings becoming available in the foreseeable future, on which these temporary deductible differences and carryforwards of unused tax losses, and unused tax credits can be used.
Deferred tax assets and liabilities are measured at the expected tax rate for the period when the asset is realised or the liability is settled, based on tax rates and laws enacted by the reporting date. This measurement is updated at each balance sheet date.
Deferred tax assets and liabilities are not discounted.
Deferred taxes are recorded as the difference between the carrying amount and the tax basis of assets and liabilities. Deferred tax assets and liabilities break down as follows:
(in thousands of euros) 31/12/2024 31/12/2023 Depreciation of fixed assets (93,098) (88,777) Right-of-use assets and lease liabilities (IFRS 16) 6,911 5,998 Loss carryforwards 31,985 25,887 Temporary differences 7,953 3,601 Provisions for risks 1,395 1,658 Provisions for environmental costs 5,378 4,745 Financial instruments (7,677) (9,868) Hyperinflation (11,295) (6,164) Pension commitments 9,088 8,917 Other 870 (886) NET DEFERRED TAXES (48,490) (54,889) Deferred tax assets 24,687 28,770 Deferred tax liabilities (73,177) (83,659) NET DEFERRED TAXES (48,490) (54,889) Deferred taxes representing tax loss carryforwards mainly concern the carryforward of tax losses of French tax consolidations (as defined below) and Photosol entities. The business forecasts updated at year-end justify the probability of deferred tax assets being applied in the medium term.
Deferred taxes relating to financial instruments mainly comprise deferred taxes relating to the fair value of hedging instruments.
- the cancellation of excess tax depreciation;
- the standardisation of depreciation periods for machinery;
- the difference between the consolidated value and the tax value of certain assets.
Deferred tax assets and liabilities are offset by entity or by tax consolidation group. Only the deferred tax asset or liability balance by entity or by tax consolidation group appears on the balance sheet. There are two tax consolidation scopes in France within the Group:
- that of the parent company, Rubis SCA, which comprises the following entities: Rubis Énergie, Vitogaz France, Coparef, Rubis Patrimoine, Vito Corse, Frangaz, Sicogaz, Rubis Antilles Guyane, Rubis Saint-Barthélemy, SIGL, Rubis Caraïbes Françaises, Rubis Guyane Française, Société Antillaise des Pétroles Rubis, Rubis Restauration et Services, Société Réunionnaise de Produits Pétroliers (SRPP), Rubis Renouvelables and Rubis HyDev;
- that formed by Rubis Photosol SAS and 57 of its subsidiaries.
Accounting policies
Inventories are valued at cost or net realisable value, whichever is lower.
The cost price is determined using the weighted average price method.
Borrowing costs are not included in inventory cost.
The net realisable value is the estimated sale price in the normal course of business minus estimated costs necessary to complete the sale.
Impairment is recognised when the probable realisable value is lower than the net carrying amount.
Impairment
(in thousands of euros)31/12/2023 Additions Reversals 31/12/2024 Inventories of raw materials and supplies 17,609 16,530 (14,874) 19,265 Inventories of finished and semi-finished products 3,120 4,468 (3,120) 4,468 Inventories of merchandise and other goods 1,907 281 (1,726) 462 TOTAL 22,636 21,279 (19,720) 24,195 (in thousands of euros) NET CARRYING AMOUNT AS OF 31/12/2024 715,790 Net carrying amount as of 31/12/2023 651,853 Change in inventories and work in progress on the balance sheet (63,937) Impact of change in the scope of consolidation 1,085 Impact of reclassifications 240 Impact of translation differences and restatements related to hyperinflation 21,147 Change in inventories and work in progress in the statement of cash flows (41,465) As of 31 December 2024, the share capital consisted of 103,204,251 fully paid-up shares, with a par value of €1.25 each, i.e., a total amount of €129,005 thousand.
In accordance with the authorisation granted by the Ordinary Shareholders’ Meeting of 11 June 2024 (22nd resolution), the Management Board decided in 2024 to cancel all 1,000,000 shares that were acquired under the share buyback programme launched on 7 October 2024. The related capital reduction was carried out with effect from 12 November 2024.
Number of shares Share capital
(in thousands of euros)Share premium
(in thousands of euros)As of 01/01/2024 103,195,172 128,994 1,553,914 Exercise of stock options 1,995 2 57 Company savings plan 559,881 700 8,096 Bonus performance shares acquired 447,203 559 (559) Capital decrease by cancelling shares bought back (1,000,000) (1,250) (23,777) Capital increase expenses (23) AS OF 31/12/2024 103,204,251 129,005 1,537,708 In November 2021, the Group signed an equity line agreement with Crédit Agricole CIB for a period of 37 months and up to the authorised limit of 4,400,000 shares with a par value of €1.25. As of 31 December 2024, this agreement expired without any usage by the Group.
Accounting policies
IFRS 2 provides for payroll expenses to be recognised for services remunerated by benefits granted to employees in the form of share-based payments. These services are carried at fair value of the instruments awarded.
All the plans granted by the Group are in the form of instruments settled in shares; the payroll expense is offset in equity.
The plans contain a condition that the beneficiaries remain in the Group’s workforce at the end of the vesting period, as well as non-market and/or market performance conditions depending on the plans.
Market performance conditions have an impact on the initial estimate of the unitary fair value of the instrument awarded at the allocation date, without subsequent revision during the vesting period.
Non-market performance conditions have an impact on the initial estimate at the allocation date of the number of instruments to be issued, which is subject to subsequent revision, where necessary, throughout the vesting period.
Stock option plans
Stock option plans are granted to some members of the Rubis Group personnel.
These options are measured at fair value on the allocation date, using a binomial model (Cox Ross Rubinstein). This model takes into account the characteristics of the plan (exercise price and exercise period, performance conditions) and market data on the allocation date (risk-free interest rate, share price, volatility, and expected dividends).
This fair value on the allocation date is recognised as payroll expenses, on a straight-line basis over the vesting period, offset against equity.
Award of bonus shares
Bonus share award plans are granted to some members of the Group’s personnel.
These bonus share awards are measured at fair value on the allocation date, using a binomial model. This valuation is carried out on the basis of the share price on the allocation date, taking into account the absence of dividends over the vesting period and the performance conditions contained in the plans.
This fair value on the allocation date is recognised as payroll expenses, on a straight-line basis over the vesting period, offset against equity.
Award of preferred shares
Preferred share award plans are also granted to some members of the Rubis Group personnel.
These awards of preferred shares are measured at fair value on the allocation date, using a binomial model. This valuation is carried out on the basis of the share price on the allocation date, taking into account, over the vesting period, the absence of dividends and the performance conditions contained in the share plans.
This fair value on the allocation date is recognised as payroll expenses, on a straight-line basis over the vesting period, offset against equity.
Company savings plans
The Group has set up several company savings plans for its employees. These plans provide employees with the possibility of subscribing to a reserved capital increase at a discounted share price. They meet the conditions for the application of share purchase plans.
The fair value of each share is then estimated as corresponding to the difference between the share price on the plan allocation date and the subscription price.
Without a vesting period, the payroll expense is recognised directly against equity.
The expense corresponding to the Company contribution granted to employees is also recognised in the income statement under payroll expenses.
The terms of the bonus share plans outstanding as of 31 December 2024 are set out in the tables below:
Bonus performance shares
Date of Management BoardOutstanding as
of 31/12/2023Rights
issuedRights
exercisedRights
cancelledOutstanding as
of 31/12/202406/11/2020 769,645 (379,318) (390,327) 01/04/2021 43,516 (21,756) (21,760) 13/12/2021 115,323 (46,129) 69,194 20/07/2022 514,770 514,770 TOTAL 1,443,254 (447,203) (412,087) 583,964 The definitive allocation of the shares to the beneficiaries may only take place at the end of a vesting period, which is generally three years, running from their allocation by the Management Board. Vesting is also subject to the achievement of the performance conditions stipulated in the plan regulations.
As part of the Photosol transaction, the Managers of the group acquired by Rubis SCA benefited from a share-based compensation plan from the Rubis Photosol holding company, head of the Photosol Group, providing for the grant of 8.4 million bonus shares and 1 million preferred shares. These items, measured at fair value, are accompanied by repurchase clauses by the Group. As such, in 2024, the Group repurchased 901,500 ordinary shares. The impacts on the Group’s financial statements are not material.
The risk-free interest rate used to calculate the value of these plans is the interest rate on Euro-zone Government bonds with the same maturity as the options (source: Iboxx).
With respect to the early exercise of the options, the model assumes rational expectations on the part of option holders, who may exercise their options at any time throughout the exercise period. The implied volatility used in the calculation is estimated on the basis of past volatility levels.
The risk-free interest rate used to calculate the value of the company savings plans is the interest rate on Euro-zone Government bonds with the same maturity as the instruments valued (source: Iboxx).
Accounting policies
Financial liabilities are recognised and measured in accordance with IFRS 9 “Financial instruments”.
Financial liabilities are recognised in the Group balance sheet when the Group is a party to the instrument’s contractual provisions.
IFRS 9 defines two categories of financial liabilities, each subject to a specific accounting treatment:
- financial liabilities valued at amortised cost; they mainly include trade payables and borrowings applying the effective interest rate method, if applicable;
- financial liabilities valued at fair value through profit and loss, which only represent a very limited number of scenarios for the Group and do not have a significant impact on the financial statements.
Measurement and recognition of derivative instruments
The accounting policies used to measure and recognise derivative instruments are set out in note 4.5.
Breakdown of financial liabilities by class
(IFRS 7) and by category (IFRS 9)
(in thousands of euros)Note Value on balance sheet Fair value 31/12/2024 31/12/2023 31/12/2024 31/12/2023 At amortised cost 3,143,534 2,987,792 3,149,757 2,982,107 Borrowings and financial debt 4.10.1 1,658,121 1,630,622 1,664,344 1,624,936 Lease liabilities 4.10.1 257,466 238,758 257,466 238,758 Deposit 4.10.1 152,681 151,785 152,681 151,785 Other non-current liabilities 4.10.3 155,968 139,544 155,968 139,544 Trade and other payables 4.10.4 863,686 792,512 863,686 792,512 Current tax liabilities 39,601 25,245 39,601 25,245 Other current liabilities 4.10.3 16,011 9,326 16,011 9,326 Fair value through other comprehensive income 8,009 14,621 8,009 14,621 Non-current derivative instruments 4.10.3 7,504 8,715 7,504 8,715 Current derivative instruments 4.10.3 505 5,906 505 5,906 Fair value through profit or loss 310,558 318,971 310,558 318,971 Short-term bank borrowings 4.10.1 310,558 318,971 310,558 318,971 TOTAL FINANCIAL LIABILITIES 3,462,101 3,321,384 3,468,324 3,315,699 The fair value of derivative instruments is determined using valuation models based on observable data (level 2).
Financial debt is presented in the following table, which differentiates between non-current and current liabilities:
Current
(in thousands of euros)31/12/2024 31/12/2023 Bank loans 432,729 421,522 Interest accrued not yet due on loans and bank overdrafts 7,424 7,882 Bank overdrafts 310,295 318,493 Other loans and similar liabilities 12,057 35,622 TOTAL BORROWINGS AND BANK OVERDRAFTS (PORTION DUE IN LESS THAN ONE YEAR) 762,505 783,519 Non-current
(in thousands of euros)31/12/2024 31/12/2023 Bank loans 1,154,536 1,125,525 Customer deposits on tanks 15,025 15,670 Customer deposits on cylinders 137,656 136,115 Other loans and similar liabilities 51,638 40,549 TOTAL BORROWINGS AND FINANCIAL DEBT 1,358,855 1,317,859 TOTAL 2,121,360 2,101,378 The change in borrowings and other current and non-current financial liabilities between 31 December 2023 and 31 December 2024 breaks down as follows:
(in thousands of euros) 31/12/2023 Change
in scopeIssue Repayment Translation
differences31/12/2024 Current and non-current borrowings and financial debt 1,949,593 884 1,307,960 (1,334,274) 44,516 1,968,679 Current and non-current lease liabilities 238,758 2,147 67,099 (61,167) 10,629 257,466 TOTAL 2,188,351 3,031 1,375,059 (1,395,441) 55,145 2,226,145 The issues carried out during the period are mainly used for the refinancing of credit facilities that have been used and new financing obtained on Photosol.
The main borrowings and credit agreements taken out by the Energy Distribution Division include a commitment within Rubis Énergie’s scope to comply, during the term of the loans, with the following financial ratios:
As of 31 December 2024, the Energy Distribution Division’s threshold ratios were met, thus ruling out any likelihood of an occurrence of events triggering early repayment.
In the Renewable Electricity Production activity, most of the loans and credit agreements taken out by Photosol companies are subject to financial ratios, corresponding:
- for a large portion, to a Debt Service Coverage Ratio (DSCR), defined as the ratio between the cash available for debt service and the cost of debt service. Depending on the entity, the minimum threshold to be respected is between 1.05 and 1.15;
- to a lesser extent, a Loan To Value (LtV) to reach a minimum threshold of 60%.
At 31 December 2024, certain clauses of the DSCR had not been met concerning several non-recourse project financings for a total of €135 million, including €127 million of non-current debt. This follows exceptional events (in connection with the refinancing of a credit agreement to include the corporate PPA recently signed on this portfolio or weather conditions), it being specified that the credit documentation gives borrowers the ability to remedy the default by a limited additional capital contribution (approximately €900 thousand) after the remittance of the financial ratios certificate.
All of these borrowings were presented in the balance sheet under current liabilities, in accordance with IAS 1.
The Group is in discussions with the lenders and considers that these defaults should not have a recurring long-term impact on financing. The Group believes that the ratios as defined will be met in the future.
The Group, through its subsidiary Rubis Énergie SAS, signed its very first US Private Placement (USPP) under French law with PGIM Private Capital (PPC).
This new USPP financing enables Rubis to diversify its sources of financing while extending the current average maturity of its debt from three to five years and paves the way for other potential USPP transactions.
As of 31 December 2024, Rubis Énergie SAS had issued three series of €70 million each of senior unsecured bonds with term maturities of eight, 10 and 12 years.
Some subsidiaries in the Energy Distribution activity have set up paying agent agreements with financial institutions, enabling certain Group suppliers to assign their receivables due from the Group.
This financing programme enabled the Group to benefit from extended payment terms for its liabilities to these suppliers. Liabilities for which payment terms have been extended are presented in the “Borrowings and bank overdrafts (portion due in less than one year)” on the line “Other loans and similar liabilities”. As of 31 December 2024, the amounts due in respect of these programmes amounted to €12 million. The cash flows related to these liabilities are classified as cash flows related to financing activities.
(in thousands of euros) Less than
1 year1 to 5 years More than
5 years31/12/2024 SCHEDULE OF LEASE LIABILITIES 37,116 88,901 131,449 257,466 As of 31 December 2024, the amount of rent paid (restated leases and exempted leases) totalled €119.5 million and income from sub-letting amounted to €6.9 million.
- term of less than 12 months, totalling €52.7 million,
- assets with a low unit value, totalling €1.2 million;
The fair value of derivative financial instruments carried by the Group includes a “counterparty risk” component for derivative instrument assets and an “own credit risk” component for derivative instrument liabilities. Credit risk is assessed using conventional mathematical models for market participants.
Characteristics of loans contracted
(in thousands of euros)Rate Total amount of lines Less than
1 yearBetween 1
and 5 yearsMore than
5 yearsExistence
or not of
hedgingEuro Fixed rate 344,466 59,588 72,251 212,627 Variable rate 1,200,541 367,838 637,643 195,060 YES Indian rupee Fixed rate Variable rate 394 121 273 US dollar Fixed rate 2,014 973 1,041 Variable rate 9,914 1,155 8,759 Barbados dollar Fixed rate 24,608 3,054 21,554 Variable rate Malagasy ariary Fixed rate 5,328 5,328 Variable rate TOTAL 1,587,265 432,729 741,521 413,015 As of 31 December 2024, the Group had interest rate hedging agreements (caps and floors) of €912 million on a total of €1,211 million in variable-rate debt, representing 75% of that amount.
(in thousands of euros) Overnight to
1 year(3)1 to 5 years Beyond Borrowings and financial debt excluding consignments(1) 762,505 776,716 429,458 Financial assets(2) 676,373 Net exposure before hedging 86,132 776,716 429,458 Hedging instruments (912,000) NET EXPOSURE AFTER HEDGING 86,132 (135,284) 429,458 - Bank loans, bank overdrafts, accrued interest not yet due and other loans and similar liabilities.
- Cash and cash equivalents.
- Including variable-rate assets and liabilities.
€844.7 million of the Group’s net debt has a variable interest rate, comprising confirmed variable-rate loans (€1,210.8 million) plus short-term bank borrowings (€310.3 million), less cash on hand (€676.4 million).
Given the hedges put in place, a 1% change in short-term rates would not have a significant impact on the cost of net financial debt for 2024.
Petroleum product purchases are made in US dollars; the Group’s only potential exposure is therefore to that currency.
As of 31 December 2024, the Energy Distribution activity showed a net credit balance of US$182 million consisting of debts (including intragroup), and receivables as well as bank overdrafts and cash and cash equivalents. The Group’s exposure is mainly concentrated on the Rubis Energy Kenya, Ringardas (Nigeria), RWIL Suriname and Dinasa (Haiti) subsidiaries. The changes compared to 31 December 2023 are explained by the measures implemented by the Group to reduce its exposure. In Kenya, the Group hedged the outstanding USD receivables with USD-denominated financing.
A €0.01 fall in the euro against the US dollar would not entail a material foreign exchange risk (less than €2 million before tax).
The following two factors must be considered when analysing the risk related to fluctuations in petroleum product prices:
- petroleum product price fluctuation risk is mitigated by the short product storage times;
- sales rates are revised on a regular basis, based on market conditions.
Other non-current liabilities
(in thousands of euros)31/12/2024 31/12/2023 Liabilities on the acquisition of fixed assets and other non-current assets 57 469 Fair value of financial instruments (long-term portion) 7,504 8,715 Other liabilities (long-term portion) 154,905 137,690 Deferred income (long-term portion) 1,006 1,385 TOTAL 163,472 148,259 As part of the Photosol transaction, the Group recognised, on the takeover date, a buyback option on non-controlling interests, recognised in “Other long-term liabilities” with a corresponding reduction in minority interests, as well as equity attributable to owners of the parent for the excess portion, presented in total equity. This purchase option stood at €145.6 million as of 31 December 2024 (€129.5 million as of 31 December 2023).
(in thousands of euros) 31/12/2024 31/12/2023 Trade payables 544,795 519,011 Liabilities on the acquisition of fixed assets and other non-current assets 32,492 21,323 Social security payables 61,667 54,783 Taxes payable 123,544 115,551 Expenses payable 222 145 Current accounts 21,780 11,490 Miscellaneous operating liabilities 79,186 70,209 TOTAL 863,686 792,512 (in thousands of euros) VALUE ON BALANCE SHEET AS OF 31/12/2024 863,686 Value on balance sheet as of 31/12/2023 792,512 Change in trade and other payables on the balance sheet 71,174 Impact of change in the scope of consolidation (16,816) Impact of translation differences and restatements related to hyperinflation (13,566) Impact of reclassifications 12,357 Impact of change in payables on acquisition of assets (in investment) (11,168) Impact of change in dividends payable and accrued interest on liabilities (in financing) 15 Impact of change in other current liabilities and other long-term debt (527) Change in trade and other payables on the statement of cash flows 41,469 As of 31 December 2024, the Group had used confirmed credit facilities totalling €572 million. The amount of credit facilities confirmed but not used as of 31 December 2024 was €389 million.
The maturity schedule of loans from credit institutions is presented in note 4.10.2 (interest rate risk).
At the same time, the Group has assets of €676 million in immediately available cash on its balance sheet.
The remaining contractual maturities of the Group’s financial liabilities break down as follows (including interest payments):
Financial liabilities
(in thousands of euros)Carrying
amountContractual
cash flowsLess than
1 month1 to
3 months3 months
to 1 year1 to
5 yearsMore than
5 yearsTotal Borrowings and financial debt 1,206,174 1,484,702 896,601 588,101 1,484,702 Deposit 152,681 152,681 69 130 783 126,196 25,503 152,681 Other non-current liabilities 163,472 163,472 163,472 163,472 Borrowings and bank overdrafts 762,505 865,424 276,545 128,100 458,683 2,096 865,424 Trade and other payables 863,686 863,686 533,699 169,899 111,646 40,010 8,432 863,686 Other current liabilities 16,516 16,516 8,692 2,038 1,768 4,018 16,516 TOTAL 3,165,034 3,546,481 819,005 300,167 572,880 1,232,393 622,036 3,546,481 The difference between contractual cash flows and the carrying amounts of financial liabilities mainly corresponds to future interest.
Accounting policies
Provisions are recognised when the Group has a current (legal or implicit) obligation to a third party resulting from a past event, when it is likely that an outflow of resources representing economic benefits will be necessary to settle the obligation, and when the amount of the obligation can be reliably estimated.
Dismantling and clean-up
Provisions are made for future site rehabilitation expenditures (dismantling and clean-up), arising from a current legal or implicit obligation, based on a reasonable estimate of their fair value during the financial year in which the obligation arises. The counterpart of this provision is included in the net carrying amount of the underlying asset and is depreciated according to the asset’s useful life. Subsequent adjustments to the provision following, in particular, a revision of the outflow of resources or the discount rate are symmetrically deducted from or added to the cost of the underlying asset. The impact of accretion (the passage of time) on the provision for site rehabilitation is measured by applying a risk-free interest rate to the provision. Accretion is recorded under “Other finance income and expenses”.
Litigation and claims
Provisions for litigation and claims are recognised when the Group has an obligation relating to legal action, tax audits, vexatious litigation or other claims resulting from past events that are still pending, when it is likely that an outflow of resources representing economic benefits will be necessary to settle the obligation, and when the amount of the obligation can be reliably estimated. The Group takes advice from its counsel and lawyers in order to assess the likelihood of the occurrence of risks and to estimate provisions for litigation and claims by including the probabilities of occurrence of the various scenarios envisaged.
Energy savings certificates
Some French entities are subject to an obligation to collect energy savings certificates. This obligation is covered by a provision spread evenly over the three-year collection period. At the same time, the Group records the purchases of certificates made throughout the three-year period in inventories, at their acquisition or collection cost.
At the end of each three-year period, the inventories are consumed and the provisions reversed. These items are recorded under “EBITDA”.
Restructuring
In the case of restructuring, an obligation is created when the Group has a detailed and formalised restructuring plan and the main restructuring measures have been announced to the people concerned, or when the restructuring has begun to be implemented.
If the impact of time value is significant, provisions are discounted to present value.
- the Group’s obligations in terms of energy-saving certificates. These provisions are recognised throughout the three-year period currently in progress (2022-2025);
- provisions relating to risks or disputes that could potentially lead to action being taken against the Rubis Group.
The Group may be required to make provisions when there is a risk of the prices charged by the project companies (SPV) being called into question. However, as of 31 December 2024, no provision had been made for this risk.
Dismantling and clean-up provisions comply with IAS 16. The costs of clean-up and dismantling costs are estimated by the Group, based in particular on the findings of outside consultants. In compliance with IAS 16, the present value of these expenses was incorporated into the cost of the corresponding facilities.
(in thousands of euros) 31/12/2023 Additions Reversals* Hyperinflation Translation
differences31/12/2024 Provisions for contingencies and expenses 90,714 66,932 (28,876) 848 129,618 Dismantling and clean-up provisions 47,106 3,738 (1,822) 3,735 2,167 54,924 TOTAL 137,820 70,670 (30,698) 3,735 3,015 184,542 - the Group’s new obligations in terms of collecting energy-saving certificates;
- the Group’s clean-up and remediation obligations.
In December 2021, the French Competition Authority launched an investigation into practices in the fuel supply, storage and distribution sector. At the end of 2023, the French Competition Authority’s Investigation Department sent several players in the French oil industry – including two Group entities – a notification of grievances relating to alleged practices in this sector. Receipt of this document in no way prejudges any future conviction. During the 2024 financial year, the Group made representations, and intended to fully and firmly contest the merits of the current proceedings. The meeting before the Board of the Authority took place at the end of 2024. As of 31 December 2024, no provision has been made, as management considers that the criteria for recognising a provision have not been met under IFRS.
Accounting policies
The Group’s employees are entitled to:
- defined-contribution pension plans applicable under general law in the relevant countries;
- supplementary pension benefits and retirement allowances (French, Swiss and Bermudan companies and entities located in Barbados and Guyana, and certain Malagasy entities);
- a closed supplementary pension plan (FSCI pension funds, Channel Islands);
- post-employment health plans (Bermudan and South African companies).
The Group’s only obligations under defined-contribution plans are premium payments; the expense corresponding to premium payments is recorded in the profit (loss) for the period.
Under defined-benefit plans, pension commitments and related commitments are valued according to the actuarial projected unit credit method based on final salary. The calculations include actuarial assumptions, mainly pertaining to mortality, personnel turnover rates, final salary forecasts and the discount rate. These assumptions take into account the economic conditions of each country or each Group entity. The rate is determined in relation to high-quality corporate bonds in the region in question.
These measurements are performed twice a year.
Actuarial gains and losses on post-employment defined-benefit plans resulting from changing actuarial assumptions or experience-related adjustments (differences between previous actuarial assumptions and actual recorded workforce events), are recognised in full under other comprehensive income for the period in which they are incurred. The same applies to any adjustment due to the cap on hedging assets in the case of over-financed plans. These items are never subsequently recycled through profit and loss.
In accordance with the IFRIC 14 interpretation, net assets resulting from over-financing of the FSCI’s defined-benefit pension plans are not recognised in the Group’s financial statements, as the Group does not have an unconditional right to receive this surplus.
The employees of Vitogaz France, Rubis Énergie, Frangaz, Vito Corse, Rubis Antilles Guyane, SARA, SRPP, Rubis Energy Bermuda and Vitogaz Switzerland are also entitled to seniority bonuses related to the awarding of long-service medals, which fall into the category of long-term benefits, as defined in IAS 19. The amount of the bonuses likely to be awarded has been valued via the method used to value post-employment defined-benefit plans, except for actuarial gains and losses recognised in the income statement for the period during which they are incurred.
Employees of SARA are entitled to progressive pre-retirement plans, early retirement, and retirement leave. The total amount of the commitments corresponding to pre-retirement allowances and early retirement has been assessed using the method described above.
(in thousands of euros) 2024 2023 Provisions as of 1 January 40,929 40,163 Interest expense for the period 2,101 2,078 Service cost for the period 3,720 2,588 Expected return on assets for the period (3,897) (1,034) Benefits paid for the period (2,412) (3,505) Actuarial losses/(gains) and limitation of assets 12,493 1,837 Translation differences (27) (1,198) PROVISIONS AS OF 31 DECEMBER 52,907 40,929 Post-employment benefits as of 31 December 2023 and 2024 were assessed by an independent actuary, using the following assumptions:
The discount rates used were determined by reference to the yields on high-quality corporate bonds (minimum rating of AA) with terms equivalent to those of the commitments on the date of assessment.
The calculation of the sensitivity of the provision for commitments to a change of one-quarter of a percentage point in the discount rate shows that the total obligation and the components of earnings would not be significantly affected, in view of the total sum recognised in the Group’s financial statements under employee benefits.
(in thousands of euros) 31/12/2024 31/12/2023 Actuarial liabilities for commitments not covered by assets 35,106 27,308 Actuarial liabilities for commitments covered by assets 29,482 25,114 Market value of hedging assets (29,482) (25,114) Deficit 35,106 27,308 Limitation of assets (over-financed plans) 14,850 11,173 PROVISIONS AS OF 31 DECEMBER 49,956 38,481 (in thousands of euros) 2024 2023 Actuarial liabilities as of 1 January 52,422 54,438 Service cost for the period 3,086 2,273 Interest expense for the period 2,037 2,011 Benefits paid for the period (3,019) (4,134) Actuarial losses/(gains) and limitation of assets 8,817 (1,156) Translation differences 1,245 (1,010) ACTUARIAL LIABILITIES AS OF 31 DECEMBER 64,588 52,422 (in thousands of euros) 2024 2023 Hedging assets as of 1 January 25,114 28,953 Translation differences 1,271 207 Expected return on fund assets 3,897 (3,228) Benefits paid (800) (818) Hedging assets as of 31 December 29,482 25,114 Limitation of assets (14,850) (11,173) ASSETS RECOGNISED AS OF 31 DECEMBER 14,632 13,941 Accounting policies
The Group uses EBITDA as a performance indicator. EBITDA corresponds to net revenue minus:
- consumed purchases;
- external expenses;
- payroll expenses;
- taxes.
The Group uses EBIT as its main performance indicator. EBIT corresponds to EBITDA after:
- other operating income;
- net depreciation and provisions;
- other operating income and expenses.
To better present the operating performance in the business lines, the equity associates’ net income is shown on a specific line in operating income.
Accounting policies
Revenue from Group activities is recognised when control of the asset is transferred to the buyer, i.e., when the asset is delivered to the customer in accordance with contractual provisions and the customer is in a position to decide how the asset will be used and to benefit from substantially all of the benefits of ownership:
- for the income earned from the Energy Distribution activity – Retail & Marketing, on delivery. For the bitumen business, revenue is mainly recognised when goods leave the bulk tank. In the case of administered margins, revenue is restated by recognising accrued income, if applicable, or deferred income, in order to take into account the substance of the operations;
- for the income earned from the Energy Distribution activity – Support & Services, on delivery and according to the term of the service provision contract. As regards the SARA refinery, revenue from the sale of petroleum products is recognised at the bulk tank outlet when the product leaves the refinery or the other depots;
- for income earned from the Renewable Electricity Production activity, when the MWh are delivered by the photovoltaic parks. The revenue recorded by each park is recognised according to the quantities produced and injected into the distribution network during the period. It corresponds to the sale of electricity produced and sold either in accordance with the various contracts whose sale prices are defined by decree or in the context of calls for tenders, or on the market.
Operations carried out on behalf of third parties are excluded from revenue and purchases, in line with industry practices.
Net revenue is detailed in the table below by business segment and region of the consolidated companies.
31/12/2024
(in thousands of euros)Energy
DistributionRenewable
Electricity
ProductionParent
companyTotal Region Europe 816,485 49,153 165 865,803 Caribbean 3,260,829 3,260,829 Africa 2,517,307 2,517,307 TOTAL 6,594,621 49,153 165 6,643,939 Business line Fuels, liquefied gas and bitumen 5,596,916 5,596,916 Refining 806,732 806,732 Trading, supply, transport and services 190,973 190,973 Photovoltaic electricity 49,153 49,153 Other 165 165 TOTAL 6,594,621 49,153 165 6,643,939 31/12/2023
(in thousands of euros)Energy
DistributionRenewable
Electricity
ProductionParent
companyTotal Region Europe 799,955 48,639 89 848,683 Caribbean 3,284,819 3,284,819 Africa 2,496,475 2,496,475 TOTAL 6,581,249 48,639 89 6,629,977 Business line Fuels, liquefied gas and bitumen 5,548,978 5,548,978 Refining 864,282 864,282 Trading, supply, transport and services 167,989 167,989 Photovoltaic electricity 48,639 48,639 Other 89 89 TOTAL 6,581,249 48,639 89 6,629,977 (in thousands of euros) 31/12/2024 31/12/2023 Purchases of raw materials, supplies and other materials 277,259 401,726 Change in inventories of raw materials, supplies and other materials 19,314 (45,378) Goods-in-process inventory (12,097) 23,901 Other purchases 41,659 37,428 Merchandise purchases 4,682,176 4,584,598 Change in merchandise inventories (69,536) (52,150) Additions to impairment (net of reversals) for raw materials and merchandise 4,893 (4,196) TOTAL 4,943,668 4,945,929 Average headcount of fully consolidated companies 31/12/2023 New hires* Departures 31/12/2024 TOTAL 4,290 745 (487) 4,548 * Also includes rental expenses (see note 4.1.2 “Right-of-use assets (IFRS 16)”; exemptions offered by the standard and retained by the Group). Accounting policies
The Group records separately operating income and expenses which are unusual, infrequent or, generally speaking, non-recurring, and which could impair the readability of the Group’s operational performance.
This income and expenses includes the impact of the following on profit and loss:
- acquisitions and disposals of companies (negative goodwill, strategic acquisition costs, capital gains or losses on disposal, etc.);
- capital gains or losses on disposal or scrapped property, plant and equipment or intangible assets;
- other unusual and non-recurrent income and expenses;
- significant additions to provisions and impairment of property, plant and equipment or intangible assets.
Costs related to strategic acquisitions correspond in particular to the costs incurred in connection with the acquisition of the Photosol Group.
- on 16 October 2024, Rubis completed the disposal of its 55% stake in the Rubis Terminal JV (now called Tepsa) to I Squared Capital (see note 3.2.1). The capital gain net of fees and commissions amounted to €89 million;
- in 2023, the Group had recognised income of €14 million following the favourable ruling in the arbitration proceedings initiated following the acquisition of a distribution business in East Africa.
Accounting policies
Transactions denominated in foreign currencies are converted by the subsidiary into its operating currency at the rate applicable on the date of the transaction. Monetary assets and liabilities denominated in foreign currencies are converted at the exchange rate in effect at the reporting date of each accounting period. The corresponding foreign exchange differences are recorded in the income statement under “Other finance income and expenses”.
Other net finance income and expenses include a charge of €25 million for the offsetting entry in the income statement of revaluations recorded in connection with hyperinflation in Haiti and Suriname. The impact of these revaluations on net income stood at €10 million.
Current income tax expense corresponds to the amount of income tax payable to the tax authorities for the period, in accordance with applicable regulations and tax rates in effect in France.
The Social Security Finance Act No. 99-1140 of 29 December 1999 established an additional tax of 3.3% of the base tax payable; the legal tax rate for French companies was thus increased by 0.83%. As a result, income from the French tax consolidation was taxed at a rate of 25.83% in 2024.
The deferred income tax liability is determined using the method described in note 4.6. The corporate income tax rate for all French companies is 25.83%.
IFRS require that deferred taxes be measured using the tax rate in effect at the time of their probable use.
5.10.2 RECONCILIATION BETWEEN THE THEORETICAL TAX CALCULATED WITH THE TAX RATE IN FORCE IN FRANCE AND THE ACTUAL INCOME TAX EXPENSE
31/12/2024
(in thousands of euros)Income Tax Rate Income at the normal rate 425,732 (109,967) 25.83% Geographic impact 52,362 -12.3% Distribution tax (share of cost and expenses, withholding tax) (7,845) +1.8% Tax credits 1,273 -0.3% Other permanent differences 1,031 -0.2% Tax adjustments and risks/Refunds received 148 0.0% Effect of changes in rate 119 0.0% Hyperinflation (5,411) +1.3% Additional tax known as Pillar 2 (22,988) +5.4% Other 9,843 -2.3% Profit (loss) before tax and share of net income from joint ventures 425,732 (81,435) 19.13% Share of net income from joint ventures 6,806 Profit (loss) before tax 432,538 (81,435) 18.83% The international tax reform agreed by the OECD at the end of 2021, known as Pillar 2, which aims to establish a minimum tax rate of 15%, has been adopted by France as part of the finance act for 2024 voted on before 31 December 2023. In view of its turnover, the Rubis Group falls within the scope of this reform from 1 January 2024. In this context, Rubis SCA is the Ultimate Parent Entity (UPE) and becomes liable, where applicable, for additional tax in relation to its low-tax subsidiaries. The text is accompanied by a number of simplification and exemption measures applicable for three years.
For 2024, the Group recognised an additional income tax expense of €23 million in respect of this Pillar 2 regulation. This figure includes the local tax reforms adopted in the context of this global minimum tax.
In its 2024 financial statements, the Group maintained the exception for non-recognition of deferred tax relating to Pillar 2 as provided for in the amendments to IAS 12 “Income taxes”.
Accounting policies
Basic earnings per share is calculated by dividing net income, Group share by the weighted average number of shares outstanding during the financial year.
The weighted average number of shares outstanding is calculated based on any changes in share capital during the period, multiplied by a weighting factor depending on the time, and adjusted, where applicable, to take into account the Group’s holdings of its own shares.
Diluted net earnings per share is calculated by dividing net income, Group share by the weighted average number of ordinary shares outstanding, increased by the maximum amount of impact from the conversion of all dilutive instruments. The number of shares, whose issue is conditional at the reporting date included in the calculation of diluted earnings per share, is based on the number of shares (i) that would have to be issued if the closing date of the period were the end of the contingency period, and (ii) which have a dilutive effect.
In both cases, the shares included in the calculation of the weighted average number of shares outstanding during the financial year are those that provide unlimited entitlement to earnings.
The table below presents the income and shares used to calculate basic earnings and diluted earnings per share.
Earnings per share
(in thousands of euros)31/12/2024 31/12/2023 Consolidated net income, Group share 342,293 353,694 Number of shares at the beginning of the period 103,195,172 102,953,566 Company savings plan 338,996 146,949 Exercise of stock options 1,137 Bonus performance shares 328,897 Capital decrease by cancelling shares bought back (200,110) Average number of treasury shares during the financial year (67,343) (77,764) Weighted average number of shares outstanding 103,596,749 103,022,751 Bonus shares (performance and preferred) 406,581 Stock options 42,640 Diluted weighted average number of shares 103,639,389 103,429,331 UNDILUTED EARNINGS PER SHARE (in euros) 3.30 3.43 DILUTED EARNINGS PER SHARE (in euros) 3.30 3.42 Rubis has always pursued an active dividend payment policy for its shareholders, as illustrated by the dividend payout ratio over the past five years, which has represented an average of 64% of undiluted net income, Group share.
Date of distribution Financial year
concernedNumber of shares
concernedNet dividend
paid
(in euros)Total net amounts
distributed
(in euros)CSM 07/06/2013 2012 33,326,488 1.84 61,320,738 CSM 05/06/2014 2013 37,516,780 1.95 73,157,721 CSM 05/06/2015 2014 38,889,996 2.05 79,724,492 CSM 09/06/2016 2015 43,324,068 2.42 104,844,245 CSM 08/06/2017 2016 45,605,599 2.68 122,223,005 OSM 07/06/2018 2017 95,050,942 1.50 142,574,358 CSM 11/06/2019 2018 97,185,200 1.59 154,522,276 OSM 11/06/2020 2019 100,348,772 1.75 175,607,076 CSM 10/06/2021 2020 100,955,418 1.80 181,715,083 CSM 09/06/2022 2021 102,720,955 1.86 191,060,498 CSM 08/06/2023 2022 102,876,685 1.92 197,523,235 OSM 11/06/2024 2023 103,524,854 1.98 204,979,211 On 4 November 2024, the Management Board authorised the payment of an exceptional interim dividend of €0.75 per share, i.e., €77,305,566, paid on 8 November 2024. This interim dividend will be deducted from the dividend to be decided by the 2025 Shareholders’ Meeting.
Taking into account the total shareholder return of the Rubis share in 2024, as defined by Article 56 of the by-laws, the dividend of the General Partners amounted to €11,279 thousand (nil for the 2023 financial year).
Accounting policies
In accordance with IFRS 8, operating segments are those examined by the Group’s main operational decision-makers (the Managing Partners). This segment analysis is based on internal organisational systems and the Group’s Management structure. This approach leads to a distinction between the following two segments:
- the Energy Distribution segment, which includes the retail and distribution of fuels, heating oils, lubricants, liquefied gases and bitumen, as well as logistics, which includes trading-supply, the refining activity and shipping;
- the Renewable Electricity Production segment, specialising in the production of photovoltaic electricity.
The Group has also identified three regions: Europe, Africa and Caribbean.
The following table presents, for each business segment, information on income from usual activities and the results for 2024 and 2023. Each column in the table below contains figures specific to each segment as an independent entity; the “Eliminations” column groups together transactions and accounts between the different segments which have been eliminated.
31/12/2024
(in thousands of euros)Energy
DistributionRenewable
Electricity
ProductionReconciliation Rubis
Terminal (JV)Parent
companyEliminations Total Revenue 6,594,621 49,153 165 6,643,939 Intersegment revenue 317 7,421 (7,738) Revenue 6,594,938 49,153 7,586 (7,738) 6,643,939 Gross operating income (EBITDA) 731,072 26,167 (36,246) 720,993 Current operating income (EBIT) 548,726 (7,696) (37,235) 503,795 Share of net income from joint ventures 1,955 (128) 4,979 6,806 Operating income after share of net income from joint ventures 549,534 (8,291) 4,979 50,775 596,997 Cost of financial debt (79,028) (27,799) 6,748 16,967 (83,112) Income tax expense (84,589) 6,918 (3,764) (81,435) TOTAL NET INCOME 304,346 (30,829) 4,979 72,607 351,103 31/12/2023
(in thousands of euros)Energy
DistributionRenewable
Electricity
ProductionReconciliation Rubis
Terminal (JV)Parent
companyEliminations Total Revenue 6,581,249 48,639 89 6,629,977 Intersegment revenue 330 4,867 (5,197) Revenue 6,581,579 48,639 4,956 (5,197) 6,629,977 Gross operating income (EBITDA) 796,898 29,360 (28,405) 797,853 Current operating income (EBIT) 647,132 3,719 (29,490) 621,361 Share of net income from joint ventures 1,989 (311) 13,252 14,930 Operating income after share of net income from joint ventures 662,965 (3,085) 13,252 (29,491) 643,641 Cost of financial debt (72,653) (20,046) 7,051 13,659 (71,989) Income tax expense (61,735) 4,448 (573) (57,860) TOTAL NET INCOME 386,523 (23,405) 13,252 (9,357) 367,013 31/12/2024
(in thousands of euros)Energy
DistributionRenewable
Electricity
ProductionReconciliation Rubis
Terminal (JV)Parent
companyEliminations Total Fixed assets 2,973,264 1,148,826 199,259 (1) 4,321,348 Equity interests 18,981 173 1,091,118 (1,094,461) 15,811 Interests in joint ventures 24,234 5,151 29,385 Deferred tax assets 20,382 4,305 24,687 Segment assets 1,899,998 91,801 786,001 (434,937) 2,342,863 Total assets 4,936,859 1,250,256 2,076,378 (1,529,399) 6,734,094 Consolidated equity 1,829,441 416,835 1,809,549 (1,094,458) 2,961,367 Financial debt 1,570,011 654,613 1,521 2,226,145 Deferred tax liabilities (32,761) 11,257 94,681 73,177 Segment liabilities 1,570,168 167,551 170,627 (434,941) 1,473,405 Total liabilities 4,936,859 1,250,256 2,076,378 (1,529,399) 6,734,094 Borrowings and financial debt (excluding lease liabilities) 1,367,723 599,435 1,521 1,968,679 Cash and cash equivalents 398,332 32,409 245,632 676,373 Net financial debt 969,391 567,026 (244,111) 1,292,306 Investments 165,352 81,794 716 247,862 31/12/2023
(in thousands of euros)Renewable
Electricity
ProductionReconciliation Energy
DistributionRubis
Terminal (JV)Parent
companyEliminations Total Fixed assets 2,765,035 1,075,376 25,457 3,865,868 Equity interests 23,739 268 1,434,530 (1,416,655) 41,882 Interests in joint ventures 21,519 (378) 289,530 310,671 Deferred tax assets 18,598 10,172 28,770 Segment assets 1,772,528 67,790 626,584 (367,356) 2,099,546 Total assets 4,601,419 1,153,228 289,530 2,086,571 (1,784,011) 6,346,737 Consolidated equity 1,581,397 442,944 289,530 1,865,725 (1,416,651) 2,762,945 Financial debt 1,605,862 580,968 1,521 2,188,351 Deferred tax liabilities (18,278) 25,437 76,500 83,659 Segment liabilities 1,432,438 103,879 142,825 (367,360) 1,311,782 Total liabilities 4,601,419 1,153,228 289,530 2,086,571 (1,784,011) 6,346,737 Borrowings and financial debt (excluding lease liabilities) 1,422,379 525,693 1,521 1,949,593 Cash and cash equivalents 332,209 18,946 238,530 589,685 Net financial debt 1,090,170 506,747 (237,009) 1,359,908 Investments 205,861 77,150 329 283,340 31/12/2024
(in thousands of euros)Reconciliation Europe Caribbean Africa Rubis
Terminal (JV)Parent
companyTotal Revenue 865,638 3,260,829 2,517,307 165 6,643,939 Gross operating income (EBITDA) 131,969 393,084 232,187 (36,247) 720,993 Current operating income (EBIT) 51,302 304,623 185,105 (37,235) 503,795 Operating income after share of net income from joint ventures 52,967 302,144 186,132 4,979 50,775 596,997 Investments 122,124 66,712 58,310 716 247,862 Reconciliation 31/12/2023
(in thousands of euros)Europe Caribbean Africa Rubis
Terminal (JV)Parent
companyTotal Revenue 848,594 3,284,819 2,496,475 89 6,629,977 Gross operating income (EBITDA) 129,003 375,059 322,196 (28,405) 797,853 Current operating income (EBIT) 63,613 299,618 287,619 (29,489) 621,361 Operating income after share of net income from joint ventures 59,939 298,586 301,355 13,252 (29,491) 643,641 Investments 115,001 100,764 67,246 329 283,340 As of 31 December 2024, revenue generated in France (including overseas territories) amounted to €2,101 million.
Reconciliation 31/12/2024
(in thousands of euros)Europe Caribbean Africa Rubis
Terminal (JV)Parent
companyTotal Fixed assets 1,807,450 1,133,490 1,181,150 199,258 4,321,348 Equity interests 10,921 4,601 258 31 15,811 Interests in joint ventures 20,134 5,654 3,597 29,385 Deferred tax assets 5,446 7,664 11,577 24,687 Segment assets 335,602 893,466 759,800 353,995 2,342,863 TOTAL ASSETS 2,179,553 2,044,875 1,956,382 553,284 6,734,094 Reconciliation 31/12/2023
(in thousands of euros)Europe Caribbean Africa Rubis
Terminal (JV)Parent
companyTotal Fixed assets 1,740,980 1,045,611 1,053,821 25,456 3,865,868 Equity interests 34,769 6,831 257 25 41,882 Interests in joint ventures 17,823 3,318 289,530 310,671 Deferred tax assets 11,241 6,035 11,494 28,770 Segment assets 289,982 807,218 742,098 260,248 2,099,546 TOTAL ASSETS 2,094,795 1,865,695 1,810,988 289,530 285,729 6,346,737 As of 31 December 2024, non-current assets held in France (including overseas territories) amounted to €2,023 million.
As of 31 December 2024, the primary non-controlling interests are calculated for the following entities or sub-groups:
The Group consolidates the 71%-owned SARA using the full consolidation method; the 29% non-controlling interests are held by Sol Petroleum Antilles SAS.
The Easigas entities are consolidated using the full consolidation method, with the Group owning an interest of 55%.
Since 1 April 2022, the Group uses the full consolidation method to consolidate the Photosol (France) entities, some of which are less than 100% owned (see scope of consolidation in note 12).
(in thousands of euros) 31/12/2024 31/12/2023 Net revenue 1,182,995 1,260,170 Total net income 24,722 21,299 • Group share 16,522 14,428 • Share attributable to non-controlling interests 8,200 6,871 Other comprehensive income (2,131) 571 • Group share (1,513) 405 • Share attributable to non-controlling interests (618) 166 Comprehensive income for the period 22,591 21,870 • Group share 15,009 14,833 • Share attributable to non-controlling interests 7,582 7,037 Dividends paid to non-controlling interests 6,827 6,825 Cash flows related to operating activities 12,717 110,693 Cash flows related to investing activities (14,898) (23,552) Cash flows related to financing activities 2,099 (118,994) Change in cash and cash equivalents (82) (31,853) 7.2 Condensed financial information – Subsidiary with non-controlling interest: Easigas SA and its subsidiaries
(in thousands of euros) 31/12/2024 31/12/2023 Net revenue 178,563 170,744 Total net income 11,191 15,834 • Group share 5,812 8,503 • Share attributable to non-controlling interests 5,379 7,331 Other comprehensive income • Group share • Share attributable to non-controlling interests Comprehensive income for the period 11,191 15,834 • Group share 5,812 8,503 • Share attributable to non-controlling interests 5,379 7,331 Dividends paid to non-controlling interests 3,834 5,883 Cash flows related to operating activities 15,955 24,968 Cash flows related to investing activities (8,811) (10,273) Cash flows related to financing activities (8,219) (14,116) Impact of exchange rate changes 70 1,570 Change in cash and cash equivalents (1,005) 2,149 7.3 Condensed financial information – Subsidiary with non-controlling interests: Photosol and its subsidiaries
(in thousands of euros) 31/12/2024 31/12/2023 Net revenue 49,153 48,639 Total net income (28,031) (20,806) • Group share (21,782) (16,093) • Share attributable to non-controlling interests (6,249) (4,713) Other comprehensive income (4,093) (13,018) • Group share (3,168) (10,031) • Share attributable to non-controlling interests (925) (2,987) Comprehensive income for the period (32,124) (33,824) • Group share (24,950) (26,124) • Share attributable to non-controlling interests (7,174) (7,700) Dividends paid to non-controlling interests 1 Cash flows related to operating activities 18,426 (10,629) Cash flows related to investing activities (91,783) (87,811) Cash flows related to financing activities 87,428 73,172 Change in cash and cash equivalents 14,071 (25,267) Accounting policies
These interests, which are consolidated by the equity method, involve joint ventures and companies in which the Group has significant influence. They are initially recognised at acquisition cost, including any goodwill generated. Their carrying amount is then increased or decreased to recognise the Group share of the entity’s profits or losses after the date of acquisition. Whenever losses are greater than the value of the Group’s net investment in the equity method, these losses are not recognised unless the Group has entered into a commitment to recapitalise the entity or provide it with funding.
If there is an indication that an investment may be impaired, its recoverable value is tested as described in note 4.2. Impairment losses shown by these impairment tests are recognised as a deduction from the carrying amount of the corresponding interests.
The Group classifies several partnerships as joint ventures within the meaning of IFRS 11. Their contributions to the Group’s financial statements are not material as of 31 December 2024.
(in thousands of euros) 31/12/2024 31/12/2023 Liabilities secured 376,047 398,392 Commitments given 715,875 641,118 Guarantees and securities 525,695 510,378 Other commitments given 190,180 130,740 Commitments received 749,413 483,290 Confirmed credit facilities 389,035 442,157 Guarantees and securities 27,189 26,233 Guarantee received on receivable related to the disposal of Rubis Terminal (see note 3.2.1) 259,159 Other 74,030 14,900 - bank guarantees granted on loans obtained by the Group’s subsidiaries;
- guarantees required by suppliers of petroleum products;
- guarantees given to customs authorities;
- guarantees granted to the French Energy Regulatory Commission (Commission de régulation de l’énergie – CRE) as part of calls for tender procedures.
As of 31 December 2024, the Group had interest rate hedging agreements (caps and floors) of €912 million on a total of €1,211 million in variable-rate debt, representing 75% of that amount.
As part of its acquisition and disposal transactions concerning subsidiaries, the Group gives or receives guarantees on liabilities, with no specific duration or amount.
Payments due by period Contractual obligations as of 31/12/2024
(in thousands of euros)Total Less than
1 yearBetween 1
and 5 yearsMore than
5 yearsBank loans 1,587,265 305,561 774,079 507,625 Letters of credit 68,257 68,257 Other long-term commitments 21,440 9,223 12,217 TOTAL 1,676,962 383,041 786,296 507,625 The fixed compensation of the Management Board is governed by Article 54 of the by-laws. It totalled €3,100 thousand for the financial year, including compensation due to the Management Board of the parent company (€2,624 thousand, for which the corresponding social security contributions are entirely borne by the Managing Partners) and compensation due for Management functions in the subsidiaries (i.e., €476 thousand gross).
The Ordinary Shareholders’ Meeting of 11 June 2024 (15th resolution) approved the compensation policy for the Management Board for the 2024 financial year. This included an annual variable portion, the terms of which are described in chapter 5 of the 2023 Universal Registration Document. The annual variable compensation of the Management Board for the 2024 financial year was the subject of a provision of €475 thousand.
Compensation paid to members of the parent company’s Supervisory Board totalled €316 thousand in respect of the 2024 financial year.
The Group’s main risks related to climate change stem from both a physical risk and a transition risk.
The physical risk relates to the occurrence of extreme events, the intensity of which tends to increase and which could, on the one hand, damage the integrity of the sites and, on the other hand, disrupt the operations of the subsidiaries in question, and in turn cause operating losses. The Group observes that the financial impact of deteriorations directly related to extreme weather events, such as the latest cyclones in the Caribbean, have had a moderate impact on results. The geographical diversification and broadening of the Group’s scope, as well as the non-material nature of its sites individually, greatly limit exposure to climatic hazards that may occur in a given area. The new Photovoltaic Electricity Production activity, integrated into the Group since April 2022, is currently concentrated in France and thus less exposed to extreme weather events.
Rubis is also exposed to the challenges of its sector in terms of energy transition. Occasionally rapid shifts in the regulatory environment and policies in support of a low-carbon economy could impose a significant reduction in CO2 emissions and make other less carbon-intensive energies more competitive in the long term. The short-term impact of climate risk is considered low to moderate depending on the products and regions concerned and, to date, to have had no material impact on the Group’s consolidated financial statements. Through the acquisition of a photovoltaic electricity production activity, the Group aims to reduce its exposure to this type of risk.
These risks are managed by the Sustainability Strategy Committee in conjunction with the various subsidiaries and functional departments, with the support of specialised consultants.
The Group has taken into consideration the impacts of potential climate challenges and the consequences of its 2030 ambition as identified to date in connection with the closing of the financial statements as of 31 December 2024. In particular, the Group:
- considered the short-term effects of commitments made in determining the recoverable value of goodwill (see note 4.2);
- considered external market data in setting the long-term growth rate taken into account in determining the recoverable value of goodwill;
- considered climate risks in the assessment of other provisions (see note 4.11).
To date, the Group has not identified any indication of impairment of its fixed assets due to climate risk, and the impact related to climate challenges had no material impact on the Group’s financial statements as of 31 December 2024.
Fees paid to the Statutory Auditors and members of their networks in respect of 2024 and 2023 break down as follows:
PriceWaterhouseCoopers Audit KPMG Amount (excl. tax) % Amount (excl. tax) % (in thousands of euros) 2024 2023 2024 2023 2024 2023 2024 2023 Certification of financial statements Audit, certification and examination of the consolidated and separate financial statements: • issuer 451 434 19% 22% 550 529 30% 30% • fully consolidated subsidiaries 1,256 1,266 53% 65% 1,179 1,147 65% 65% Sub-total 1,707 1,700 72% 87% 1,729 1,676 95% 95% Sustainability information certification • issuer 490 21% Sub-total 490 21% Services other than certification of financial statements and sustainability information • issuer 10 95 0% 5% 10 1% • fully consolidated subsidiaries 159 149 7% 8% 85 81 5% 5% Sub-total 169 244 7% 13% 95 81 5% 5% TOTAL 2,366 1,944 100% 100% 1,824 1,757 100% 100% Services other than the certification of financial statements and information on sustainability mainly relate to the issuing of certifications (financial covenants, etc.).
There were no events after the reporting period that could have a material impact on the consolidated financial statements as of 31 December 2024.
The consolidated financial statements for the financial year ended 31 December 2024 include the Rubis SCA financial statements and those of its subsidiaries listed in the table below.
Name Registered
office/Country31/12/2024
% control31/12/2023
% control31/12/2024
% interest31/12/2023
% interestConsolidation
method*Rubis SCA 46, rue Boissière
75116 Paris –
France
SIREN:
784 393 530Parent Parent Parent Parent Rubis Patrimoine France 100.00% 100.00% 100.00% 100.00% FC Coparef France 100.00% 100.00% 100.00% 100.00% FC Rubis Renouvelables (formerly
Cimarosa Investissements)France 100.00% 100.00% 100.00% 100.00% FC Rubis HyDev France 100.00% 100.00% 100.00% 100.00% FC RT Invest France 55.00% 55.00% JV (EM) Rubis Terminal Infra France 55.00% 55.00% JV (EM) Rubis Énergie France 100.00% 100.00% 100.00% 100.00% FC Vitogaz France France 100.00% 100.00% 100.00% 100.00% FC Sicogaz France 100.00% 100.00% 100.00% 100.00% FC Sigalnor France 65.00% 65.00% 65.00% 65.00% FC Starogaz (UTA) France 100.00% 100.00% FC Norgal France 20.94% 20.94% 20.94% 20.94% JO Frangaz France 100.00% 100.00% 100.00% 100.00% FC Vito Corse France 100.00% 100.00% 100.00% 100.00% FC RD3A France 100.00% 100.00% 100.00% 100.00% FC Rubis Restauration et Services France 100.00% 100.00% 100.00% 100.00% FC Vitogaz Switzerland AG Switzerland 100.00% 100.00% 100.00% 100.00% FC Rubis Energia Portugal SA Portugal 100.00% 100.00% 100.00% 100.00% FC Sodigas Seixal Sociedade
de Distribuição de Gás SAPortugal 100.00% 100.00% 100.00% 100.00% FC Sodigas Açores SA Portugal 100.00% 100.00% 100.00% 100.00% FC Sodigas Braga Sociedade
de Distribuição de Gás, SAPortugal 100.00% 100.00% 100.00% 100.00% FC Spelta – Produtos Petrolíferos SA Portugal 100.00% 100.00% 100.00% 100.00% FC Companhia Logística de Combustíveis SA Portugal 20.00% 20.00% 20.00% 20.00% JV (EM) Electropalma Sociedade
de Distribuição de Gás SAPortugal 100.00% 100.00% 100.00% 100.00% FC Vitogas España SA Spain 100.00% 100.00% 100.00% 100.00% FC Fuel Supplies Channel Islands Ltd (FSCI) Channel Islands 100.00% 100.00% 100.00% 100.00% FC La Collette Terminal Ltd Channel Islands 100.00% 100.00% 100.00% 100.00% FC St Sampson Terminal Ltd Channel Islands 100.00% 100.00% 100.00% 100.00% FC Vitogaz Maroc Morocco 100.00% 100.00% 100.00% 100.00% FC Lasfargaz Morocco 82.89% 82.89% 82.89% 82.89% FC Kelsey Gas Ltd Republic of Mauritius 100.00% 100.00% 100.00% 100.00% FC Vitogaz Madagascar Madagascar 100.00% 100.00% 100.00% 100.00% FC Eccleston Co Ltd Republic of Mauritius 100.00% 100.00% 100.00% 100.00% FC Vitogaz Comores Union of the Comoros Islands 100.00% 100.00% 100.00% 100.00% FC Gazel Madagascar 49.00% 49.00% 49.00% 49.00% FC Rubis Antilles Guyane France 100.00% 100.00% 100.00% 100.00% FC Stocabu France 50.00% 50.00% 50.00% 50.00% JO Société Industrielle de Gaz et de Lubrifiants France 100.00% 100.00% 100.00% 100.00% FC Société Anonyme de la Raffinerie des Antilles (SARA) France 71.00% 71.00% 71.00% 71.00% FC Société Antillaise des Pétroles Rubis France 100.00% 100.00% 100.00% 100.00% FC Rubis Guyane Française France 100.00% 100.00% 100.00% 100.00% FC Rubis Caraïbes Françaises France 100.00% 100.00% 100.00% 100.00% FC Rubis Saint-Barthélemy France 100.00% 100.00% 100.00% 100.00% FC Société Réunionnaise de Produits Pétroliers (SRPP) France 100.00% 100.00% 100.00% 100.00% FC Société d’importation et de distribution de Gaz liquéfiés dans l’Océan Indien (Sigloi Réunion SAS) France 100.00% 100.00% 100.00% 100.00% FC Rubis Energy Bermuda Ltd Bermuda 100.00% 100.00% 100.00% 100.00% FC Sinders Ltd Bermuda 100.00% 100.00% 100.00% 100.00% FC Bermuda Gas & Utility Company Ltd Bermuda 100.00% 100.00% 100.00% 100.00% FC Rubis Eastern Caribbean SRL Barbados 100.00% 100.00% 100.00% 100.00% FC Rubis Caribbean Holdings Inc. Barbados 100.00% 100.00% 100.00% 100.00% FC Renewstable (Barbados) Inc. Barbados 51.00% 51.00% 51.00% 51.00% FC Rubis West Indies Ltd United Kingdom 100.00% 100.00% 100.00% 100.00% FC Rubis Guyana Inc. Guyana 100.00% 100.00% 100.00% 100.00% FC Rubis Bahamas Ltd The Bahamas 100.00% 100.00% 100.00% 100.00% FC Rubis Cayman Islands Ltd Cayman Islands 100.00% 100.00% 100.00% 100.00% FC Rubis Turks & Caicos Ltd Turks and Caicos Islands 100.00% 100.00% 100.00% 100.00% FC Rubis Energy Jamaica Ltd Jamaica 100.00% 100.00% 100.00% 100.00% FC Easigas (Pty) Ltd South Africa 55.00% 55.00% 55.00% 55.00% FC Easigas Botswana (Pty) Ltd Botswana 55.00% 55.00% 55.00% 55.00% FC Easigas Swaziland (Pty) Ltd Eswatini 55.00% 55.00% 55.00% 55.00% FC Easigas Lesotho (Pty) Ltd Lesotho 55.00% 55.00% 55.00% 55.00% FC Rubis Asphalt South Africa (Pty) Ltd South Africa 74.00% 74.00% 74.00% 74.00% FC Rubis Asphalt et Spécialités Togo Togo 100.00% 100.00% 100.00% 100.00% FC Ringardas Nigeria Ltd Nigeria 100.00% 100.00% 100.00% 100.00% FC European Railroad Established Services SA (Eres SA) Senegal 100.00% 100.00% 100.00% 100.00% FC European Railroad Established Services Togo SA (Eres Togo SASU) Togo 100.00% 100.00% 100.00% 100.00% FC Eres Cameroun Cameroon 100.00% 100.00% 100.00% 100.00% FC Eres Libéria Inc. Republic of Liberia 100.00% 100.00% 100.00% 100.00% FC Eres Gabon Gabon 100.00% 100.00% 100.00% 100.00% FC REC Bitumen SRL Barbados 100.00% 100.00% 100.00% 100.00% FC Bahama Blue Shipping Corporation Barbados 100.00% 100.00% 100.00% 100.00% FC Morbihan Shipping Corporation Barbados 100.00% 100.00% 100.00% 100.00% FC Bitu River Shipping Corp. Panama 100.00% 100.00% 100.00% 100.00% FC Demerara Shipping Corporation Barbados 100.00% 100.00% 100.00% 100.00% FC Pickett Shipping Corp. Republic of Panama 100.00% 100.00% 100.00% 100.00% FC Blue Round Shipping Corp. Republic of Panama 100.00% 100.00% 100.00% 100.00% FC Biskra Shipping SA Republic of Panama 100.00% 100.00% 100.00% 100.00% FC Atlantic Rainbow Shipping Company SA Republic of Panama 100.00% 100.00% 100.00% 100.00% FC Saint James LG Shipping Corporation Barbados 100.00% 100.00% 100.00% 100.00% FC Kensington LG Shipping Corporation Barbados 100.00% 100.00% 100.00% 100.00% FC Woodbar Co Ltd Republic of Mauritius 85.00% 85.00% 85.00% 85.00% FC Rubis Énergie Djibouti Republic of Djibouti 85.00% 85.00% 85.00% 85.00% FC Distributeurs Nationaux SA (Dinasa) Haiti 100.00% 100.00% 100.00% 100.00% FC Chevron Haïti Inc. British Virgin Islands 100.00% 100.00% 100.00% 100.00% FC Société de Distribution de Gaz SA (Sodigaz) Haiti 100.00% 100.00% 100.00% 100.00% FC Terminal Gazier de Varreux SA Haiti 50.00% 50.00% 50.00% 50.00% JO RBF Marketing Ltd Jamaica 100.00% 100.00% 100.00% 100.00% FC Blue Mahoe Energy Company Jamaica 39.33% 39.33% JV (EM) Galana Distribution Pétrolière Company Ltd Republic of Mauritius 100.00% 100.00% 100.00% 100.00% FC Galana Distribution Pétrolière SA Madagascar 90.00% 90.00% 90.00% 90.00% FC Galana Raffinerie Terminal Company Ltd Republic of Mauritius 100.00% 100.00% 100.00% 100.00% FC Galana Raffinerie et Terminal SA Madagascar 90.00% 90.00% 90.00% 90.00% FC Plateforme Terminal Pétrolier SA Madagascar 80.00% 80.00% 80.00% 80.00% FC Rubis Middle East Supply DMCC United Arab Emirates 100.00% 100.00% 100.00% 100.00% FC RAME Rubis Asphalt Middle East DMCC United Arab Emirates 100.00% 100.00% 100.00% 100.00% FC Maritec Tanker Management Private Ltd India 100.00% 100.00% 100.00% 100.00% FC Gulf Energy Holdings Ltd Kenya 100.00% 100.00% 100.00% 100.00% FC Rubis Energy Kenya Plc Kenya 100.00% 100.00% 100.00% 100.00% FC Kobil Petroleum Ltd United States 100.00% 100.00% 100.00% 100.00% FC Rubis Energy Ethiopia Ltd Ethiopia 100.00% 100.00% 100.00% 100.00% FC Rubis Energy Rwanda Ltd Rwanda 100.00% 100.00% 100.00% 100.00% FC Rubis Energy Uganda Ltd Uganda 100.00% 100.00% 100.00% 100.00% FC Rubis Energy Zambia Ltd Zambia 100.00% 100.00% 100.00% 100.00% FC Rubis Energy Zimbabwe (Private) Ltd Zimbabwe 55.00% 55.00% 55.00% 55.00% FC Soida Indùstria de Derivados Asfálticos, LDA Angola 35.00% 35.00% 35.00% 35.00% JV (EM) Alengás, Sociedade Alentejana de Gás, SA Portugal 100.00% 100.00% FC Antilles Shipping Services France 100.00% 100.00% FC Camarship France 100.00% 100.00% FC Canopy Services Limited Kenya 100.00% 100.00% FC Eres Guinea SASU Guinea 100.00% 100.00% FC EZdrive France 49.00% 49.00% JV (EM) Rubis Énergie Burundi SA Burundi 100.00% 100.00% FC Maritimes Shipping Services (Marship) France 100.00% 100.00% FC Oil & Sea Services France 100.00% 100.00% FC Probakery Solutions Limited Kenya 25.00% 25.00% FC SAAGA, Sociedade Açoreana de Armazenagem de Gás SA Portugal 25.00% 25.00% JV (EM) Soleco Energy Ltd United Kingdom 35.30% 35.30% JV (EM) Upper Valley Energy Limited Kenya 50.00% 50.00% FC Vito New Energies Solutions SA Switzerland 100.00% 100.00% FC Rubis Photosol France 78.66% 78.51% 78.66% 78.51% FC Aedes & Photosol Développement France 39.33% 39.26% 39.33% 39.26% JV (EM) Airefsol Énergies 1 France 78.65% 78.49% 78.65% 78.49% FC Airefsol Énergies 7 France 78.65% 78.49% 78.65% 78.49% FC Alpha Énergies Renouvelables France 78.17% 78.02% 78.17% 78.02% FC Centrale Photovoltaïque de Ychoux France 78.65% 78.50% 78.65% 78.50% FC Centrale Photovoltaïque Lagune de Toret France 78.65% 78.49% 78.65% 78.49% FC Centrale Photovoltaïque le Bouluc de Fabre France 78.65% 78.49% 78.65% 78.49% FC Cilaos France 78.65% 78.49% 78.65% 78.49% FC Clotilda France 78.65% 78.49% 78.65% 78.49% FC Cpes de L’Ancienne Cokerie France 78.65% 78.49% 78.65% 78.49% FC Dynamique Territoires Développement France 78.66% 78.51% 78.66% 78.51% FC EPV France 78.65% 78.49% 78.65% 78.49% FC Firinga France 78.65% 78.49% 78.65% 78.49% FC Inti SAS France 78.65% 78.49% 78.65% 78.49% FC Maïdo France 78.65% 78.49% 78.65% 78.49% FC Phoebus France 78.65% 78.49% 78.65% 78.49% FC Photom Services France 78.60% 77.20% 78.60% 77.20% FC Photosol France 78.65% 78.49% 78.65% 78.49% FC Photosol Bordezac Développement France 78.65% 78.49% 78.65% 78.49% FC Photosol Bourbon France 78.65% 78.49% 78.65% 78.49% FC Photosol Brossac France 78.65% 78.49% 78.65% 78.49% FC Photosol CRE 4 France 78.65% 78.49% 78.65% 78.49% FC Photosol Développement France 78.66% 78.51% 78.66% 78.51% FC Photosol Hermitage France 78.66% 78.51% 78.66% 78.51% FC Photosol Invest 2 France 78.66% 78.51% 78.66% 78.51% FC Photosol Maransin France 78.66% 78.51% 78.66% 78.51% FC Photosol Roullet (UTA) France 78.51% 78.51% FC Photosol Sarrazac Développement France 78.65% 78.49% 78.65% 78.49% FC Photosol SPV 1 France 78.65% 78.49% 78.65% 78.49% FC Photosol SPV 2 France 78.65% 78.49% 78.65% 78.49% FC Photosol SPV 3 France 78.65% 78.49% 78.65% 78.49% FC Photosol SPV 4 France 78.65% 78.49% 78.65% 78.49% FC Photosol SPV 5 France 78.65% 78.49% 78.65% 78.49% FC Photosol SPV 6 France 78.65% 78.49% 78.65% 78.49% FC Photosol SPV 7 France 78.65% 78.49% 78.65% 78.49% FC Photosol SPV 9 France 56.58% 56.47% 56.58% 56.47% FC Photosol SPV 10 France 78.65% 78.49% 78.65% 78.49% FC Photosol SPV 11 France 78.65% 78.49% 78.65% 78.49% FC Photosol SPV 12 France 78.65% 78.49% 78.65% 78.49% FC Photosol SPV 13 France 78.65% 78.49% 78.65% 78.49% FC Photosol SPV 14 France 78.65% 78.49% 78.65% 78.49% FC Photosol SPV 15 France 52.78% 52.68% 52.78% 52.68% FC Photosol SPV 16 France 78.65% 78.49% 78.65% 78.49% FC Photosol SPV 17 France 78.65% 78.49% 78.65% 78.49% FC Photosol SPV 18 France 78.65% 78.49% 78.65% 78.49% FC Photosol SPV 22 France 78.65% 78.49% 78.65% 78.49% FC Photosol SPV 25 France 78.65% 78.49% 78.65% 78.49% FC Photosol SPV 26 France 52.78% 78.51% 52.78% 78.51% FC Photosol SPV 27 France 78.65% 78.50% 78.65% 78.50% FC Photosol SPV 28 France 78.65% 78.49% 78.65% 78.49% FC Photosol SPV 29 France 78.66% 78.51% 78.66% 78.51% FC Photosol SPV 30 France 78.66% 78.51% 78.66% 78.51% FC Photosol SPV 31 France 78.66% 78.51% 78.66% 78.51% FC Photosol SPV 32 France 78.65% 72.68% 78.65% 72.68% FC Photosol SPV 33 France 78.65% 78.49% 78.65% 78.49% FC Photosol SPV 34 France 78.65% 71.36% 78.65% 71.36% FC Photosol SPV 35 France 78.65% 78.49% 78.65% 78.49% FC Photosol SPV 36 France 66.09% 65.96% 66.09% 65.96% FC Photosol SPV 37 France 78.65% 72.01% 78.65% 72.01% FC Photosol SPV 38 France 78.65% 78.49% 78.65% 78.49% FC Photosol SPV 39 France 64.47% 64.34% 64.47% 64.34% FC Photosol SPV 40 France 78.65% 78.49% 78.65% 78.49% FC Photosol SPV 43 France 67.22% 67.09% 67.22% 67.09% FC Photosol SPV 44 France 78.66% 78.51% 78.66% 78.51% FC Photosol SPV 45 France 78.65% 78.51% 78.65% 78.51% FC Photosol SPV 46 France 78.49% 78.51% 78.49% 78.51% FC Photosol SPV 48 France 52.78% 52.69% 52.78% 52.69% FC Photosol SPV 49 France 78.66% 78.51% 78.66% 78.51% FC Photosol SPV 50 France 78.66% 78.51% 78.66% 78.51% FC Photosol SPV 51 France 52.78% 52.69% 52.78% 52.69% FC Photosol SPV 52 France 78.65% 78.49% 78.65% 78.49% FC Photosol SPV 53 France 52.78% 52.69% 52.78% 52.69% FC Photosol SPV 54 France 52.78% 52.69% 52.78% 52.69% FC Photosol SPV 55 France 78.65% 78.49% 78.65% 78.49% FC Photosol SPV 56 France 78.66% 78.51% 78.66% 78.51% FC Photosol SPV 57 (UTA) France 78.51% 78.51% FC Photosol SPV 58 France 78.66% 78.51% 78.66% 78.51% FC Photosol SPV 59 France 78.66% 78.51% 78.66% 78.51% FC Photosol SPV 60 France 78.66% 78.51% 78.66% 78.51% FC Photosol SPV 61 France 78.66% 78.51% 78.66% 78.51% FC Photosol SPV 63 France 78.66% 78.51% 78.66% 78.51% FC Photosol SPV 65 France 78.65% 78.51% 78.65% 78.51% FC Rubis Photosol SPV 67 France 78.66% 78.51% 78.66% 78.51% FC Rubis Photosol SPV 68 France 78.66% 78.51% 78.66% 78.51% FC Rubis Photosol SPV 69 France 78.66% 78.51% 78.66% 78.51% FC Rubis Photosol SPV 70 France 78.66% 78.51% 78.66% 78.51% FC Rubis Photosol SPV 71 France 78.66% 78.51% 78.66% 78.51% FC Rubis Photosol SPV 72 France 78.66% 78.51% 78.66% 78.51% FC Rubis Photosol SPV 73 France 78.66% 78.51% 78.66% 78.51% FC Rubis Photosol SPV 74 France 78.66% 78.51% 78.66% 78.51% FC Rubis Photosol SPV 75 France 78.66% 78.51% 78.66% 78.51% FC Rubis Photosol SPV 76 France 78.66% 78.51% 78.66% 78.51% FC Rubis Photosol SPV 77 France 78.66% 78.51% 78.66% 78.51% FC Rubis Photosol SPV 78 France 78.66% 78.51% 78.66% 78.51% FC Rubis Photosol SPV 79 France 78.66% 78.51% 78.66% 78.51% FC Rubis Photosol SPV 80 France 78.66% 78.51% 78.66% 78.51% FC Rubis Photosol SPV 81 France 78.66% 78.66% FC Rubis Photosol SPV 82 France 78.66% 78.66% FC Rubis Photosol SPV 83 France 78.66% 78.66% FC Rubis Photosol SPV 84 France 78.66% 78.66% FC Rubis Photosol SPV 85 France 78.66% 78.66% FC Rubis Photosol SPV 86 France 78.66% 78.66% FC Rubis Photosol SPV 88 France 78.66% 78.66% FC Rubis Photosol SPV 89 France 78.66% 78.66% FC Rubis Photosol SPV 94 France 47.20% 47.20% FC Rubis Photosol SPV 95 France 47.20% 47.20% FC Photosol Villefranche-sur-Cher Développement France 78.65% 78.49% 78.65% 78.49% FC PV Écarpière France 78.65% 78.49% 78.65% 78.49% FC Société du Parc Photovoltaïque de la Commanderie France 78.65% 78.49% 78.65% 78.49% FC Solaire du Lazaret France 78.65% 78.49% 78.65% 78.49% FC Territoires Énergies Nouvelles France 78.65% 78.49% 78.65% 78.49% FC Thorenc PV France 78.65% 78.49% 78.65% 78.49% FC Photosol Mobexi France 74.73% 77.69% 74.73% 77.69% FC Rubis Photosol Mobexi 2 France 74.73% 74.73% FC Rubis Photosol Mobexi 4 France 74.73% 74.73% FC Photosol Développement France France 78.66% 78.51% 78.66% 78.51% FC Photosol Énergies Locales France 78.66% 78.66% FC Énergie du Partage 6 France 70.79% 70.79% FC ENER 5 France 40.12% 40.12% FC Hexa Solaire 1 France 40.12% 40.12% FC EuroRidge Solar Holding SARL Luxembourg 78.66% 78.51% 78.66% 78.51% FC Thorenc PV Holding SARL Luxembourg 78.66% 78.51% 78.66% 78.51% FC Photosol Energia Italia Italy 78.66% 78.51% 78.66% 78.51% FC Photosol Italia Italy 78.65% 78.49% 78.65% 78.49% FC VPD Solar 01 Italy 78.65% 78.49% 78.65% 78.49% FC VPD Solar 03 Italy 78.65% 78.65% FC VPD Solar 04 Italy 78.65% 78.65% FC VPD Solar 05 Italy 78.65% 78.49% 78.65% 78.49% FC VPD Solar 06 Italy 78.65% 78.49% 78.65% 78.49% FC VPD Solar 09 Italy 78.65% 78.49% 78.65% 78.49% FC VPD Solar 10 Italy 78.65% 78.65% FC Photosol España assets Spain 78.65% 78.49% 78.65% 78.49% FC Photosol Desarrollos Spain 78.66% 78.51% 78.66% 78.51% FC Desarrollos Renovables Ayala Spain 78.66% 78.51% 78.66% 78.51% FC Desarrollos Renovables Balmaseda Spain 78.66% 78.51% 78.66% 78.51% FC Rubis Photosol ES SPV 3 Global Kindo SL Spain 78.66% 78.66% FC Rubis Photosol ES SPV 4 Global Cayon SL Spain 78.66% 78.66% FC Rubis Photosol ES SPV 5 Global Nioka SL Spain 78.66% 78.66% FC Rubis Photosol ES SPV 6 Global Tresimeno SL Spain 78.66% 78.66% FC Rubis Photosol ES SPV 7 Global Trebia SL Spain 78.66% 78.66% FC Rubis Photosol ES SPV 8 Global Timeo SL Spain 78.66% 78.66% FC Rubis Photosol ES SPV 9 Global Olidi SL Spain 78.66% 78.66% FC Rubis Photosol ES SPV 10 Global Nosis SL Spain 78.66% 78.66% FC Rubis Photosol ES SPV 11 Global Albonita SL Spain 78.66% 78.66% FC Rubis Photosol ES SPV 12 Global Atreides SL Spain 78.66% 78.66% FC Rubis Photosol ES SPV 13 Global Bromeli SL Spain 78.66% 78.66% FC Rubis Photosol ES SPV 14 Global Costino SL Spain 78.66% 78.66% FC Rubis Photosol ES SPV 15 Global Delambre SL Spain 78.66% 78.66% FC Rubis Photosol ES SPV 16 Global Ginaz SL Spain 78.66% 78.66% FC Rubis Photosol ES SPV 17 Global Hagal SL Spain 78.66% 78.66% FC Rubis Photosol ES SPV 18 Global Harkonen SL Spain 78.66% 78.66% FC Rubis Photosol ES SPV 19 Global Metuli SL Spain 78.66% 78.66% FC Rubis Photosol ES SPV 20 Global Moritani SL Spain 78.66% 78.66% FC Photosol Energia Polska Poland 78.66% 78.51% 78.66% 78.51% FC -
7.2 2024 separate financial statements and notes
(in thousands of euros) Notes Gross Depreciation,
amortisation
and impairmentNet
31/12/2024Net
31/12/2023Fixed assets Property, plant and equipment and intangible assets 2,736 1,573 1,163 1,131 Equity Interests 4.1 1,101,567 1,101,567 1,424,718 Other financial investments 4.2 2,166 2,166 1,471 Total fixed assets (I) 1,106,469 1,573 1,104,896 1,427,320 Current assets Trade and other receivables 4.4 803,029 208 802,821 472,734 Investment securities 4.3 119,462 119,462 175,028 Cash 119,346 119,346 57,354 Prepaid expenses 813 813 455 Total current assets (II) 1,042,650 208 1,042,442 705,571 TOTAL ASSETS (I + II) 2,149,119 1,781 2,147,338 2,132,891 (in thousands of euros) Notes 31/12/2024 31/12/2023 Equity Share capital 129,005 128,994 Share premiums 1,537,708 1,553,914 Legal reserve 12,954 12,954 Restricted reserve 1,763 1,763 Other reserves 94,626 94,626 Retained earnings 47,433 118,607 Earnings for the financial year 301,261 211,111 Regulated provisions 1,242 1,242 Total equity (I) 4.5 2,125,992 2,123,211 Provisions for contingencies and expenses (II) 667 734 Liabilities Bank loans 169 169 Trade and other payables 5,086 1,574 Taxes and social security payables 11,052 5,014 Other liabilities 4,372 2,189 Total liabilities (III) 4.6 20,679 8,946 TOTAL EQUITY AND LIABILITIES (I + II + III) 2,147,338 2,132,891 (in thousands of euros) Notes 31/12/2024 31/12/2023 Sales of services 7,588 4,958 Operating income 7,588 4,958 Other purchases and external expenses (17,839) (10,137) Taxes, duties and similar payments (398) (363) Employee benefits expense (10,097) (7,432) Additions to depreciation of fixed assets (198) (221) Additions to and reversals of provisions for contingencies and expenses 67 (24) Other expenses (3,434) (3,258) Operating expenses (31,899) (21,435) Profit (loss) from operating activities (24,311) (16,477) Finance income from equity interests 231,439 194,705 Finance income from other securities 1,500 2,846 Other interest income 20,764 14,944 Net income from disposal of marketable securities 2,804 20 Reversals of financial provisions 278 Net finance income (expense) 256,507 212,793 Profit (loss) from ordinary activities before tax 232,196 196,316 Extraordinary items 5.1 60,405 Income tax 5.2 8,660 14,795 TOTAL NET INCOME 301,261 211,111 (in thousands of euros) 31/12/2024 31/12/2023 Operating activity Profit (loss) for the period 301,261 211,111 Depreciation and provisions 131 (33) Capital gains or losses on disposals of fixed assets (60,400) Cash flow (A) 240,992 211,078 Change in working capital requirement (B): (57,661) 15,981 • Trade and other receivables (69,370) 15,302 • Trade and other payables 11,709 679 Operating cash flows (A + B) (I) 183,331 227,059 Investments Disposals of equity interests: • Rubis Terminal 124,403 Other (934) 523 Cash flow allocated to investments (II) 123,469 523 Cash flow from operating activities (I + II) 306,800 227,582 Financing Increase (decrease) in equity (16,194) 4,096 Dividend paid (282,285) (197,524) Other cash flows from financing operations (1,895) Cash flow from financing activities (III) (300,374) (193,428) Overall change in cash flow (I + II + III) 6,426 34,154 Opening cash and cash equivalents 232,382 198,228 Overall change in cash flow 6,426 34,154 Closing cash and cash equivalents 238,808 232,382 Financial debt (169) (169) CLOSING CASH AND CASH EQUIVALENTS NET OF FINANCIAL DEBT 238,639 232,213 Rubis SCA is a Partnership Limited by Shares registered and domiciled in France. Its registered office is located at 46, rue Boissière 75116 Paris, France.
- Energy Distribution, which includes the distribution of fuels, heating oils, lubricants, liquefied gases and bitumen, as well as logistics, which includes trading-supply, the refining activity and shipping;
- Renewable Electricity Production, which mainly includes photovoltaic electricity production activities (Rubis Photosol) specialising in large ground-based facilities, car park shades and rooftop installations for professionals.
Following the final agreement signed on 10 April 2024, Rubis completed the disposal of its 55% stake in the Rubis Terminal JV (now called Tepsa) to I Squared Capital on 16 October 2024 for an amount of €384 before tax and expenses; Rubis received an initial payment of €124 million in 2024. The balance (€260 million excluding interest) will be received in three instalments of the same amount in 2025, 2026 and 2027. The capital gain on the disposal net of commissions and other expenses amounted to €60 million and is presented in extraordinary items.
The French Finance law for 2024 (Article 33 of law No. 2023-1322 of 29 December 2023) transposed the Pillar 2 Directive (Directive (EU) 2022/2523 of 14 December 2022) aimed at establishing a global minimum tax. Given its revenue, the Rubis Group falls within the scope of this new legislation. In this context, Rubis SCA is the Ultimate Parent Entity (UPE) and may be liable, where applicable, for additional tax in relation to its low-tax subsidiaries. In line with this reform, some countries in which the Group operates have increased local taxes. For the financial year ended 31 December 2024, an additional income tax expense was assessed and included in income tax (see Note 5.2).
Under the 22nd resolution of the Shareholders’ Meeting of 11 June 2024, Rubis SCA implemented a share buyback programme intended to reduce the share capital by cancelling the shares bought back. At 1 November 2024, 1,000,000 ordinary shares were repurchased by Rubis SCA for an amount of €25,027 thousand representing a nominal value of €1,250 thousand and the difference of €23,777 thousand between the net repurchase price of the shares, including costs, and their nominal value. Subsequently, the Management Board reduced the share capital by cancelling these 1,000,000 ordinary shares held by the Company.
The financial statements as of 31 December 2024 have been prepared and presented in accordance with the accounting policies, standards and methods in force in France pursuant to the provisions of the general chart of accounts (ANC Regulation 2014-03 on the PCG).
The accounting conventions for the preparation and presentation of the separate financial statements were applied in accordance with the principle of prudence, and the following basic assumptions:
- going concern;
- consistency of accounting policies from one financial year to the next;
- independence of financial years.
Acquisition cost includes the purchase price, as well as all costs directly attributable to the acquisition of the fixed assets in question. Acquisition expenses (transfer taxes, fees, etc.) are recognised directly as expenses.
Depreciation is calculated according to the pattern of consumption of the economic benefits expected from the asset. In this respect, depreciation is calculated according to the straight-line method as follows:
When a fixed asset is intended to be sold, or when it no longer has potential, it is tested only at its level. In this case, when its net carrying amount is significantly higher than its estimated present value, the net carrying amount of the fixed asset is immediately impaired to its present value.
Equity interests are recorded at their acquisition cost or contribution value. The Company has opted for the recognition of acquisition expenses in the cost price of equity interests.
At the end of the year, investments are estimated at their value in use, determined on the basis of a multi-criteria analysis taking into account, in particular, the share of the subsidiary’s equity that said securities represent, forecasts of future cash flows or market value. If their value in use is lower than their carrying amount, an impairment is recognised in net finance income (expense).
Shares are recognised at purchase cost, which includes any acquisition expenses. In the event of disposal, the cost price of the shares sold is determined using the “First In – First Out” (FIFO) method.
Receivables are impaired when the present value, determined with regard to the risk of non-recovery, is lower than the carrying amount.
Investment securities are recognised at their acquisition cost. When securities of the same type conferring the same rights are transferred, the cost price of the securities transferred is determined according to the “First In – First Out” (FIFO) method.
At the end of each financial year, a provision for impairment is recognised if the carrying amount is higher than:
- their market value for listed securities or units of UCITS;
- their probable realisable value for negotiable debt securities.
The only pension commitments borne by the Company are employee retirement benefits, as legislation stipulates that benefits are paid to employees at the time of their retirement, depending on their length of service and their salary at retirement age. These retirement benefits are recognised as off-balance sheet commitments (see note 6.2.1).
Pursuant to the amendment to ANC recommendation 2013-02 of 7 November 2013, amended on 5 November 2021, the Company decided to adopt the new method for allocating entitlements to its defined-benefit plans under which an indemnity is due only if the employee is present at the date of his/her retirement, the amount of which depends on seniority and is capped at a certain number of consecutive years of service. The impact of this change in accounting policy is a non-material decrease in the amount of the pension obligation.
The evaluation of the amount of retirement benefits in respect of Rubis SCA employees was determined using the projected unit credit method.
Provisions for contingencies and expenses are recognised when there is an obligation to a third party and it is probable that this obligation will result in an outflow of resources, estimated with sufficient reliability, to the third party without at least equivalent consideration being received from the third party.
Contingent liabilities are not recognised but are disclosed in the notes to the financial statements unless the probability of an outflow of resources is very low.
Rubis SCA is the head of the tax consolidation group that it forms with its subsidiaries in France. Subsidiaries in the tax consolidation scope contribute to the tax expense of the consolidation group in the amount of tax they would have been liable for in the absence of consolidation. The additional income tax savings or expense, resulting from the difference between the tax due by the consolidated subsidiaries and the tax resulting from the determination of the overall result, is recorded by the Rubis SCA Group parent company.
Extraordinary income and expenses include the impact of major events that are not related to the Company’s current activity or that correspond to unusual, significant, and infrequent items.
As of 31 December 2024, Rubis SCA (SIREN: 784 393 530) is the parent company for the preparation of the consolidated financial statements of the Rubis Group.
The decrease in equity investments is explained by the disposal of the 55% stake in Rubis Terminal (see note 2).
The Shareholders’ Meeting authorises the Management Board annually, with the option to delegate such powers, to buy back the Company’s own shares in order to increase the liquidity or market activity of Rubis shares as part of a liquidity agreement, in compliance with the Association Française des Entreprises d’Investissement (French Association of Investment Companies) Code of Ethics.
As of 31 December 2024, Rubis SCA held 85,679 Rubis shares, representing a purchase price of €2,153 thousand. No impairment was recognised as of 31 December 2024.
As of 31 December 2024, the investment securities portfolio had both a gross and net carrying amount of €119,462 thousand:
(in thousands of euros) Gross value as
of 31/12/2024Impairment Net value as of
31/12/2024Market
value as of
31/12/2024*
Net value as
of 31/12/2023UCITS 44,793 44,793 45,979 56,520 Other funds 73,786 73,786 79,067 116,675 Interest receivable on other funds 883 883 883 1,833 TOTAL 119,462 119,462 125,929 175,028 - €521,511 thousand in intra-group receivables;
- €20,126 thousand in receivables from the French Treasury. This item includes in particular a tax settlement of €7,570 thousand that Rubis SCA expects to obtain from the tax authorities, €4,555 thousand in receivables related to the tax consolidation and €7,286 thousand relating to VAT repayment;
- a €261,054 thousand receivable, the balance of the disposal price of 55% of the Rubis Terminal JV in October 2024;
- €338 thousand (net of impairment) in miscellaneous receivables.
Trade and other receivables are all due within one year, with the exception of the receivable relating to the balance of the disposal price of the Rubis Terminal JV, for which the portion over one year is €173,957 thousand.
(in thousands of euros) 31/12/2024 31/12/2023 Equity at the beginning of the financial year 2,121,969 2,104,286 Capital increase (decrease) 11 302 Increase (decrease) in share premium (16,207) 3,793 Dividend payment (282,285) (197,524) Profit (loss) for the period 301,261 211,111 Equity at the end of the financial year* 2,124,750 2,121,969 As of 31 December 2024, the share capital consisted of 103,204,251 fully paid-up shares, with a par value of €1.25 each, i.e., a total amount of €129,005 thousand.
In accordance with the authorisation granted by the Ordinary Shareholders’ Meeting of 11 June 2024 (22nd resolution), the Management Board decided in 2024 to cancel all 1,000,000 shares that were acquired under the share buyback programme launched on 7 October 2024. The related capital reduction was carried out with effect from 12 November 2024.
Number of shares Share capital
(in thousands of euros)Share premium
(in thousands of euros)As of 1 January 2024 103,195,172 128,994 1,553,914 Exercise of stock options 1,995 2 57 Company savings plan 559,881 700 8,096 Performance shares vested 447,203 559 (559) Capital decrease by cancelling shares bought back (1,000,000) (1,250) (23,777) Capital increase expenses (23) AS OF 31 DECEMBER 2024 103,204,251 129,005 1,537,708 In November 2021, the Group signed an equity line agreement with Crédit Agricole CIB for a period of 37 months and up to the authorised limit of 4,400,000 shares with a par value of €1.25. As of 31 December 2024, this agreement expired without any usage by the Group.
The terms of the stock option and bonus performance shares outstanding as of 31 December 2024 are set out in the tables below:
Bonus performance shares
Date of Management BoardOutstanding as
of 31/12/2023Rights
issuedRights
exercisedRights
cancelledOutstanding as
of 31/12/20246 November 2020 769,645 (379,318) (390,327) 1 April 2021 43,516 (21,756) (21,760) 13 December 2021 115,323 (46,129) 69,194 20 July 2022 514,770 514,770 TOTAL 1,443,254 (447,203) (412,087) 583,964 The definitive grant of the shares to the beneficiaries may only take place at the end of a vesting period, which is generally three years, running from their grant by the Management Board. The conditions for awarding shares free of charge are set by the Management Board.
Expenses payable totalled €6,709 thousand, breaking down as €1,766 thousand relating to suppliers, €169 thousand to accrued interest and €4,686 thousand to taxes and social security payables. These expenses payable are operating expenses and financial expenses.
Trade payables recognised on the balance sheet, totalling €3,319 thousand, are all due in less than three months. All other liabilities recognised on the balance sheet are due in less than one year.
All transactions with related parties concern transactions carried out with subsidiaries wholly-owned by Rubis SCA and are concluded under arm’s length conditions.
The extraordinary items presented below mainly consist of the €60,410 thousand capital gain realised on the disposal of the 55% stake in Rubis Terminal (see note 2).
(in thousands of euros) Tax base Rate Gross tax Credit Net tax Corporation tax on profit (loss) from ordinary activities at the standard rate 26,576 25.83% 6,838 (806) 6,032 Corporation tax calculated on expenses related to capital increases allocated to share premiums 30 25.83% 8 8 Tax expense (income) relating to tax consolidation (19,446) (19,446) Miscellaneous (including Pillar 2, etc.) 4,746 4,746 TOTAL (7,854) (806) (8,660) Rubis SCA is taxed under the system for parent companies and subsidiaries. Eligible dividends are subject to taxation on a share of fees and expenses amounting to 1% or 5%.
Rubis SCA has opted for the tax consolidation regime since 1 January 2001. The scope of consolidation is as follows:
1 January 2001 Rubis 1 January 2006 Rubis Énergie Rubis Antilles Guyane SIGL Sicogaz Starogaz 1 January 2011 Frangaz Vito Corse 1 January 2012 Société Antillaise des Pétroles Rubis (SAPR) Rubis Guyane Française (RGF) Rubis Caraïbes Françaises (RCF) 1 January 2013 Coparef Vitogaz France 1 January 2014 Rubis Restauration et Services (RRS) 1 January 2016 Société Réunionnaise de Produits Pétroliers (SRPP) 1 January 2018 Rubis Patrimoine 1 January 2019 Rubis Renouvelables 1 January 2023 Rubis Saint-Barthélemy Rubis Hydev - tax expenses are paid by the companies as if there were no tax consolidation;
- tax savings made by the Group are recognised in the income statement by the parent company;
- tax savings are not reallocated to subsidiaries, except in the event of an exit from the Group.
Retirement benefits vested for Rubis SCA employees totalled €474 thousand, including social security contributions. The evaluation method is described in note 3.7.
In December 2021, the French Competition Authority launched an investigation into practices in the fuel supply, storage and distribution sector. At the end of 2023, the French Competition Authority’s investigation department sent several players in the French oil industry – including two Group entities – a notification of grievances relating to alleged practices in this sector. Receipt of this document in no way prejudges any future conviction. During the financial year 2024, the Group made representations, and fully and firmly contested the merits of the current proceedings. The meeting before the Board of the Competition authority took place at the end of 2024. As of 31 December 2024, no provision has been made, as the Management Board considers that the criteria for recognising a provision are not met under current accounting standards.
The fixed compensation of the Management Board is governed by Article 54 of the by-laws. For the financial year 2024, it totalled €2,624 thousand.
The Ordinary Shareholders’ Meeting of 11 June 2024 (15th resolution) approved the compensation policy for the Management Board for the 2024 financial year. This included an annual variable portion, the terms of which are described in chapter 5 of the 2023 Universal Registration Document. The annual variable compensation of the Management Board for the financial year 2024 was the subject of a provision of €475 thousand.
Compensation paid to members of the Supervisory Board for the financial year 2024 totalled €316 thousand.
(in thousands of euros) Rubis
Énergie SASKelsey* Coparef SA Rubis
Patrimoine SARLRubis
RenouvelablesShare capital 335,000 1 40 1,402 39,216 Equity other than share capital 505,380 227 (28) (871) 278,412 Government grants and regulated provisions 18,218 Share of capital held 100.00% 100.00% 100.00% 100.00% 100.00% Gross carrying amount of the securities held 685,503 4 34 23,911 392,115 Net carrying amount of the securities held 685,503 4 34 23,911 392,115 Loans and advances from Rubis SCA not repaid 353,951 51 3,212 151,654 Revenue for the last financial year ended 232,921 1,853 896 Net income for the last financial year ended 245,218 79 (4) (108) (24,410) Dividends received by Rubis SCA during the financial year 227,800 * The Company’s financial statements are kept in US dollars. The following exchange rates were used: (in thousands of euros) Net value as of
31/12/2024I – Shares and interests French equity interests Coparef 34 Rubis Énergie 685,503 Rubis Patrimoine 23,911 Rubis Renouvelables 392,115 Foreign equity interests Kelsey 4 TOTAL EQUITY INTERESTS 1,101,567 II – UCITS and similar UCITS SICAV BNP PAR Money 3M 246 SICAV SG Monétaire Plus Part I 17,294 RMM Rothschild MM 27,253 Other Agipi fund 21,267 Open Capital fund 15,622 HR Patrimoine Capitalisation fund 26,536 Open Perspectives Capitalisation fund 11,243 TOTAL UCITS AND SIMILAR 119,461 -
7.3 Other information relating to the separate financial statements
7.3.1 Financial results of Rubis SCA over the last five financial years
(in thousands of euros) 2020 2021 2022 2023 2024 Financial position at the financial year-end Share capital 129,538 128,177 128,692 128,994 129,005 Number of shares issued 103,630,677 102,541,281 102,953,566 103,195,172 103,204,251 Comprehensive income from transactions carried out Revenue excluding tax 7,496 2,972 12,461 4,958 7,588 Earnings before tax, depreciation and provisions 324,540 141,930 187,295 196,282 292,730 Income tax 14,211 11,507 1,096 14,795 8,660 Earnings after tax, depreciation and provisions 336,674 154,649 187,183 211,111 301,261 Earnings distributed to partners 181,715 191,061 197,524 204,979 298,089* Earnings per share (in euros) Earnings after tax but before depreciation and provisions 3.27 1.50 1.83 2.05 2.92 Earnings after tax, depreciation and provisions 3.25 1.51 1.82 2.05 2.92 Dividend awarded to each share 1.80 1.86 1.92 1.98 2.78* Personnel Number of employees 22 21 22 23 26 Total payroll 3,488 3,037 3,359 4,888 6,439 Amount paid in respect of employee benefits 1,933 1,759 1,796 2,317 3,450 -
7.4 Statutory Auditors’ reports
7.4.1 Statutory Auditors’ report on the consolidated financial statements
This is a free translation into English of the Statutory Auditors’ report issued in French and is provided solely for the convenience of English-speaking readers. This report includes information specifically required by European regulations or French law, such as information about the appointment of Statutory Auditors. This report should be read in conjunction with, and construed in accordance with, French law and professional auditing standards applicable in France.
In compliance with the engagement entrusted to us by your Annual General Meeting, we have audited the accompanying consolidated financial statements of Rubis for the year ended December 31, 2024.
In our opinion, the consolidated financial statements give a true and fair view of the assets and liabilities and of the financial position of the Group as at December 31, 2024 and of the results of its operations for the year then ended in accordance with International Financial Reporting Standards as adopted by the European union.
We conducted our audit in accordance with professional standards applicable in France. We believe that the audit evidence we have obtained is sufficient and appropriate to provide a basis for our opinion.
Our responsibilities under those standards are further described in the “Statutory Auditors’ Responsibilities for the Audit of the Consolidated Financial Statements” section of our report.
We conducted our audit engagement in compliance with independence requirements of the French Commercial Code (code de commerce) and the French Code of Ethics (code de déontologie) for statutory auditors, for the period from January 1, 2024 to the date of our report and specifically we did not provide any prohibited non-audit services referred to in Article 5(1) of Regulation (EU) No 537/2014.
In accordance with the requirements of Articles L.821-53 and R.821-180 of the French Commercial Code (code de commerce) relating to the justification of our assessments, we inform you of the key audit matters relating to risks of material misstatement that, in our professional judgment, were of most significance in our audit of the consolidated financial statements of the current period, as well as how we addressed those risks.
These matters were addressed in the context of our audit of the consolidated financial statements as a whole and in forming our opinion thereon, and we do not provide a separate opinion on specific items of the consolidated financial statements.
Description of risk How our audit addressed this risk As of December 31, 2024, the carrying amount of goodwill totaled €1,763.4 million.
The Group tests goodwill for impairment at least once a year, and more frequently if there are indications of impairment.
An impairment loss is recognized when the recoverable amount is less than the carrying amount, the recoverable amount corresponding to the higher of value in use, determined on the basis of discounted expected future cash flows, and fair value less costs of disposal (as described in Note 4.2 “Goodwill” to the consolidated financial statements).
We considered the measurement of the recoverable amount of goodwill to be a key audit matter because of the significant value of goodwill on the balance sheet and the high degree of judgment exercised by management in determining future cash flow projections and key assumptions.
We examined the methods used by Rubis to carry out impairment tests in accordance with current accounting standards.
We assessed the process used by management to develop the cash flow projections used to determine the value in use. With the assistance of our valuation experts, we reviewed the mathematical models used and verified the correct calculation of these models. We assessed the reasonableness of the main estimates, and in particular:
• The consistency of the projected future cash flows with management’s business plans.
For the cash generating units (CGU) or group of CGU relating to the Energy Distribution activity, we also compared management’s forecasts with past performance and the market outlook, in conjunction with our own analyses;
For the CGU relating to the Production of photovoltaic electricity, we assessed the development plan for the portfolio of future projects in light of past achievements and the different stages of progress of the portfolio of projects identified. We also examined the assumptions used for future electricity sale prices.
• The discount rates applied to future cash flows, by comparing their inputs with external references, with the assistance of our valuation experts.
We reviewed the sensitivity analyses performed by management and performed our own sensitivity calculations on the key assumptions to assess the potential impact of these assumptions on the conclusions of the impairment tests.
We also assessed the appropriateness of the disclosures provided in Note 4.2 “Goodwill” to the consolidated financial statements.
We have also performed, in accordance with professional standards applicable in France, the specific verifications required by laws and regulations of the Group’s information given in the management report of Managing Board.
We have no matters to report as to their fair presentation and their consistency with the consolidated financial statements.
FORMAT OF PRESENTATION OF THE CONSOLIDATED FINANCIAL STATEMENTS INTENDED TO BE INCLUDED14 IN THE ANNUAL FINANCIAL REPORT
We have also verified, in accordance with the professional standard applicable in France relating to the procedures performed by the statutory auditor relating to the annual and consolidated financial statements presented in the European single electronic format, that the presentation of the consolidated financial statements intended to be included in the annual financial report mentioned in Article L.451-1-2, I of the French Monetary and Financial Code (code monétaire et financier), prepared under the responsibility of the Management Board, complies with the single electronic format defined in the European Delegated Regulation No 2019/815 of 17 December 2018. As it relates to consolidated financial statements, our work includes verifying that the tagging of these consolidated financial statements complies with the format defined in the above delegated regulation.
Based on the work we have performed, we conclude that the presentation of the consolidated financial statements intended to be included in the annual financial report complies, in all material respects, with the European single electronic format.
We have no responsibility to verify that the consolidated financial statements that will ultimately be included by your company in the annual financial report filed with the AMF are in agreement with those on which we have performed our work.
We were appointed Statutory Auditors of Rubis by the Annual General Meetings held on June 11, 2020 for PricewaterhouseCoopers Audit and on June 9, 2022 for KPMG SA.
At December 31, 2024, PricewaterhouseCoopers Audit and KPMG SA were in the fifth and third consecutive year of their engagement, respectively.
Responsibilities of Management and Those Charged with Governance for the Consolidated Financial Statements
Management is responsible for the preparation and fair presentation of the consolidated financial statements in accordance with International Financial Reporting Standards as adopted by the European Union and for such internal control as management determines is necessary to enable the preparation of consolidated financial statements that are free from material misstatement, whether due to fraud or error.
In preparing the consolidated financial statements, management is responsible for assessing the Company’s ability to continue as a going concern, disclosing, as applicable, matters related to going concern and using the going concern basis of accounting unless it is expected to liquidate the Company or to cease operations.
The Audit and CSR Committee is responsible for monitoring the financial reporting process and the effectiveness of internal control and risks management systems and where applicable, its internal audit, regarding the accounting and financial reporting procedures.
Our role is to issue a report on the consolidated financial statements. Our objective is to obtain reasonable assurance about whether the consolidated financial statements as a whole are free from material misstatement. Reasonable assurance is a high level of assurance, but is not a guarantee that an audit conducted in accordance with professional standards will always detect a material misstatement when it exists. Misstatements can arise from fraud or error and are considered material if, individually or in the aggregate, they could reasonably be expected to influence the economic decisions of users taken on the basis of these consolidated financial statements.
As specified in Article L.821-55 of the French Commercial Code (code de commerce), our statutory audit does not include assurance on the viability of the Company or the quality of management of the affairs of the Company.
As part of an audit conducted in accordance with professional standards applicable in France, the statutory auditor exercises professional judgment throughout the audit and furthermore:
- Identifies and assesses the risks of material misstatement of the consolidated financial statements, whether due to fraud or error, designs and performs audit procedures responsive to those risks, and obtains audit evidence considered to be sufficient and appropriate to provide a basis for his opinion. The risk of not detecting a material misstatement resulting from fraud is higher than for one resulting from error, as fraud may involve collusion, forgery, intentional omissions, misrepresentations, or the override of internal control.
- Obtains an understanding of internal control relevant to the audit in order to design audit procedures that are appropriate in the circumstances, but not for the purpose of expressing an opinion on the effectiveness of the internal control.
- Evaluates the appropriateness of accounting policies used and the reasonableness of accounting estimates and related disclosures made by management in the consolidated financial statements.
- Assesses the appropriateness of management’s use of the going concern basis of accounting and, based on the audit evidence obtained, whether a material uncertainty exists related to events or conditions that may cast significant doubt on the Company’s ability to continue as a going concern. This assessment is based on the audit evidence obtained up to the date of his audit report. However, future events or conditions may cause the Company to cease to continue as a going concern. If the statutory auditor concludes that a material uncertainty exists, there is a requirement to draw attention in the audit report to the related disclosures in the consolidated financial statements or, if such disclosures are not provided or inadequate, to modify the opinion expressed therein.
- Evaluates the overall presentation of the consolidated financial statements and assesses whether these statements represent the underlying transactions and events in a manner that achieves fair presentation.
- Obtains sufficient appropriate audit evidence regarding the financial information of the entities or business activities within the Group to express an opinion on the consolidated financial statements. The statutory auditor is responsible for the direction, supervision and performance of the audit of the consolidated financial statements and for the opinion expressed on these consolidated financial statements.
We submit a report to the Audit and CSR Committee which includes in particular a description of the scope of the audit and the audit program implemented, as well as the results of our audit. We also report, if any, significant deficiencies in internal control regarding the accounting and financial reporting procedures that we have identified.
Our report to the Audit and CSR Committee includes the risks of material misstatement that, in our professional judgment, were of most significance in the audit of the consolidated financial statements of the current period and which are therefore the key audit matters that we are required to describe in this report.
We also provide the Audit and CSR Committee with the declaration provided for in Article 6 of Regulation (EU) N° 537/2014, confirming our independence within the meaning of the rules applicable in France such as they are set in particular by Articles L.821-27 to L.821-34 of the French Commercial Code (code de commerce) and in the French Code of Ethics (code de déontologie) for statutory auditors. Where appropriate, we discuss with the Audit and CSR Committee the risks that may reasonably be thought to bear on our independence, and the related safeguards.
-
8 ADDITIONAL INFORMATION
-
8.2 Incorporation by reference
In accordance with Article 19 of Regulation (EU) 2017/1129 of 14 June 2017, the following information is included by reference in this Universal Registration Document and is available on the Company’s website (https://www.rubis.fr/en/investors/results-and-presentations/):
- the consolidated and separate financial statements for the financial year ended 31 December 2023 and the related Statutory Auditors’ reports are included in the 2023 Universal Registration Document filed with the French Financial Markets Authority (Autorité des Marchés Financiers) on 29 April 2024, listed under No. D. 24-0351, on pages 258 to 333 and pages 334 to 340;
- the consolidated and separate financial statements for the financial year ended 31 December 2022 and the related Statutory Auditors’ reports are included in the 2022 Universal Registration Document filed with the French Financial Markets Authority (Autorité des Marchés Financiers) on 28 April 2023, listed under No. D. 23- 0372, on pages 232 to 304 and pages 305 to 311.
-
8.3 Cross-reference table for the Universal Registration Document
The cross-reference table below shows the headings provided for in Annexes I and II of Delegated Regulation (EU) 2019/980 of 14 March 2019 supplementing Regulation (EU) 2017/1129 of 14 June 2017 and provides references to the pages on which the relevant information appears in this Universal Registration Document.
Headings of Annexes I and II of Delegated Regulation (EU) 2019/980 of 14 March 2019 Chapter 1 Persons responsible, third-party information, experts’ reports and competent authority approval 1.1 Name and position of responsible officers 8.1 1.2 Declaration of responsible officers 8.1 1.3 Name, address, qualifications and material interests of persons acting as experts NA 1.4 Declaration relating to third-party information NA 1.5 Declaration of filing with the competent authority - 2 Statutory Auditors 8.1 3 Risk factors 3.1 4 Information about the issuer 4.1 Legal and commercial name 6.6 4.2 Place of registration, registration number and legal entity identifier (LEI) 6.6 4.3 Date of incorporation and duration 6.1.4 4.4 Domicile, legal form, applicable legislation, country of incorporation, address and telephone number of registered office, website 6.1 – 6.6 5 Business overview 5.1 Principal activities 1 5.2 Principal markets 1 5.3 Important events in the development of the business 2.1 to 2.2 – 7.1 5.4 Strategy and objectives 1 – 2.1 5.5 Dependence on patents or licenses, industrial, commercial or financial contracts, or new manufacturing processes NA 5.6 Competitive position 1 5.7 Investments 2.1 5.7.1 Main historical investments 2.1 – 7.1 5.7.2 Main ongoing investments 2.1 5.7.3 Joint ventures and undertakings in which the issuer holds a proportion of the capital likely to have a significant effect on the assessment of its own assets and liabilities, financial position or profits and losses 7.1 5.7.4 Environmental issues liable to affect the use of property, plant and equipment 4.2 6 Organisational structure 6.1 Brief description of the Group 1 6.2 List of significant subsidiaries 1 – 7.1 7 Operating and financial review 7.1 Financial condition 2.1 – 7.1 7.1.1 Review of the development and performance of the issuer’s business 7.3.1 7.2 Operating results 1 – 2.1 – 7.1 7.2.1 Information regarding material changes in net sales or revenues 2.1 7.2.2 Reasons for any material changes in net sales or revenues disclosed by historical financial information 2.1 – 3.1 8 Capital resources 8.1 Information on capital resources 7.1 8.2 Source, amount and description of cash flows 2.1 – 7.1 8.3 Information on borrowing requirements and funding structure 2.1 – 7.1 8.4 Restrictions on the use of capital resources that have or could have a material effect on the issuer’s operations NA 8.5 Anticipated sources of financing for the main capital expenditure projects and major expenses on the most significant property, plant and equipment 2.1 – 7.1 9 Regulatory environment 3.1.2.3 10 Trend information 2.2 11 Profit forecasts or estimates NA 12 Management and Supervisory bodies 12.1 Information on members of the Management and Supervisory bodies 5.2 – 5.3 12.2 Conflicts of interest, commitments relating to appointments, restrictions on the disposal of equity interests in the issuer’s share capital 5.5 13 Remuneration and benefits of the Management and Supervisory bodies 13.1 Remuneration paid and benefits in kind 5.4.4 13.2 Amounts set aside or accrued for pension, retirement or similar benefits 7.1 14 Practices of the Management and Supervisory bodies 14.1 Expiration date of current terms of office and periods served 5.3.1 14.2 Service contracts linking members of the Supervisory Board 5.5 14.3 Information on Committees 5.3.2 14.4 Statement of compliance with the corporate governance regime in effect 5.1 14.5 Potential material impacts on the corporate governance NA 15 Employees 15.1 Headcount 4.3.1 – 7.1 15.2 Shareholdings and stock options 6.2.2 – 6.4 – 6.5 – 7.1 15.3 Agreements providing for employee shareholding 6.4 – 7.1 16 Major shareholders 16.1 Shareholders holding more than 5% of share capital or voting rights 6.2.2 16.2 Voting rights of major shareholders exceeding their share of share capital NA 17 Related-party transactions 5.5 – 7.1 18 Financial information concerning the issuer’s assets and liabilities, financial position, and profits and losses 18.1 Historical financial information 7.3.1 18.2 Interim and other financial information NA 18.3 Audit of historical annual financial information 7.4 18.4 Proforma financial information NA 18.5 Dividend policy 6.3 18.6 Legal and arbitration proceedings 3.1.2.3 – 3.1.2.4 18.7 Significant change in the issuer’s financial position NA 19 Additional information 19.1 Share capital 6.2 – 7.2 19.1.1 Issued and authorised share capital 6.2 – 7.2 19.1.2 Shares not representing share capital NA 19.1.3 Shares held by the issuer or its subsidiaries 6.2.2 – 6.2.5 – 7.1 19.1.4 Securities giving future access to the issuer’s share capital 6.2.6 – 6.5.5 19.1.5 Terms of any acquisition rights and/or obligations over authorised but unissued capital or an undertaking to increase the capital 6.2.5 – 6.5 19.1.6 Capital of any member of the Group under option or subject to an agreement NA 19.1.7 History of the share capital of the issuer 6.2.7 – 7.3.1 19.2 Memorandum and Articles of Association 6.1.4 19.2.1 Corporate purpose of the issuer 6.1.4 19.2.2 Rights, preferences, and restrictions attached to each class of existing shares 6.1.4 19.2.3 By-law provisions, charter or rules of the issuer that may delay, defer or prevent a change of control NA 20 Material contracts (other than contracts agreed in the normal course of business) NA 21 Documents available 6.6 -
8.4 Cross-reference tables for the Annual Financial Report and the management report
8.4.1 Cross-reference table for the Annual Financial Report
In order to facilitate the reading of this Universal Registration Document, the cross-reference table below makes it possible to identify the information that makes up the Annual Financial Report to be published by listed companies in accordance with Articles L. 451-1-2 of the French Monetary and Financial Code and 222-3 of the General Regulation of the French Financial Markets Authority (Autorité des Marchés Financiers).
The Management Board presents the draft resolutions that are submitted for vote by the shareholders in a separate document (the Notice of Combined Shareholders’ Meeting to be held on 12 June 2025), as well as their presentation.
Chapter 2024 annual financial statements 7.2 2024 consolidated financial statements 7.1 Management report 8.4.2 Report on corporate governance, attached to the management report 5 – 6.1.4
6.2.4 – 8.4.2Sustainability Statement 4 Declaration of persons responsible for the Annual Financial Report 8.1 Statutory Auditors’ report on the annual financial statements 7.4.2 Statutory Auditors’ report on the consolidated financial statements 7.4.1

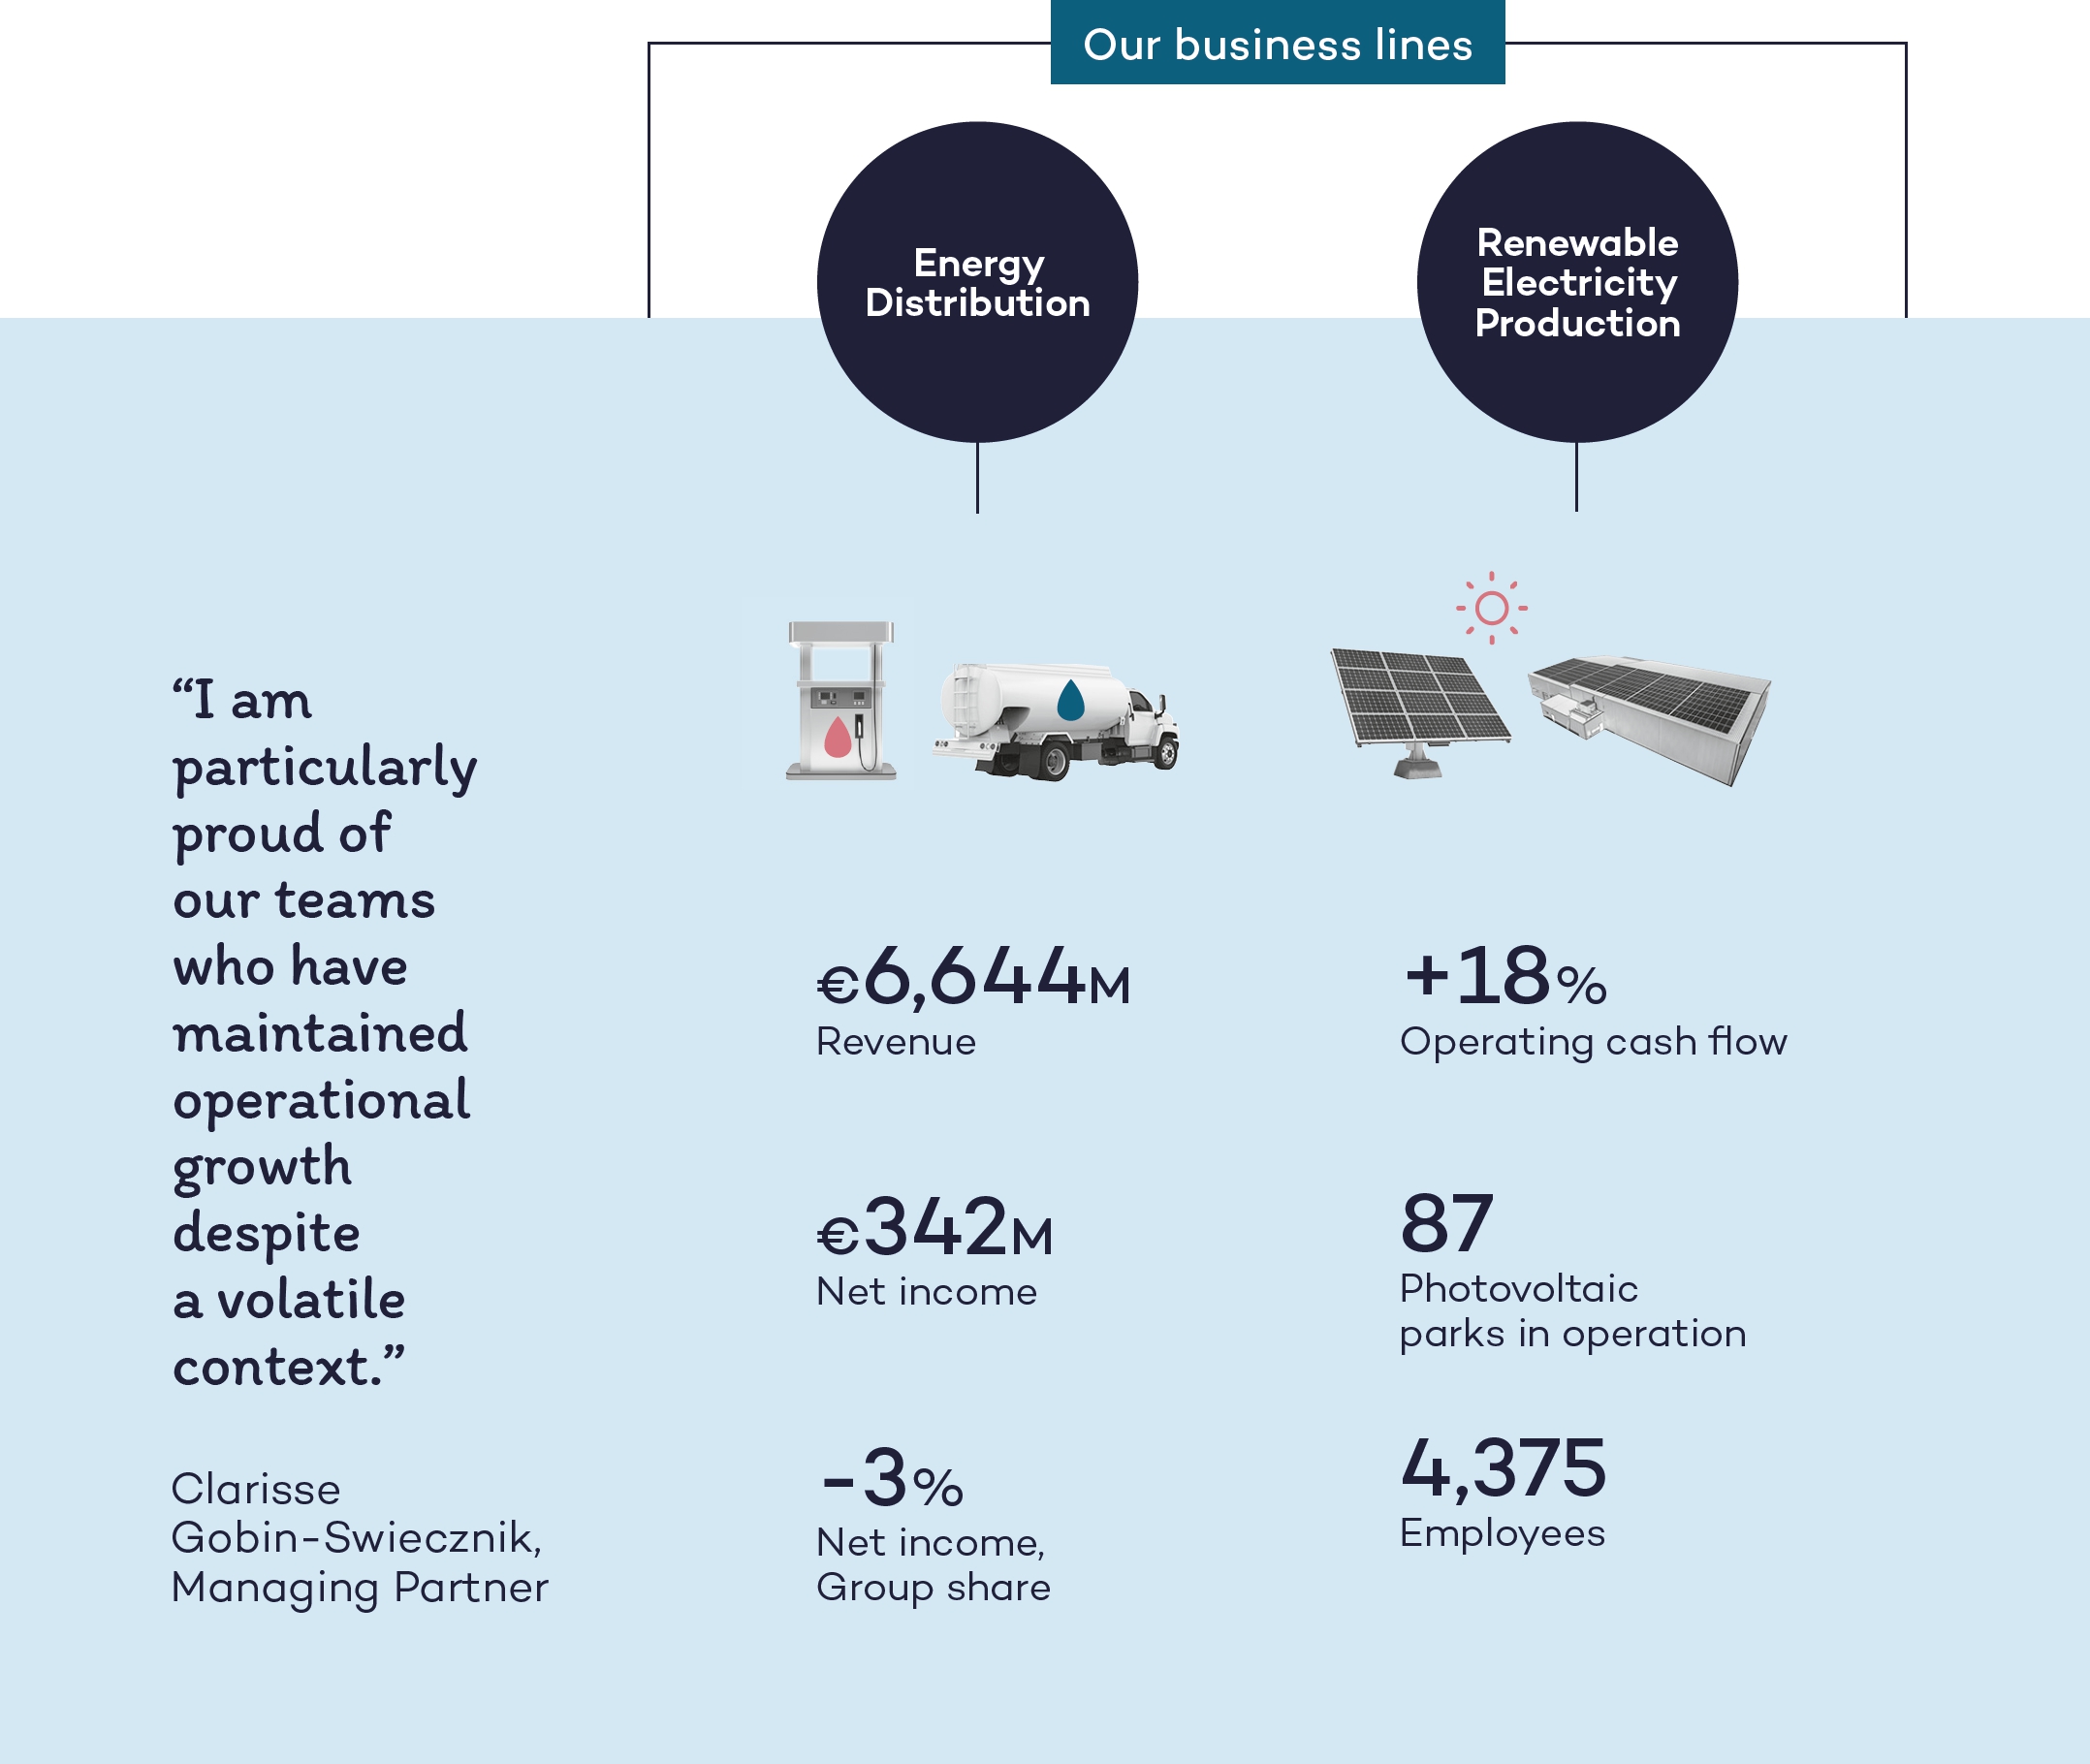
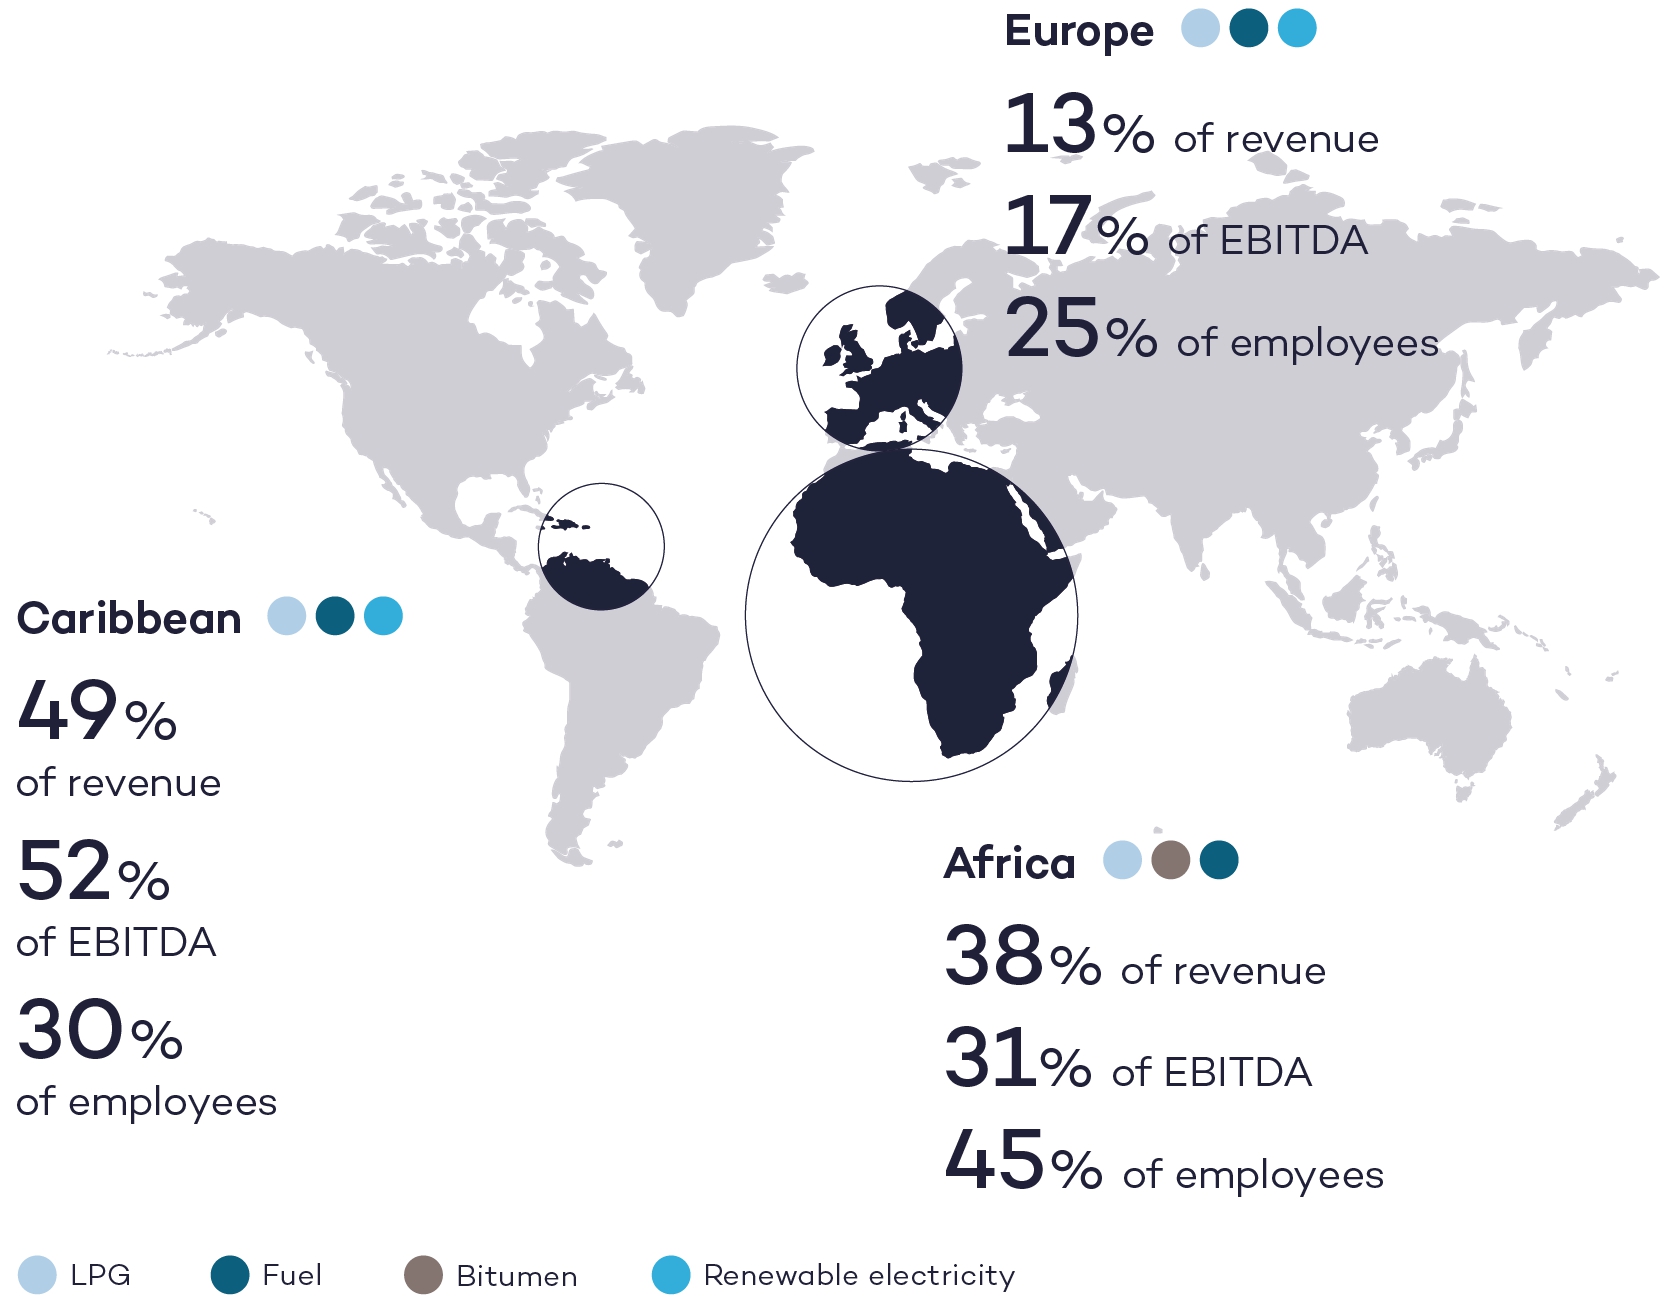
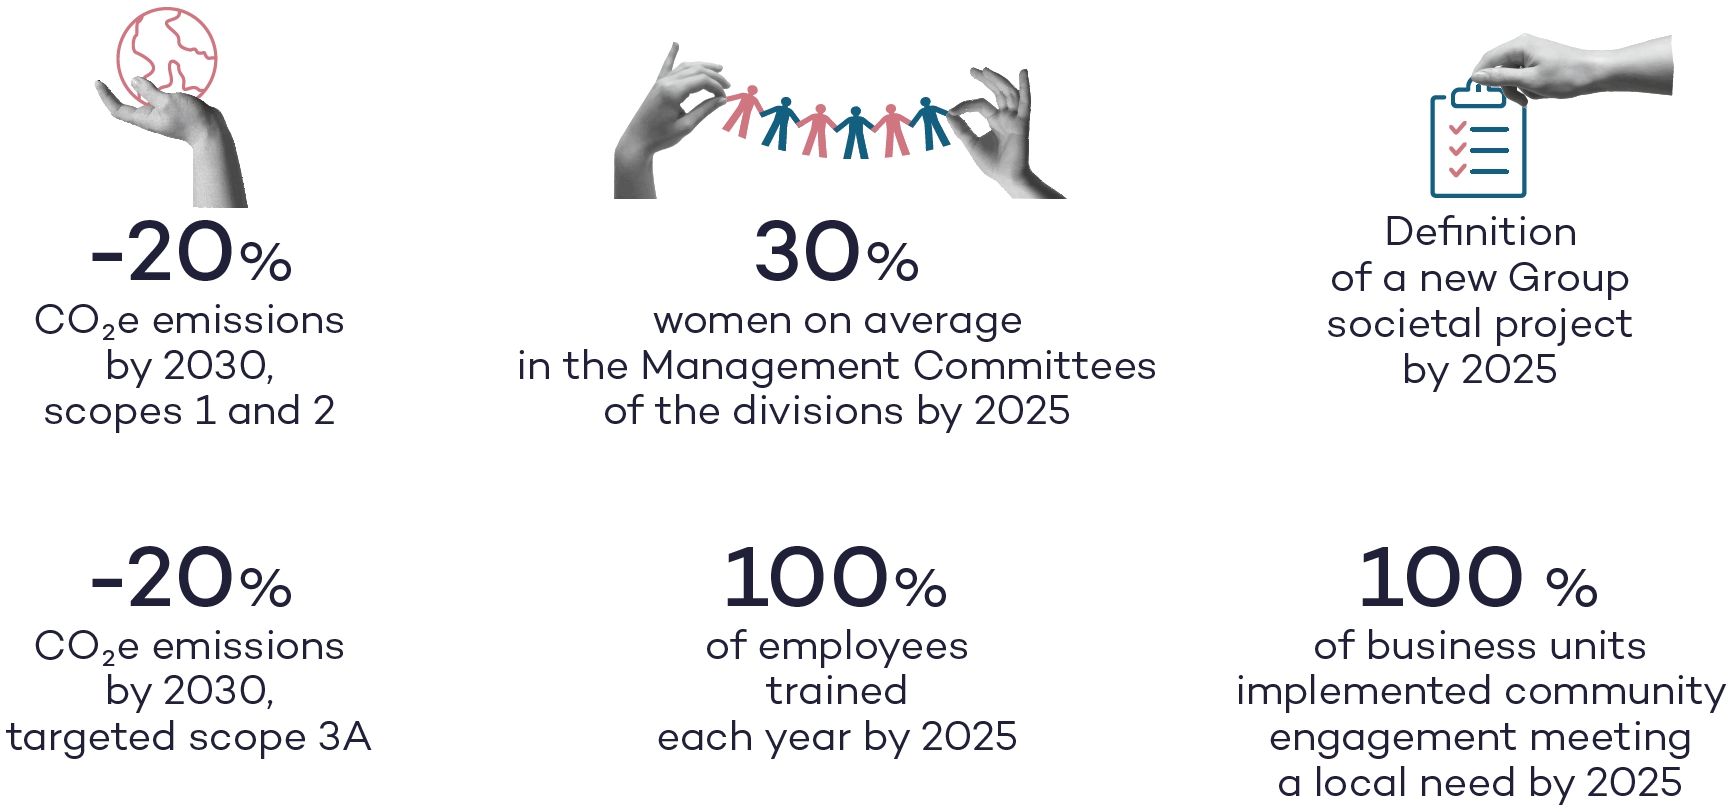

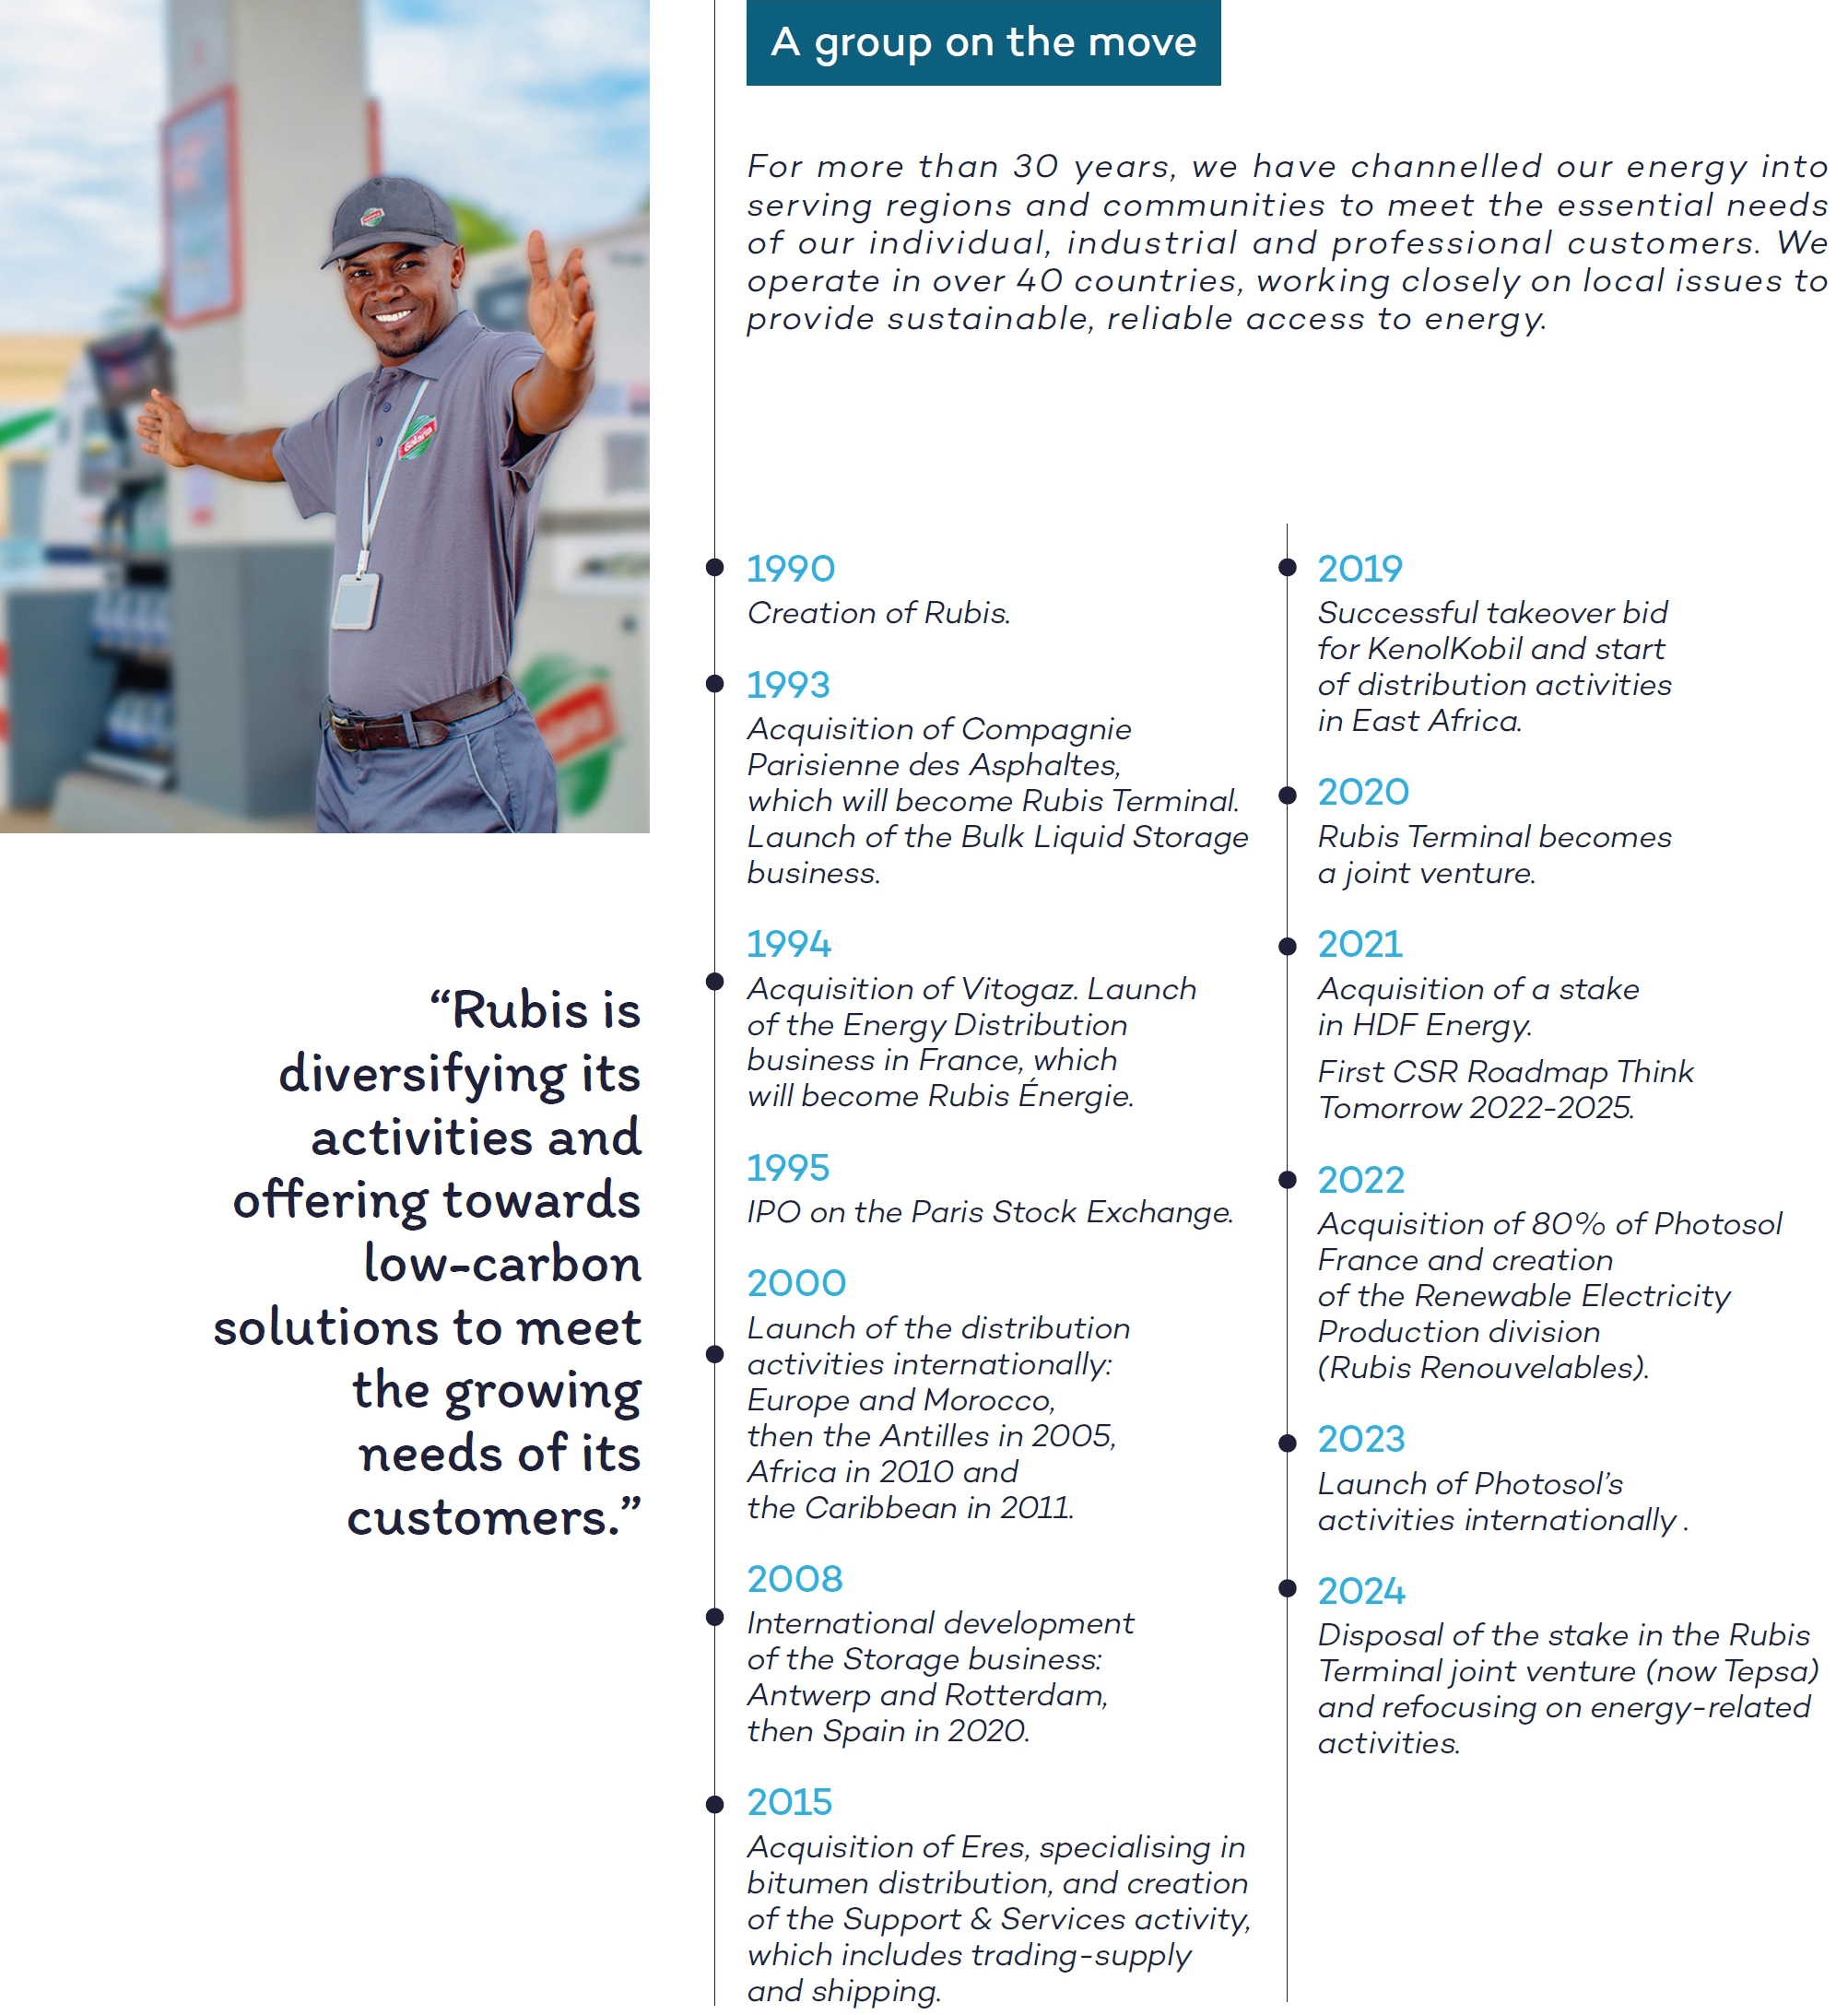


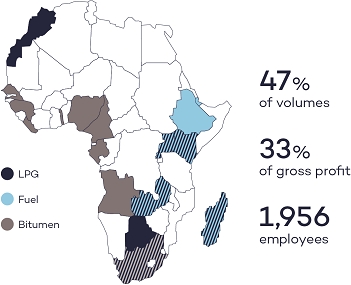
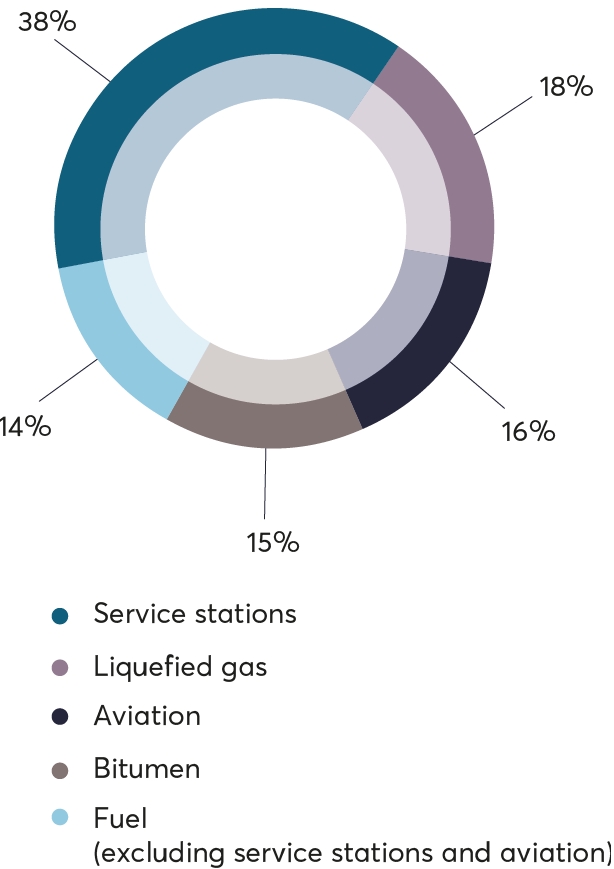

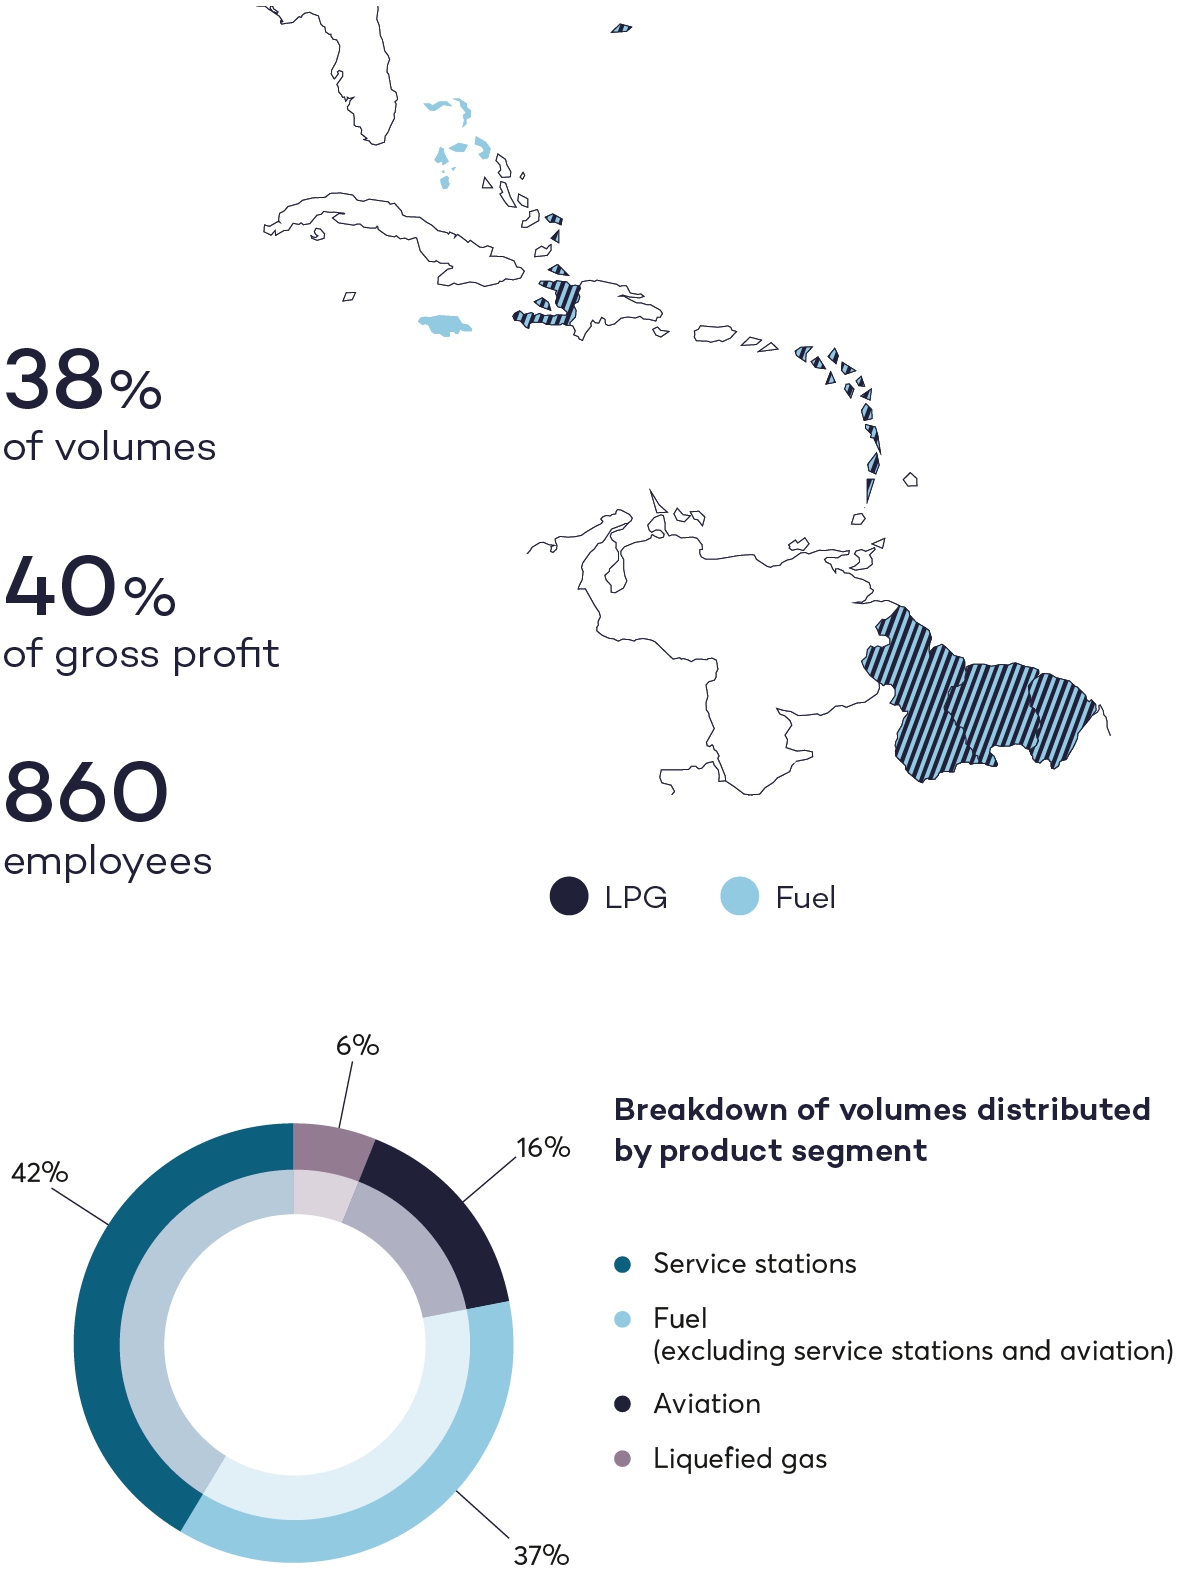
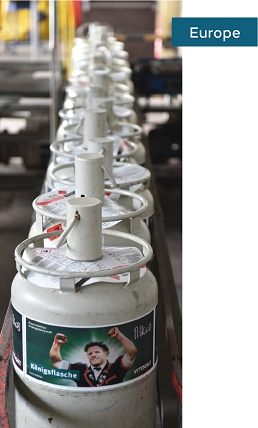
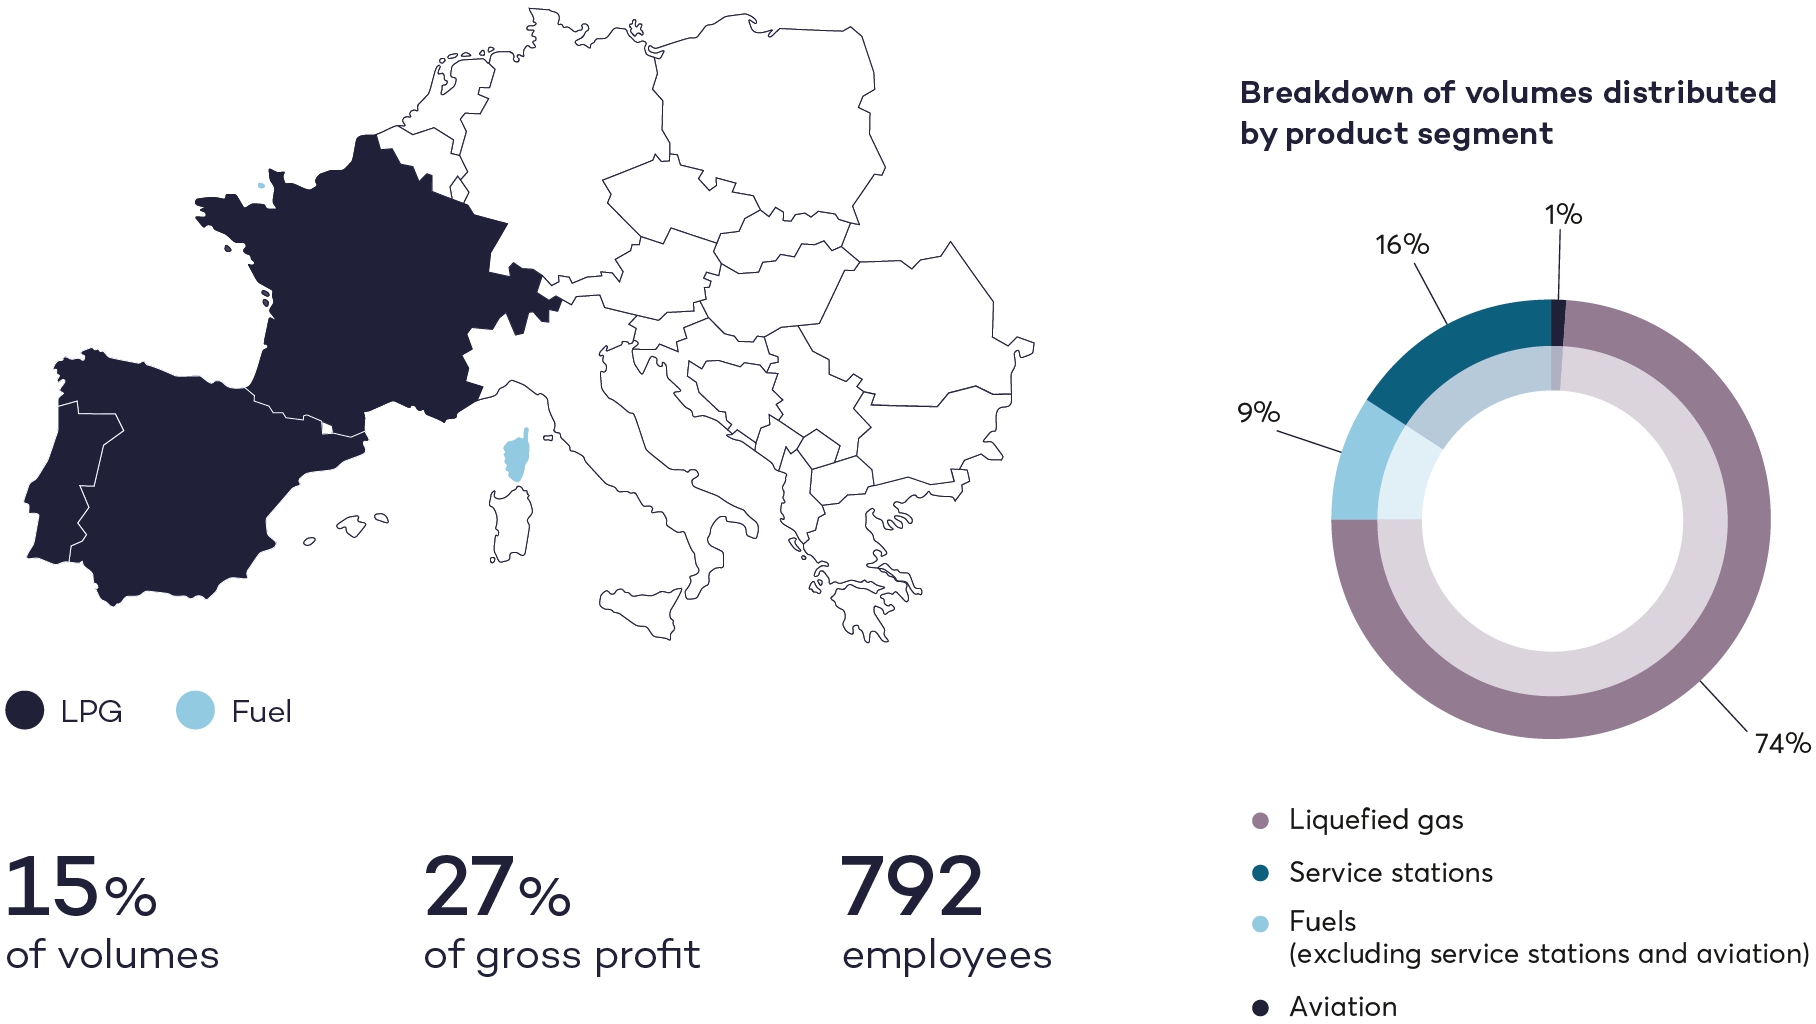
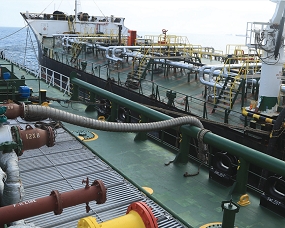

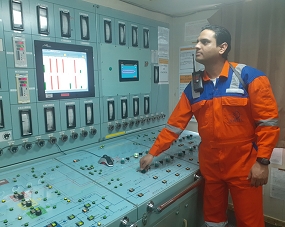
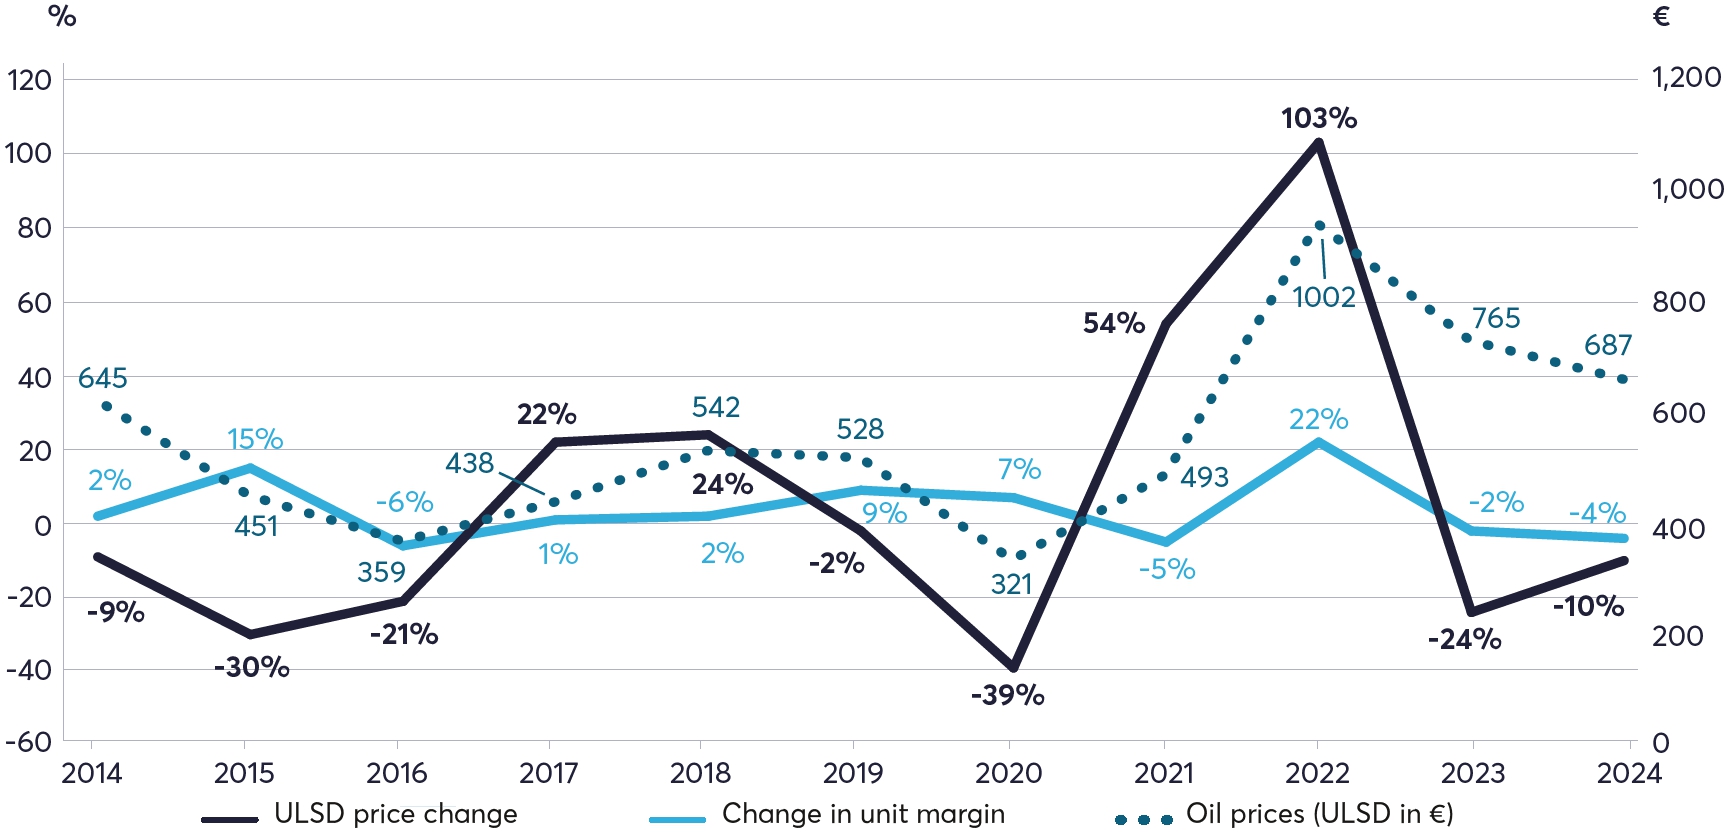

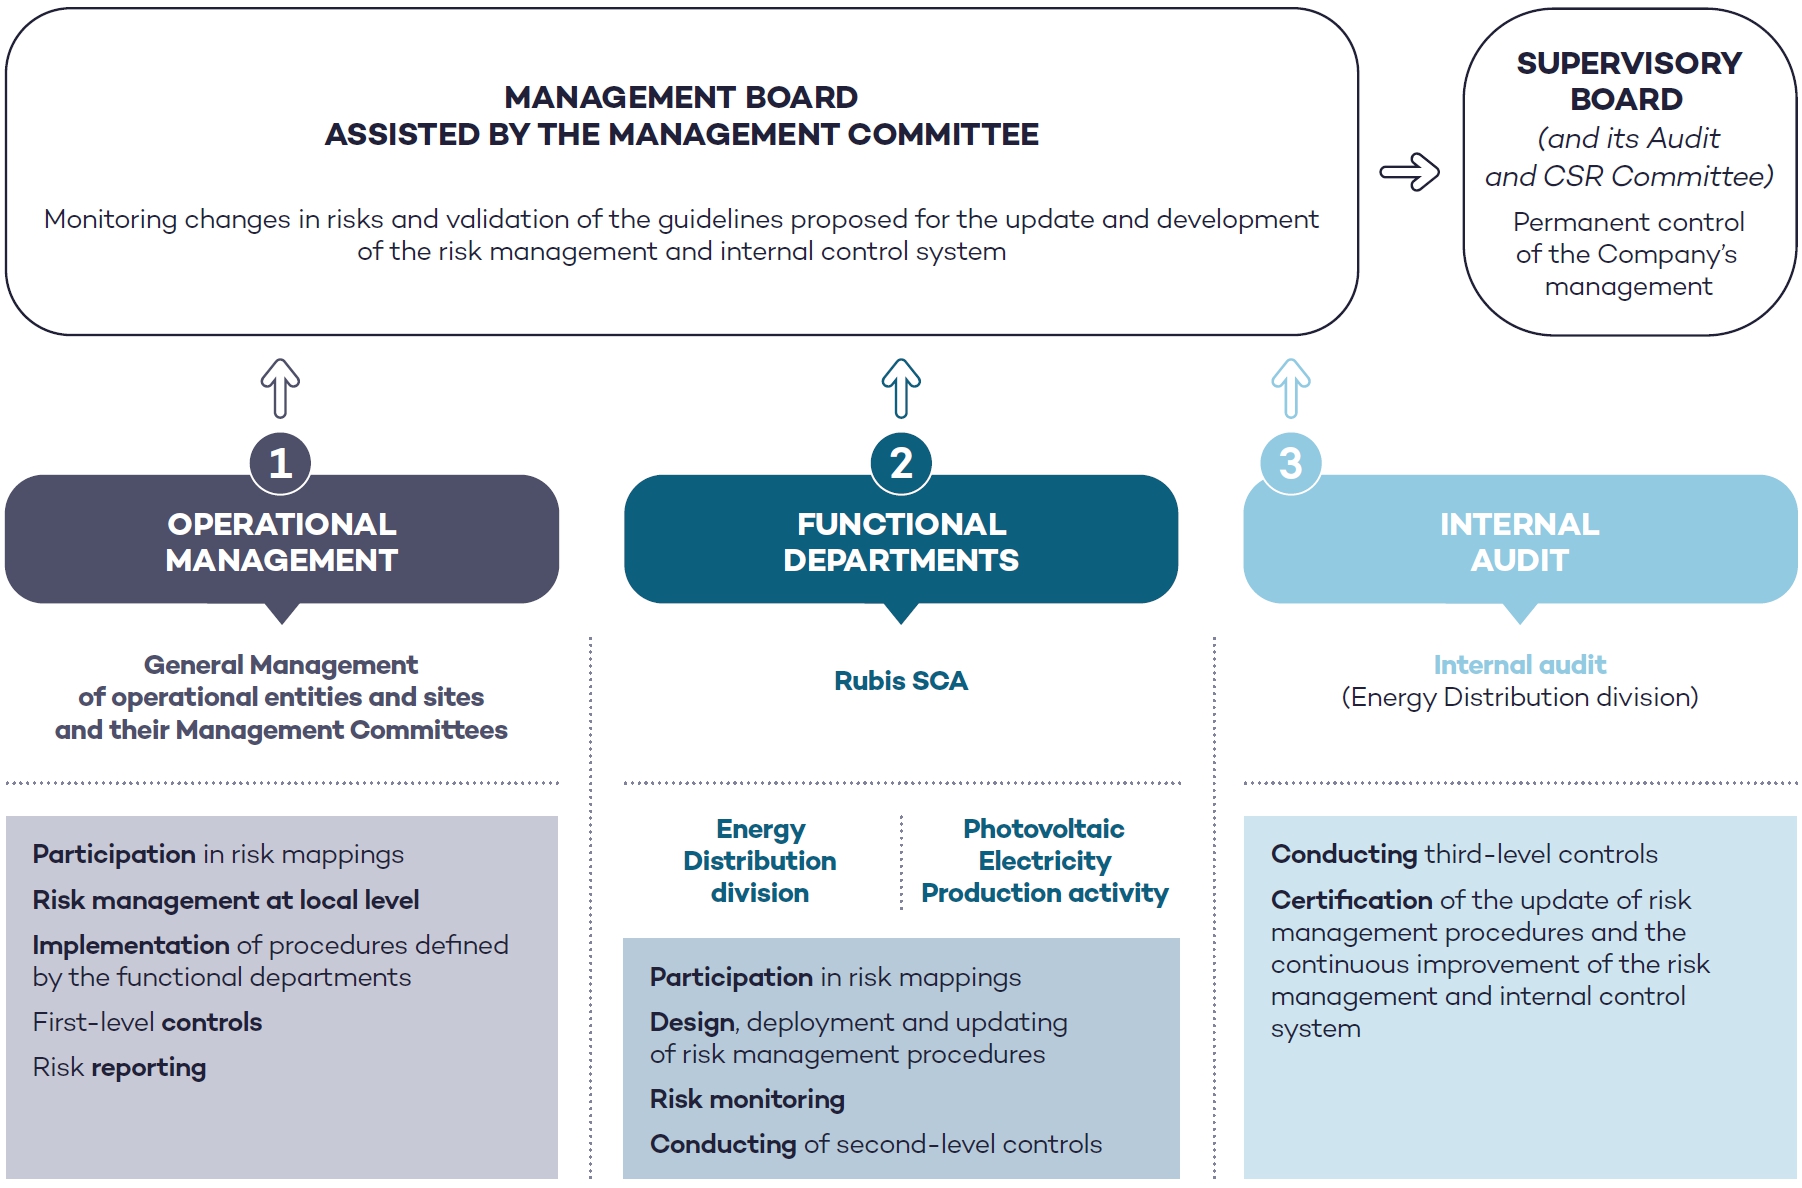
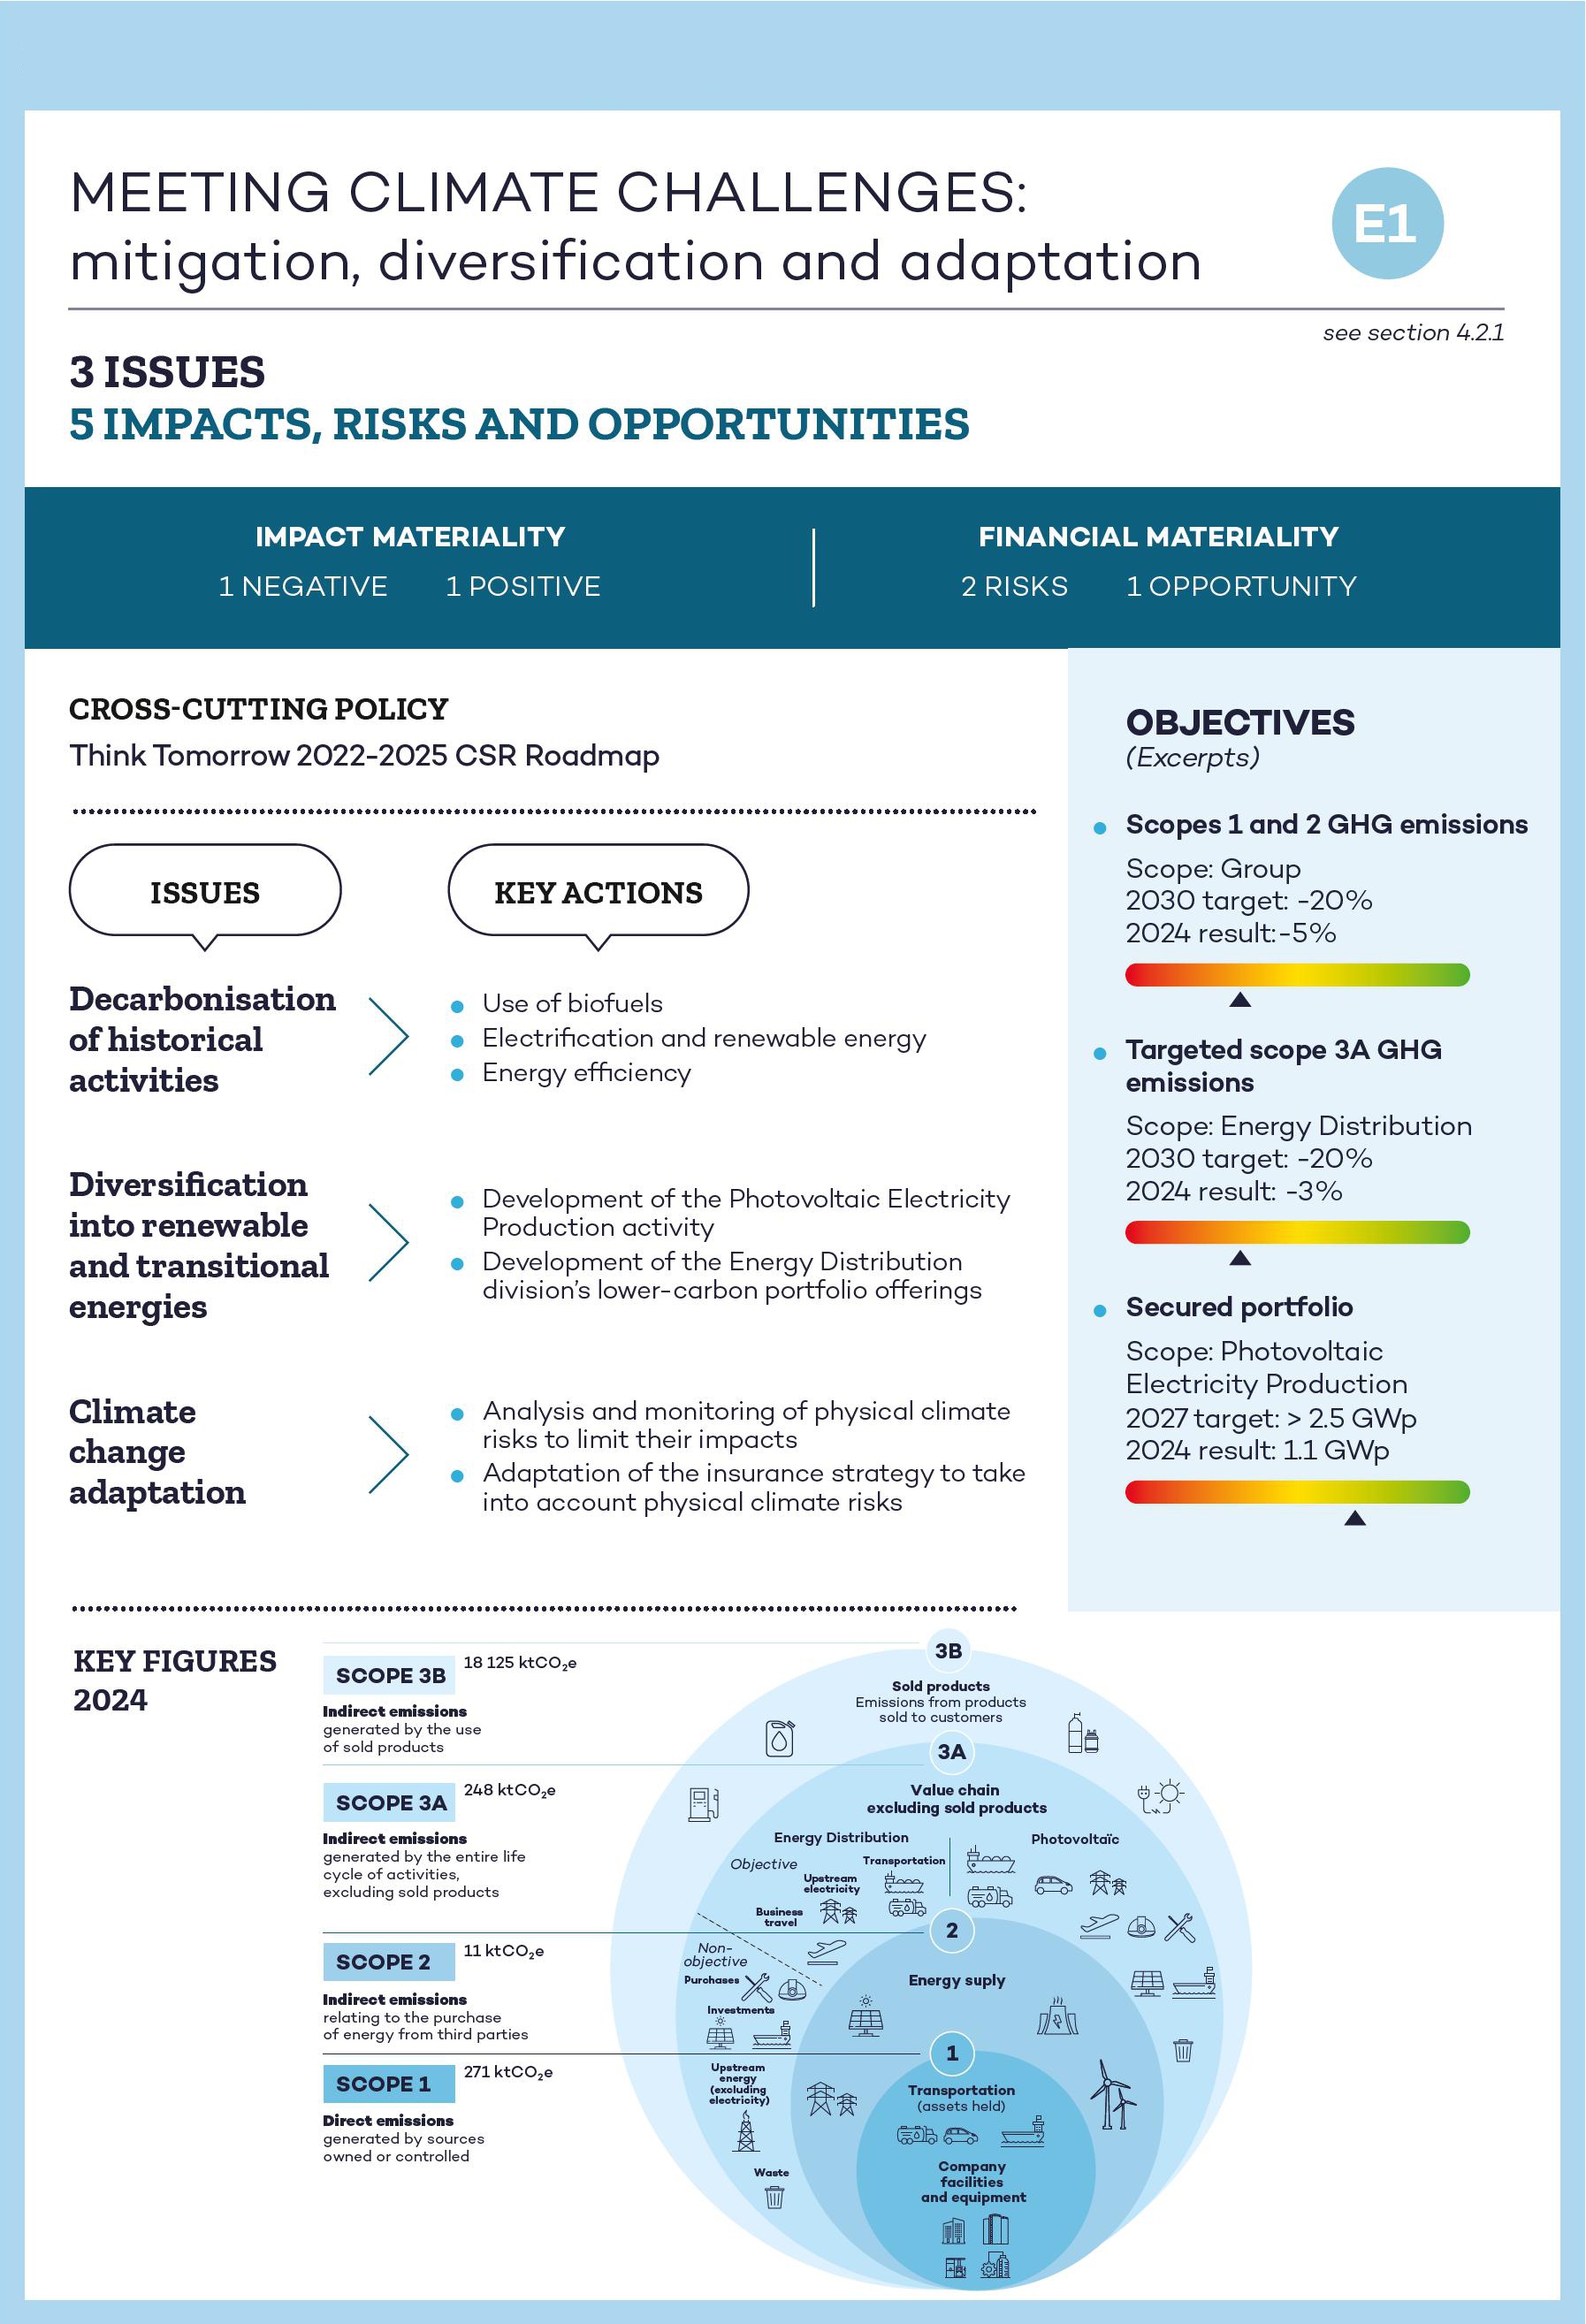
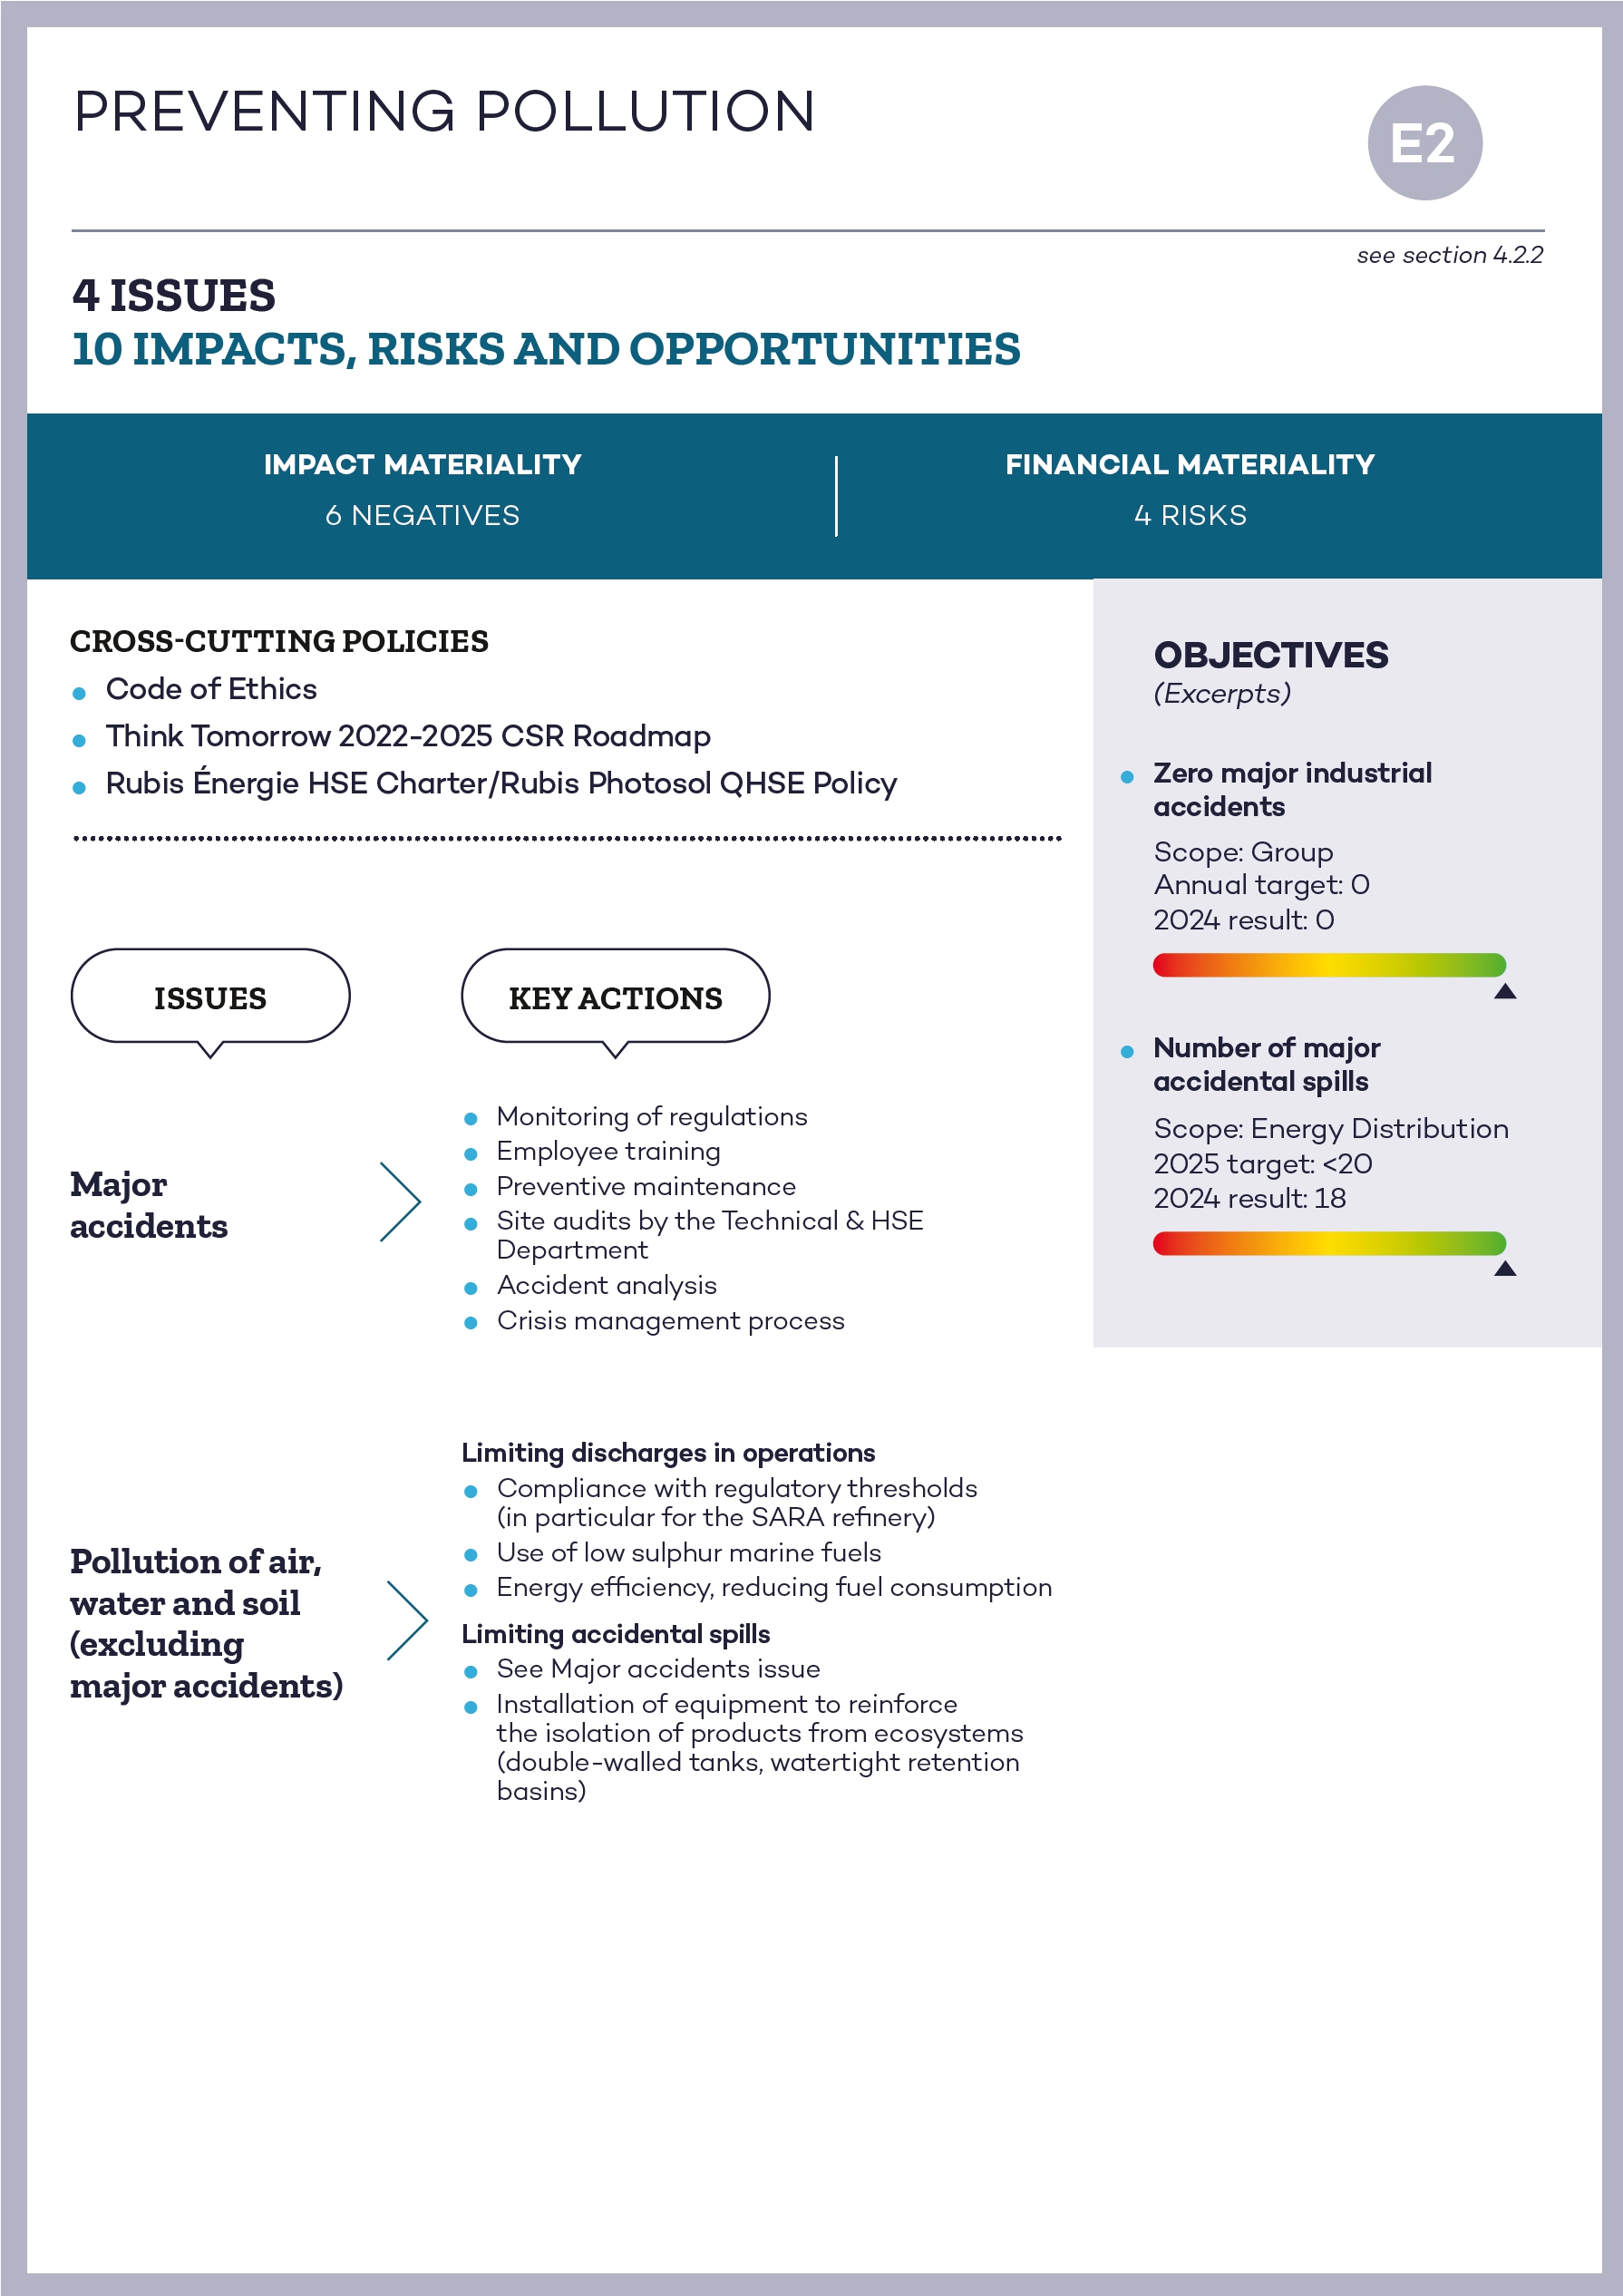
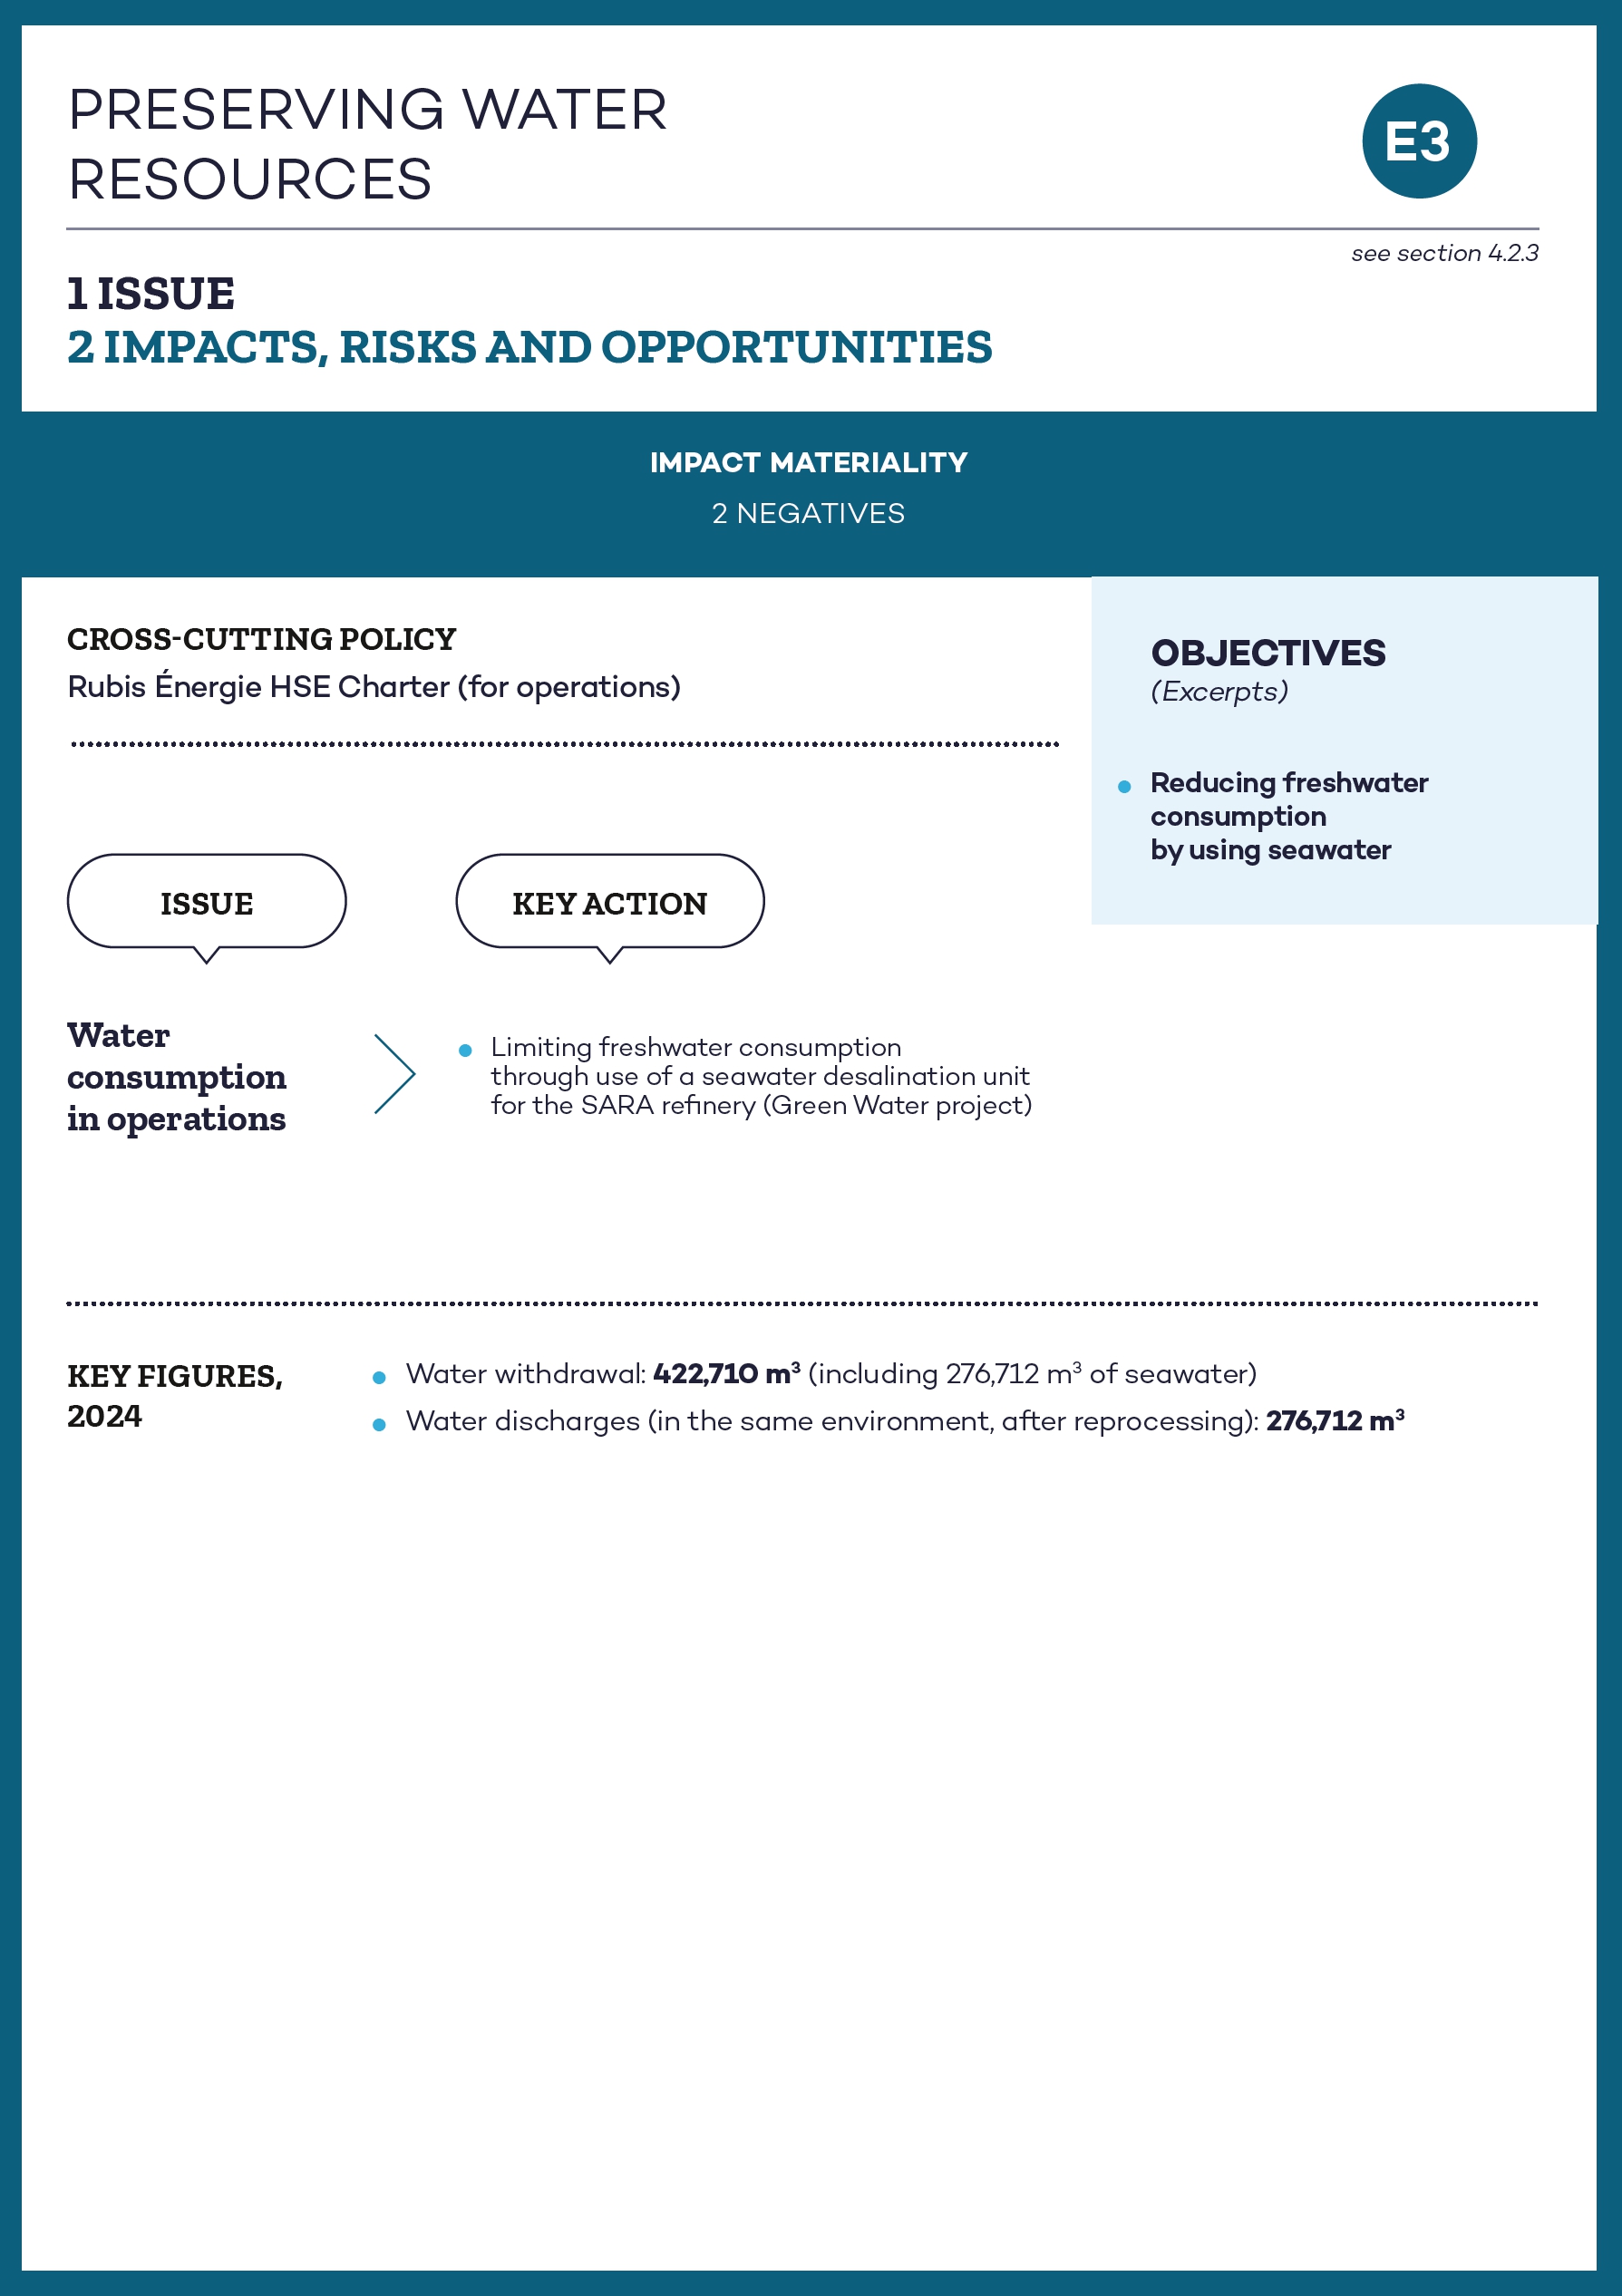
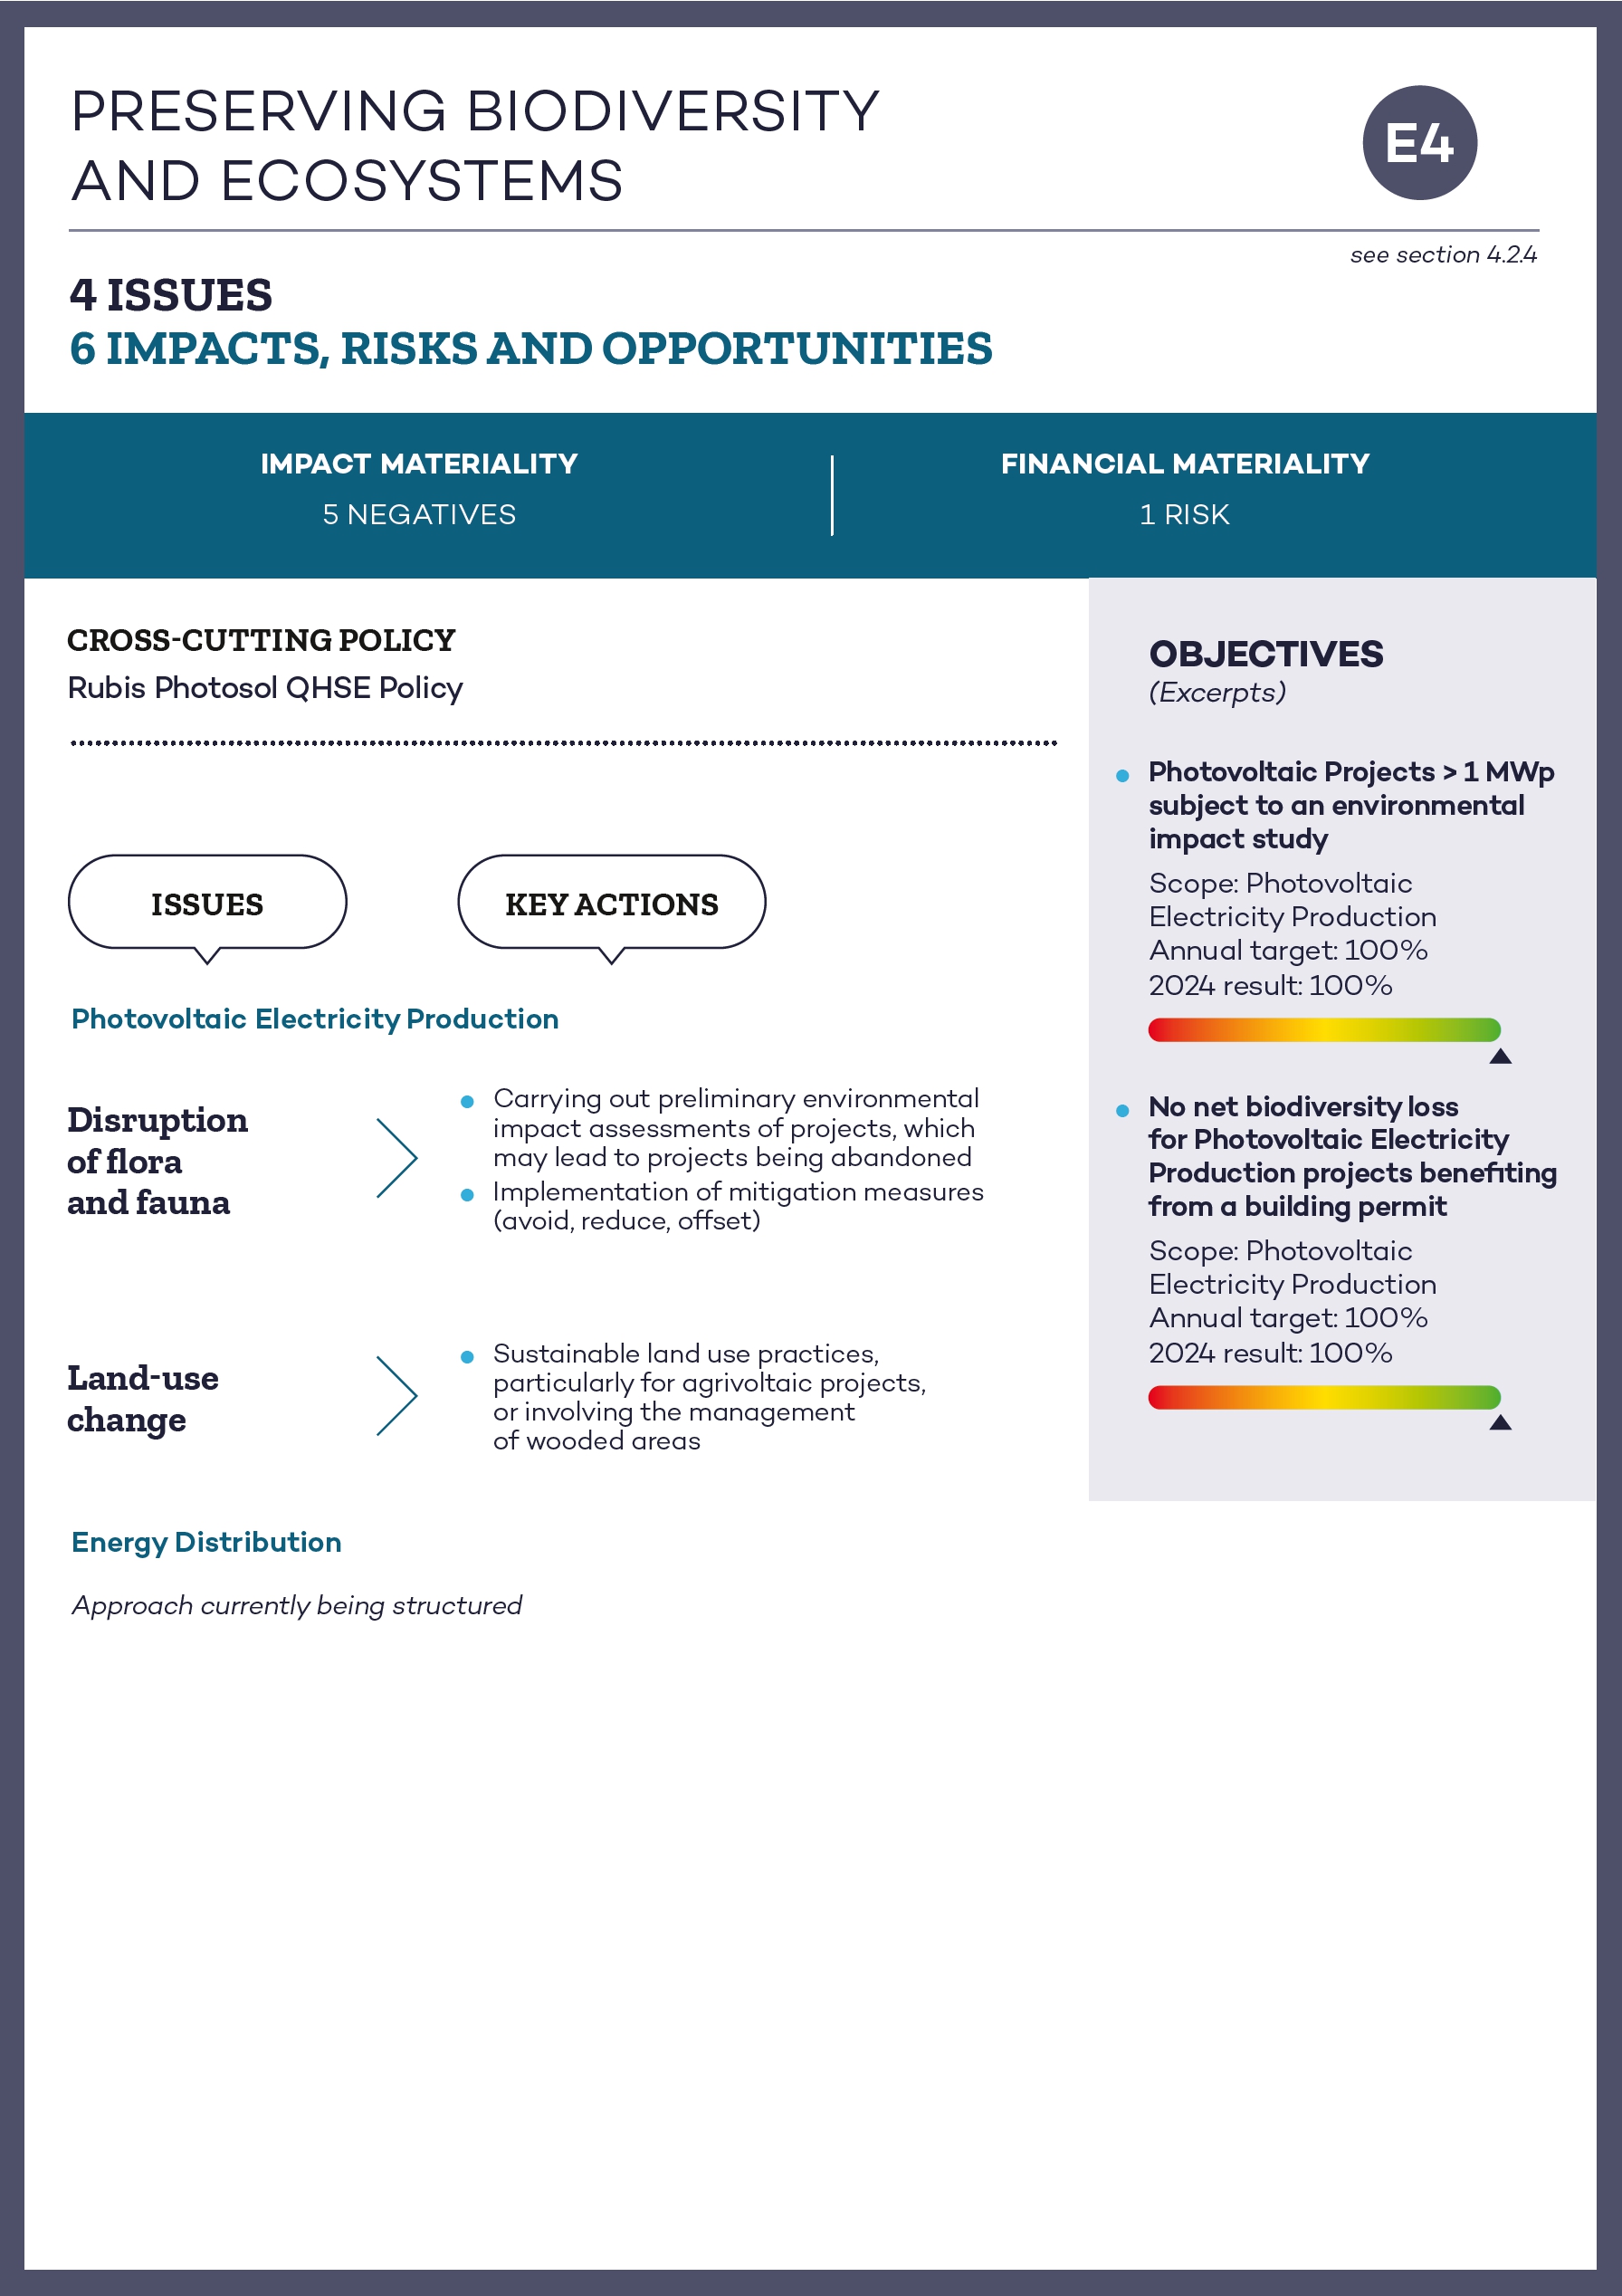
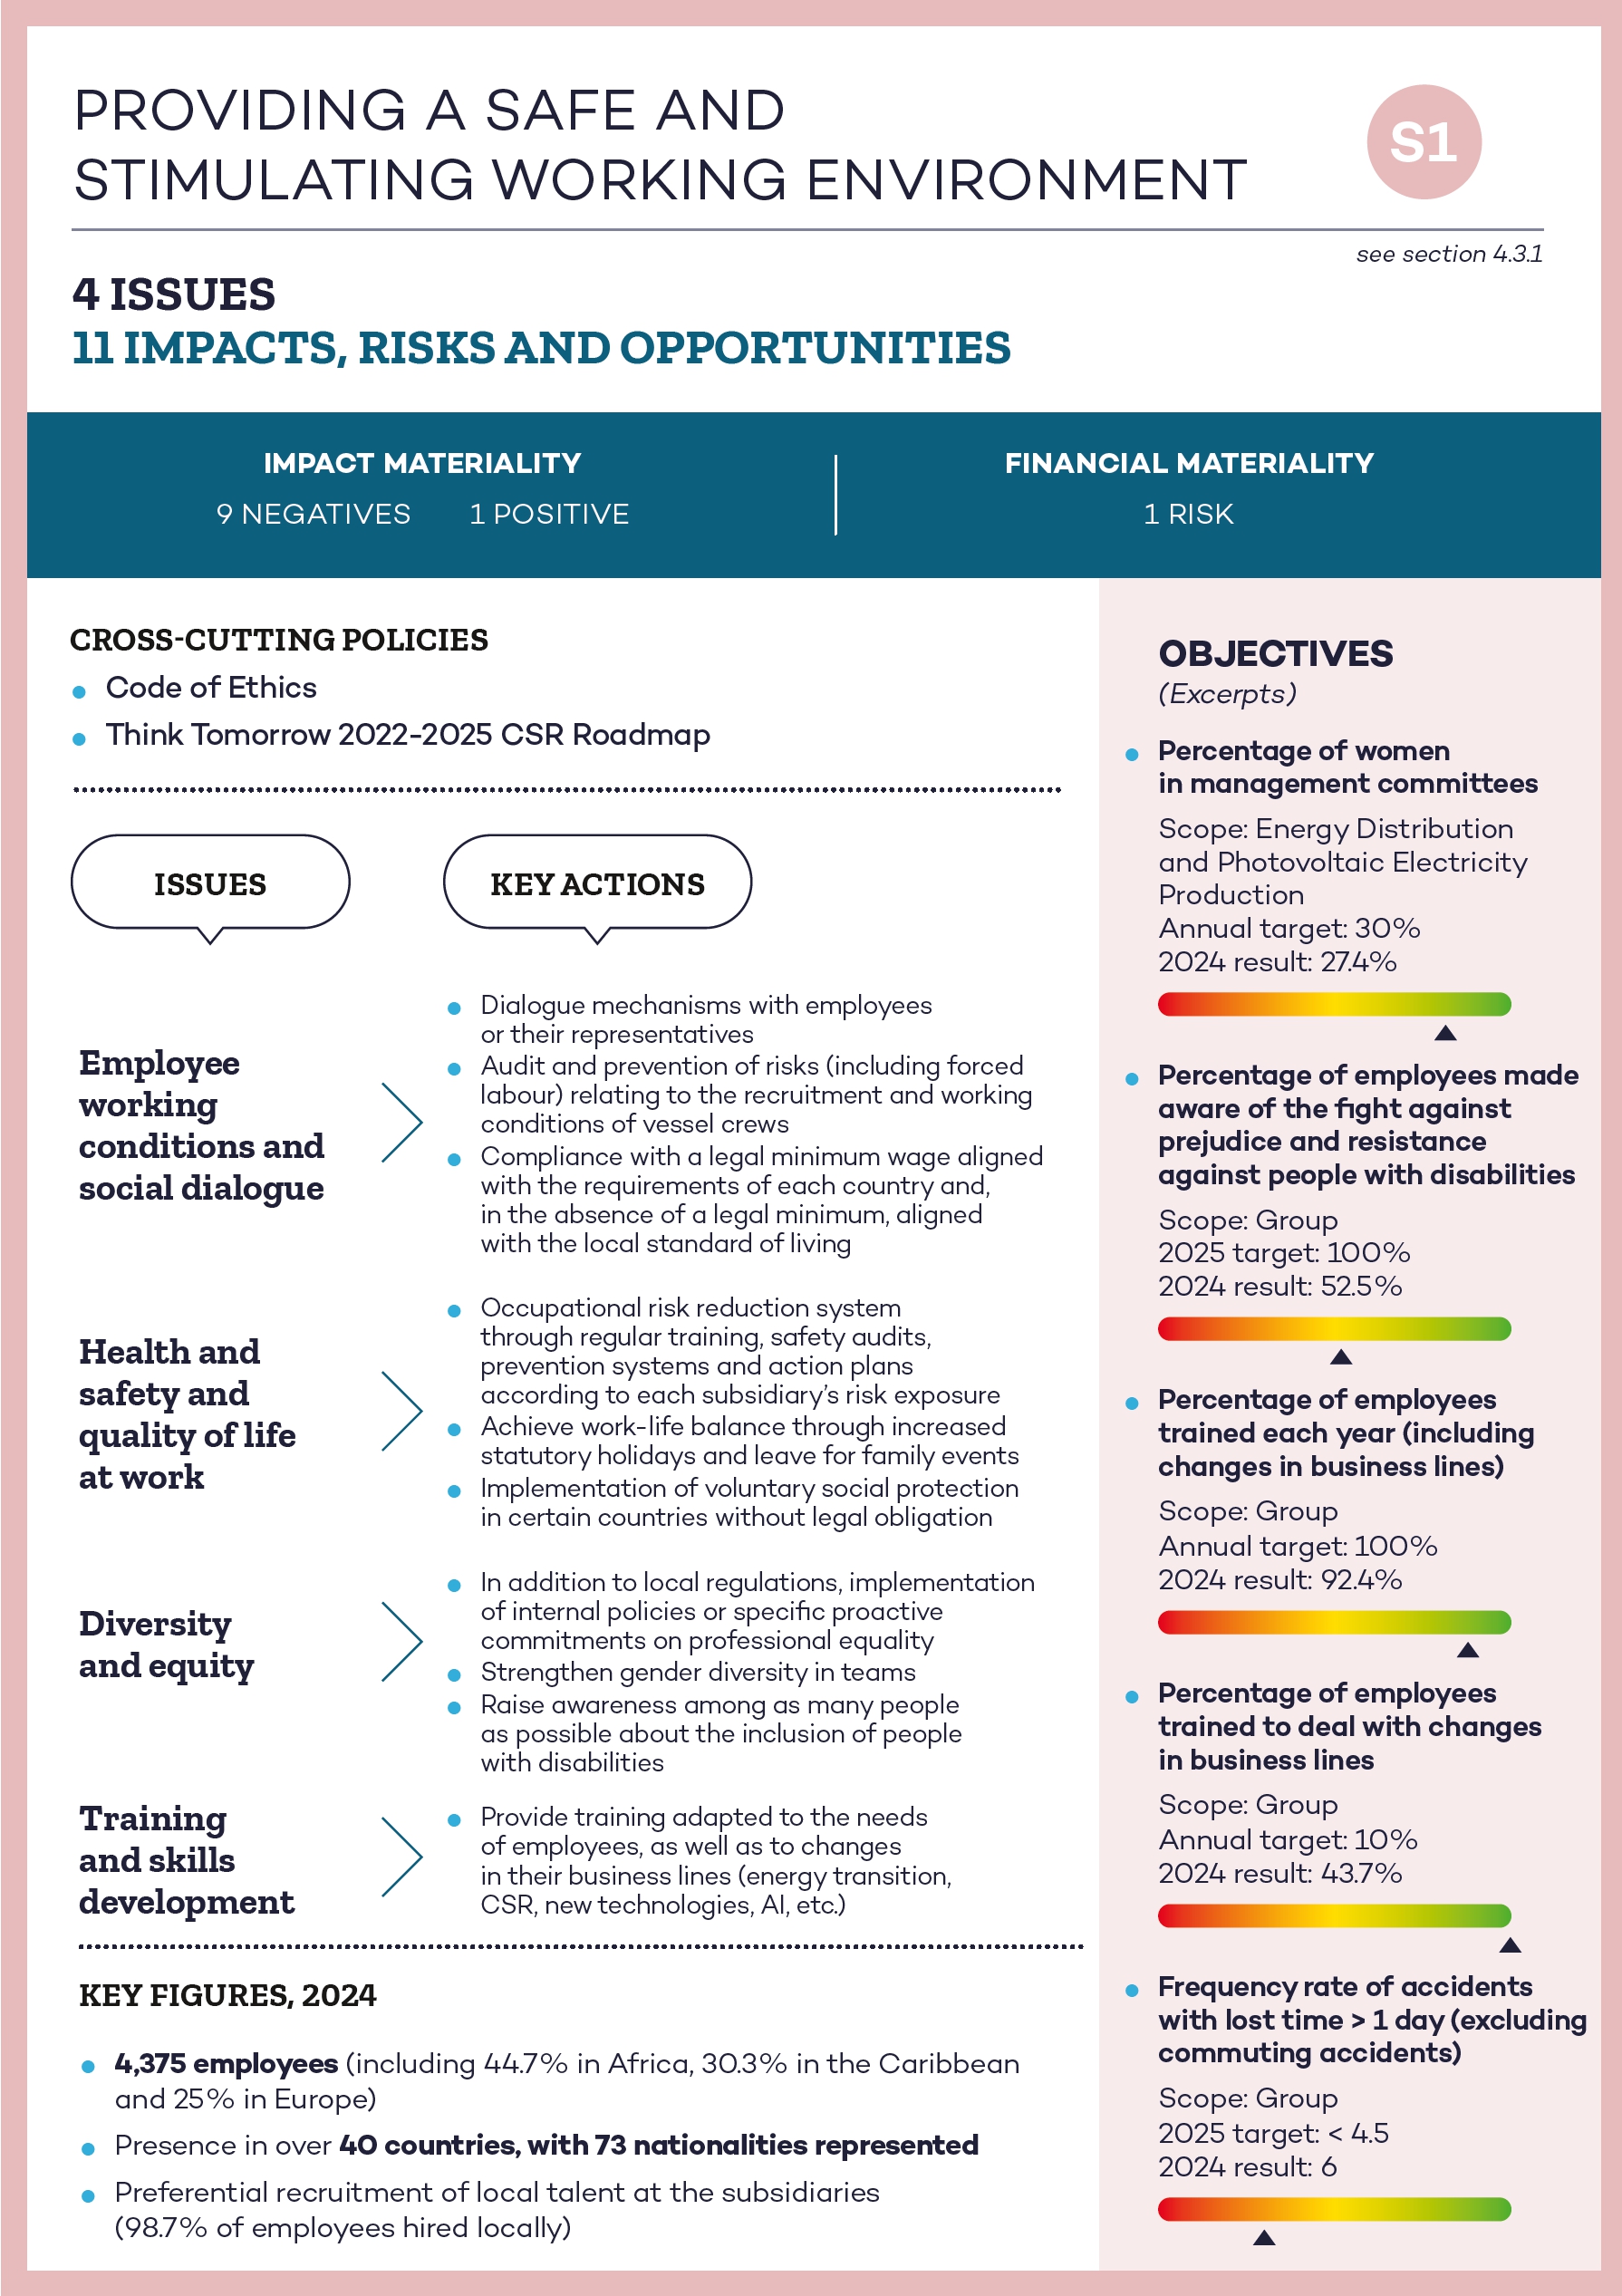
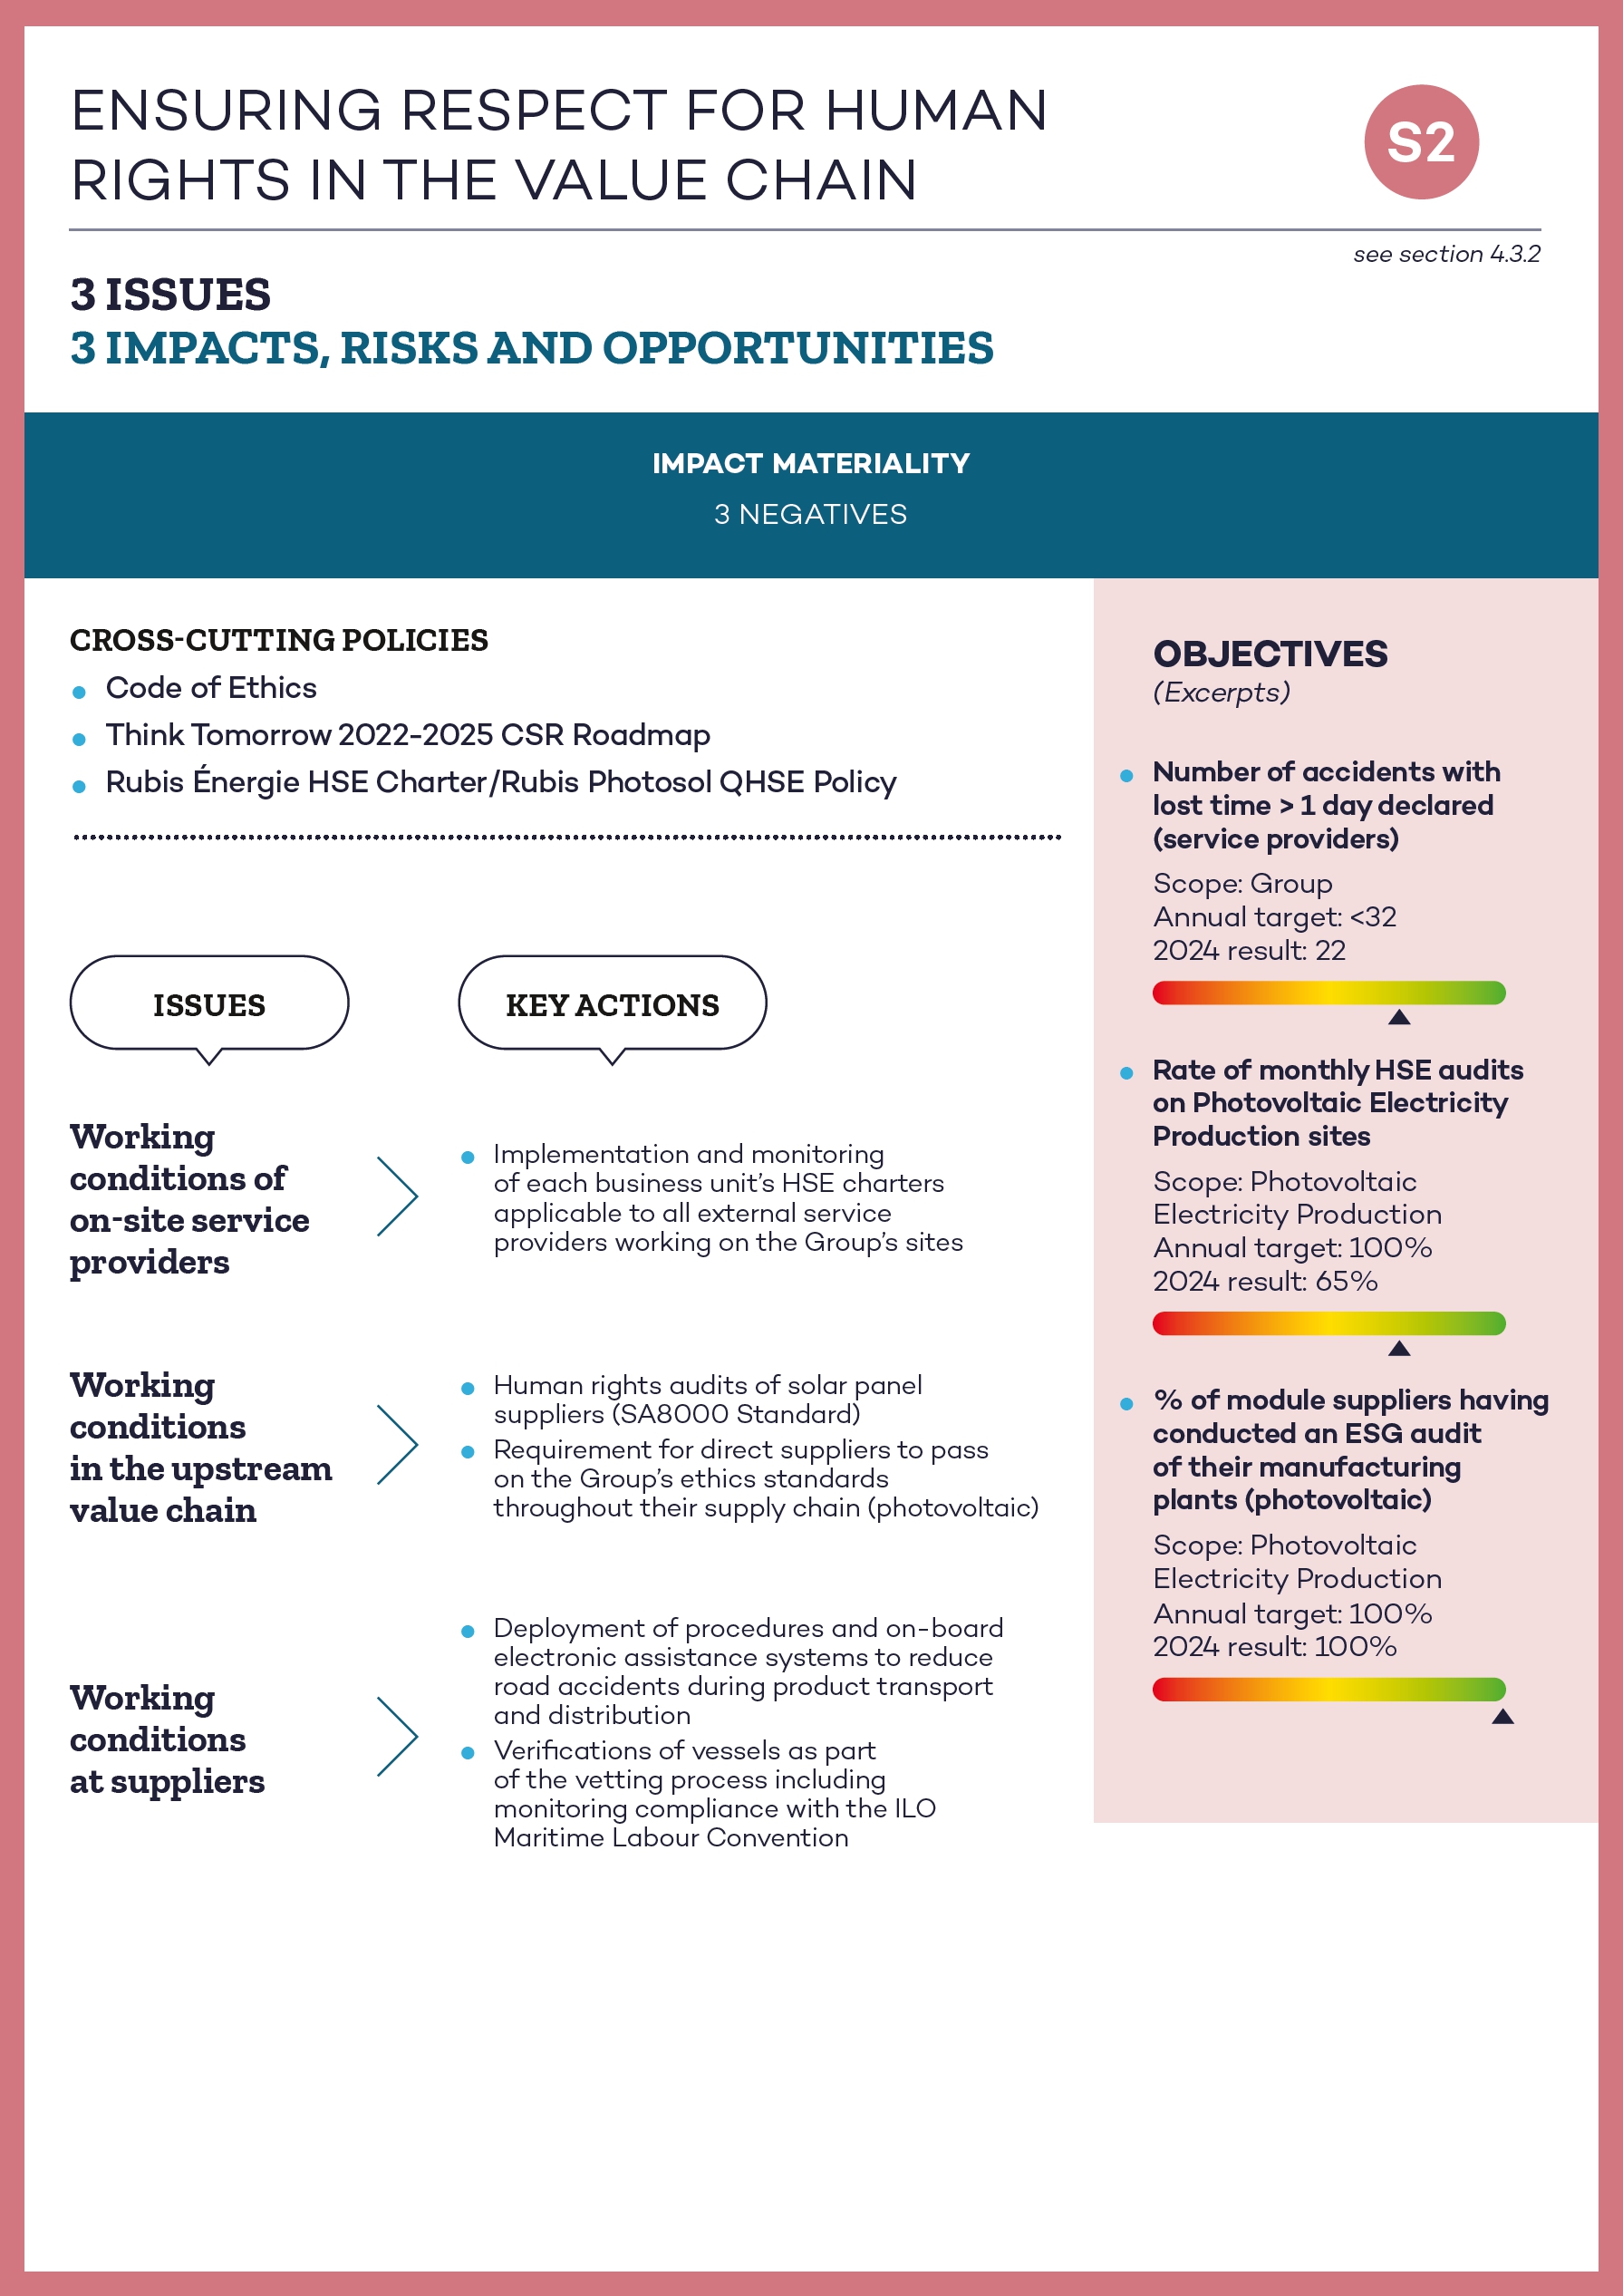
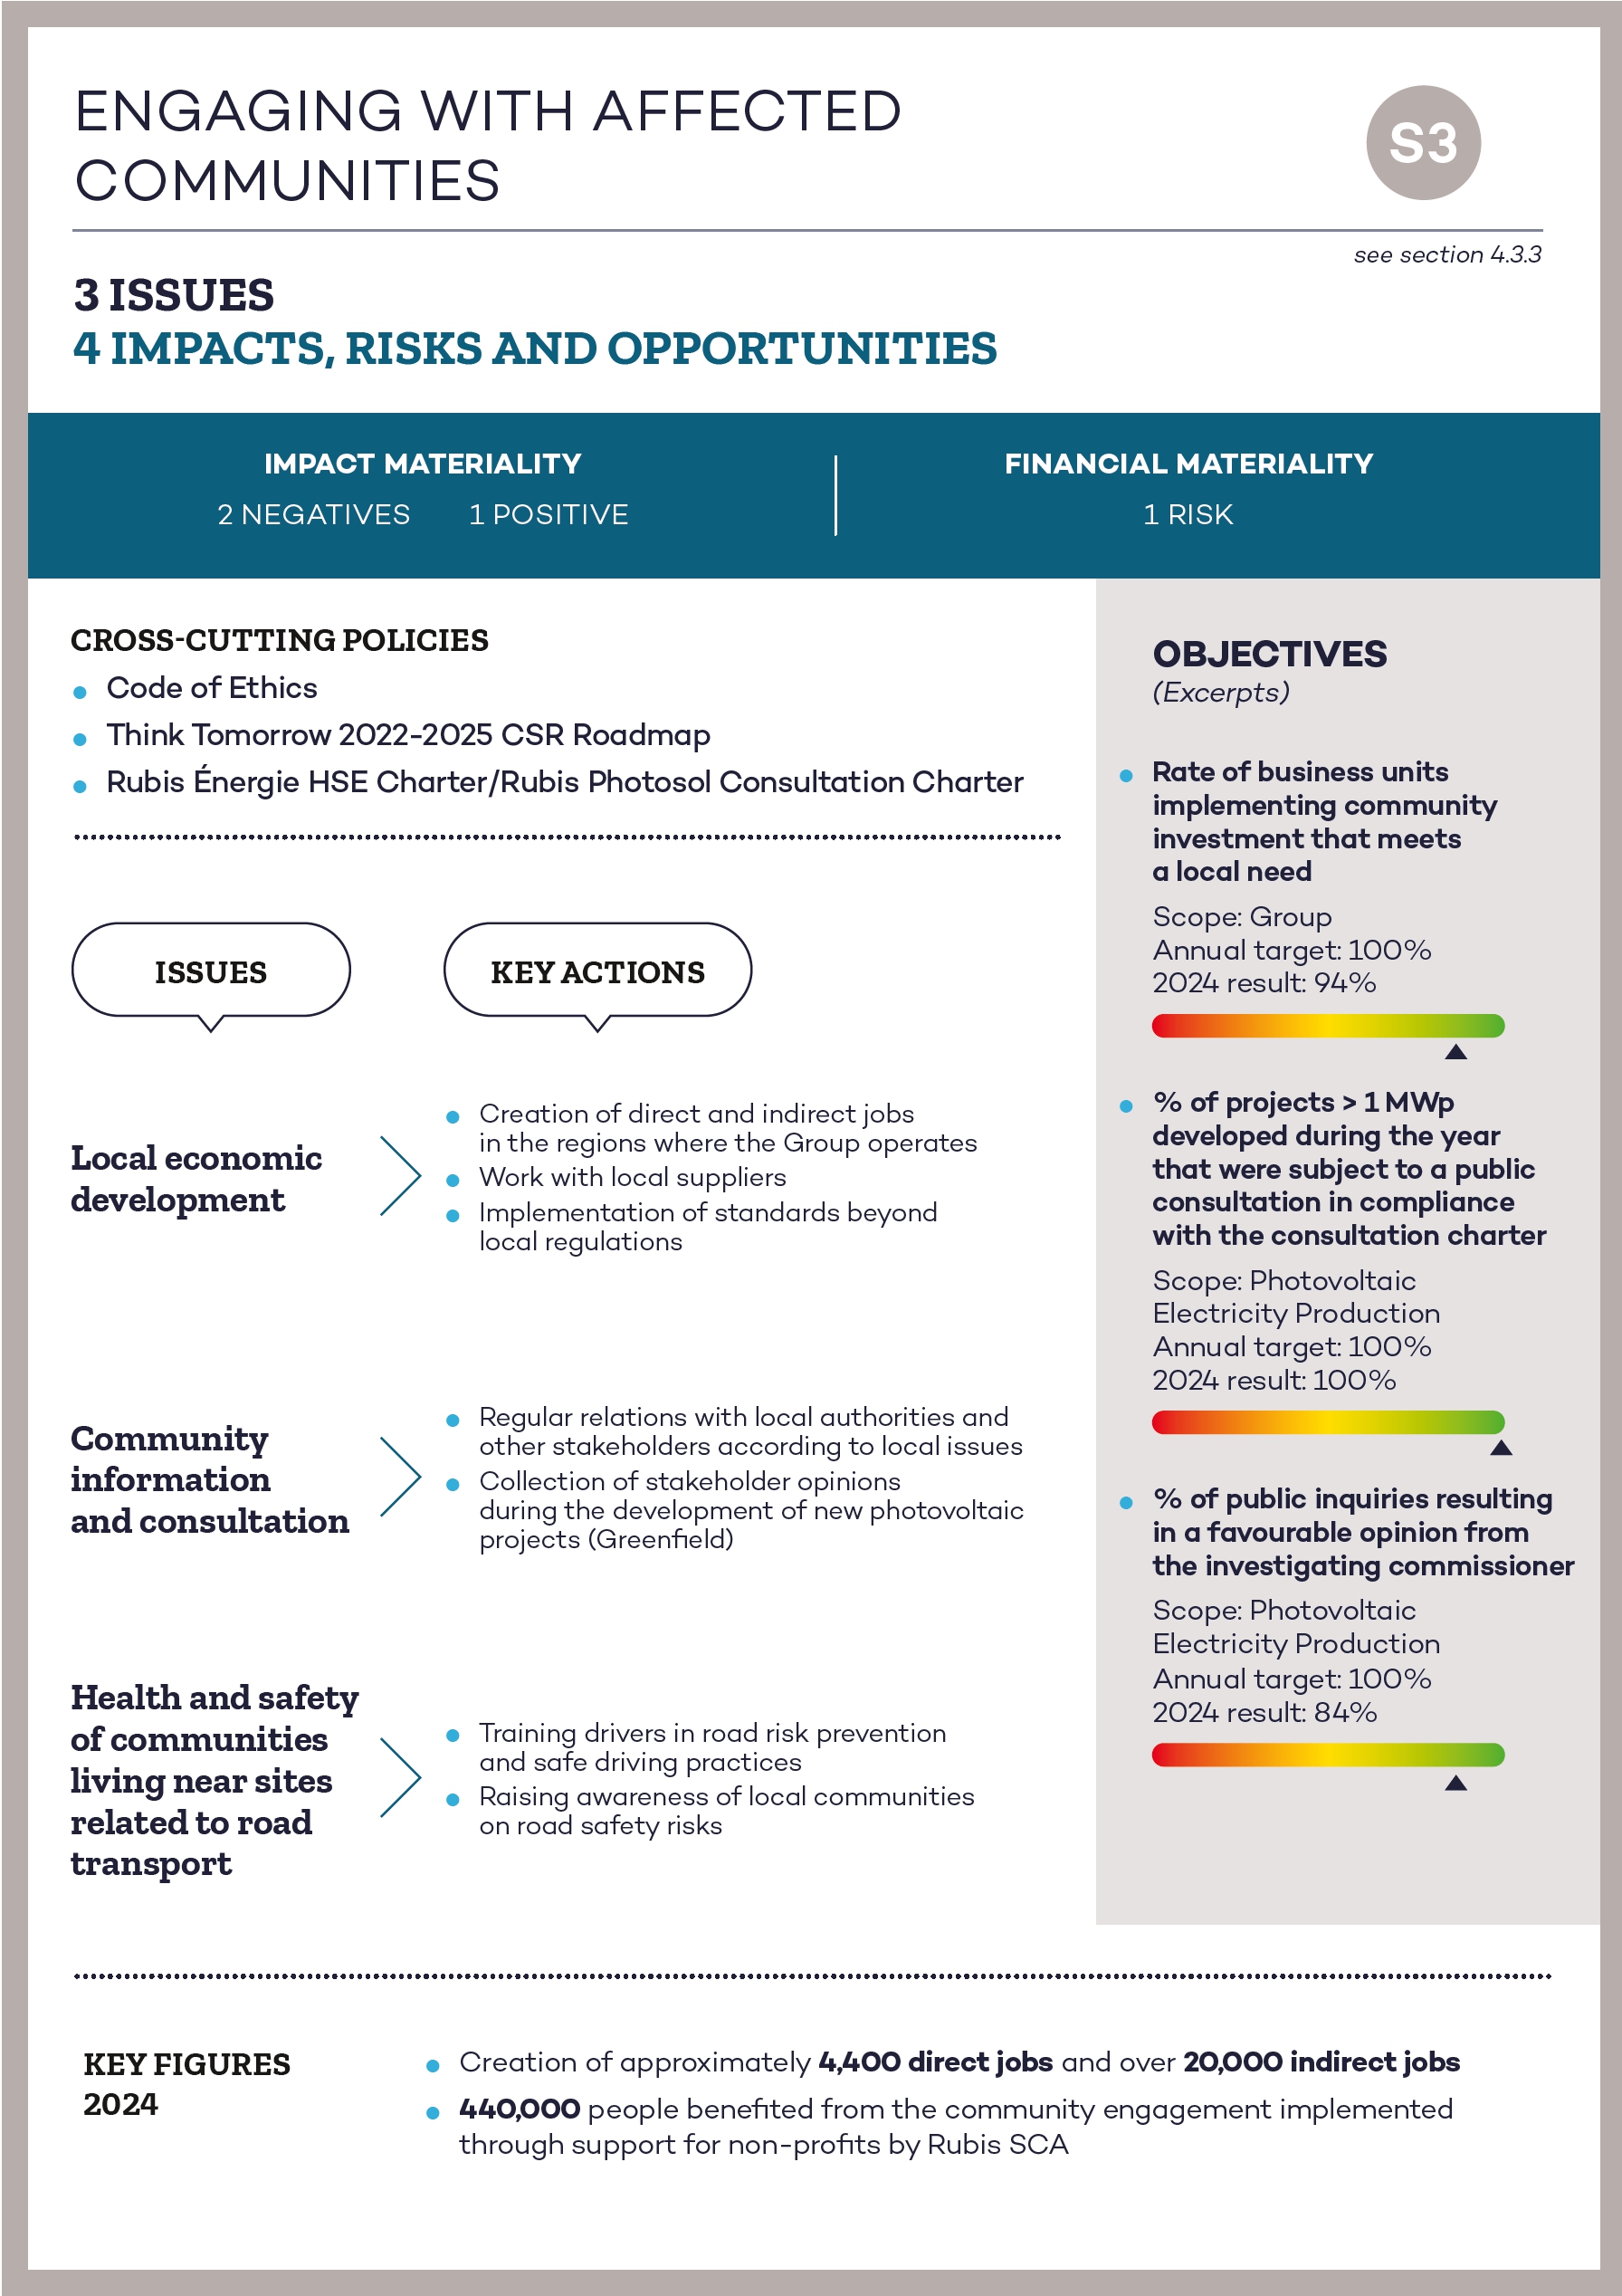
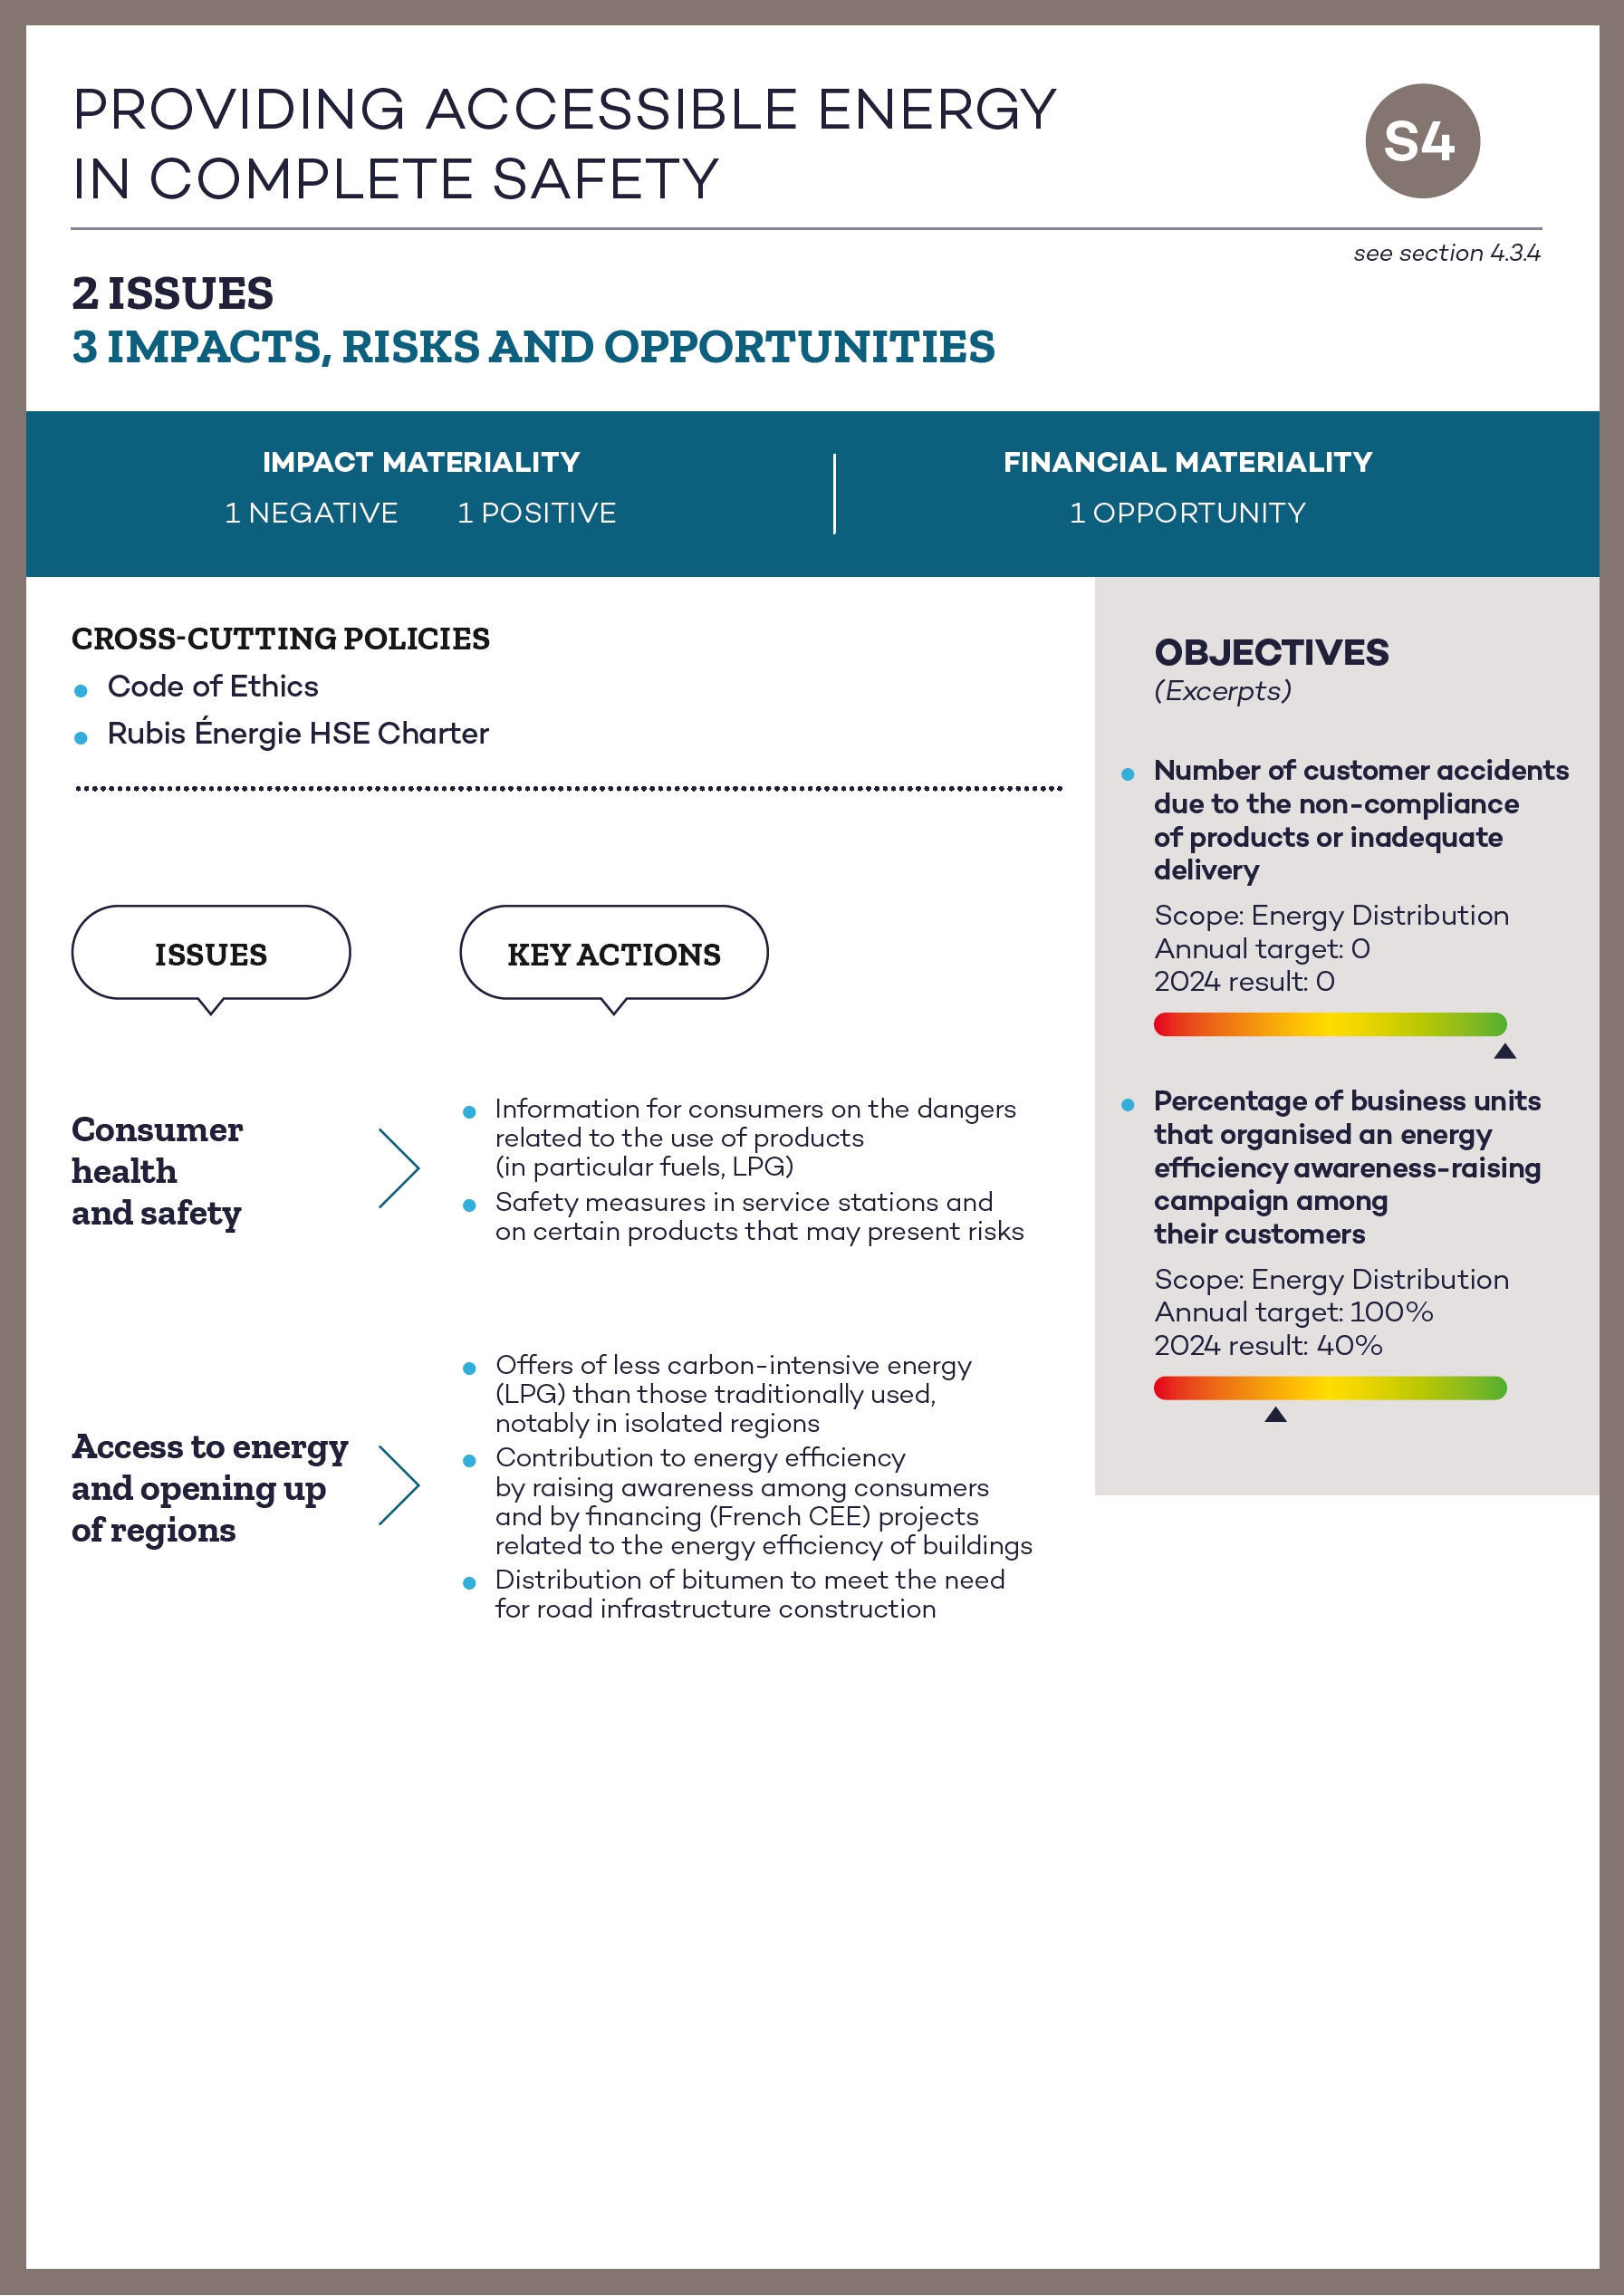
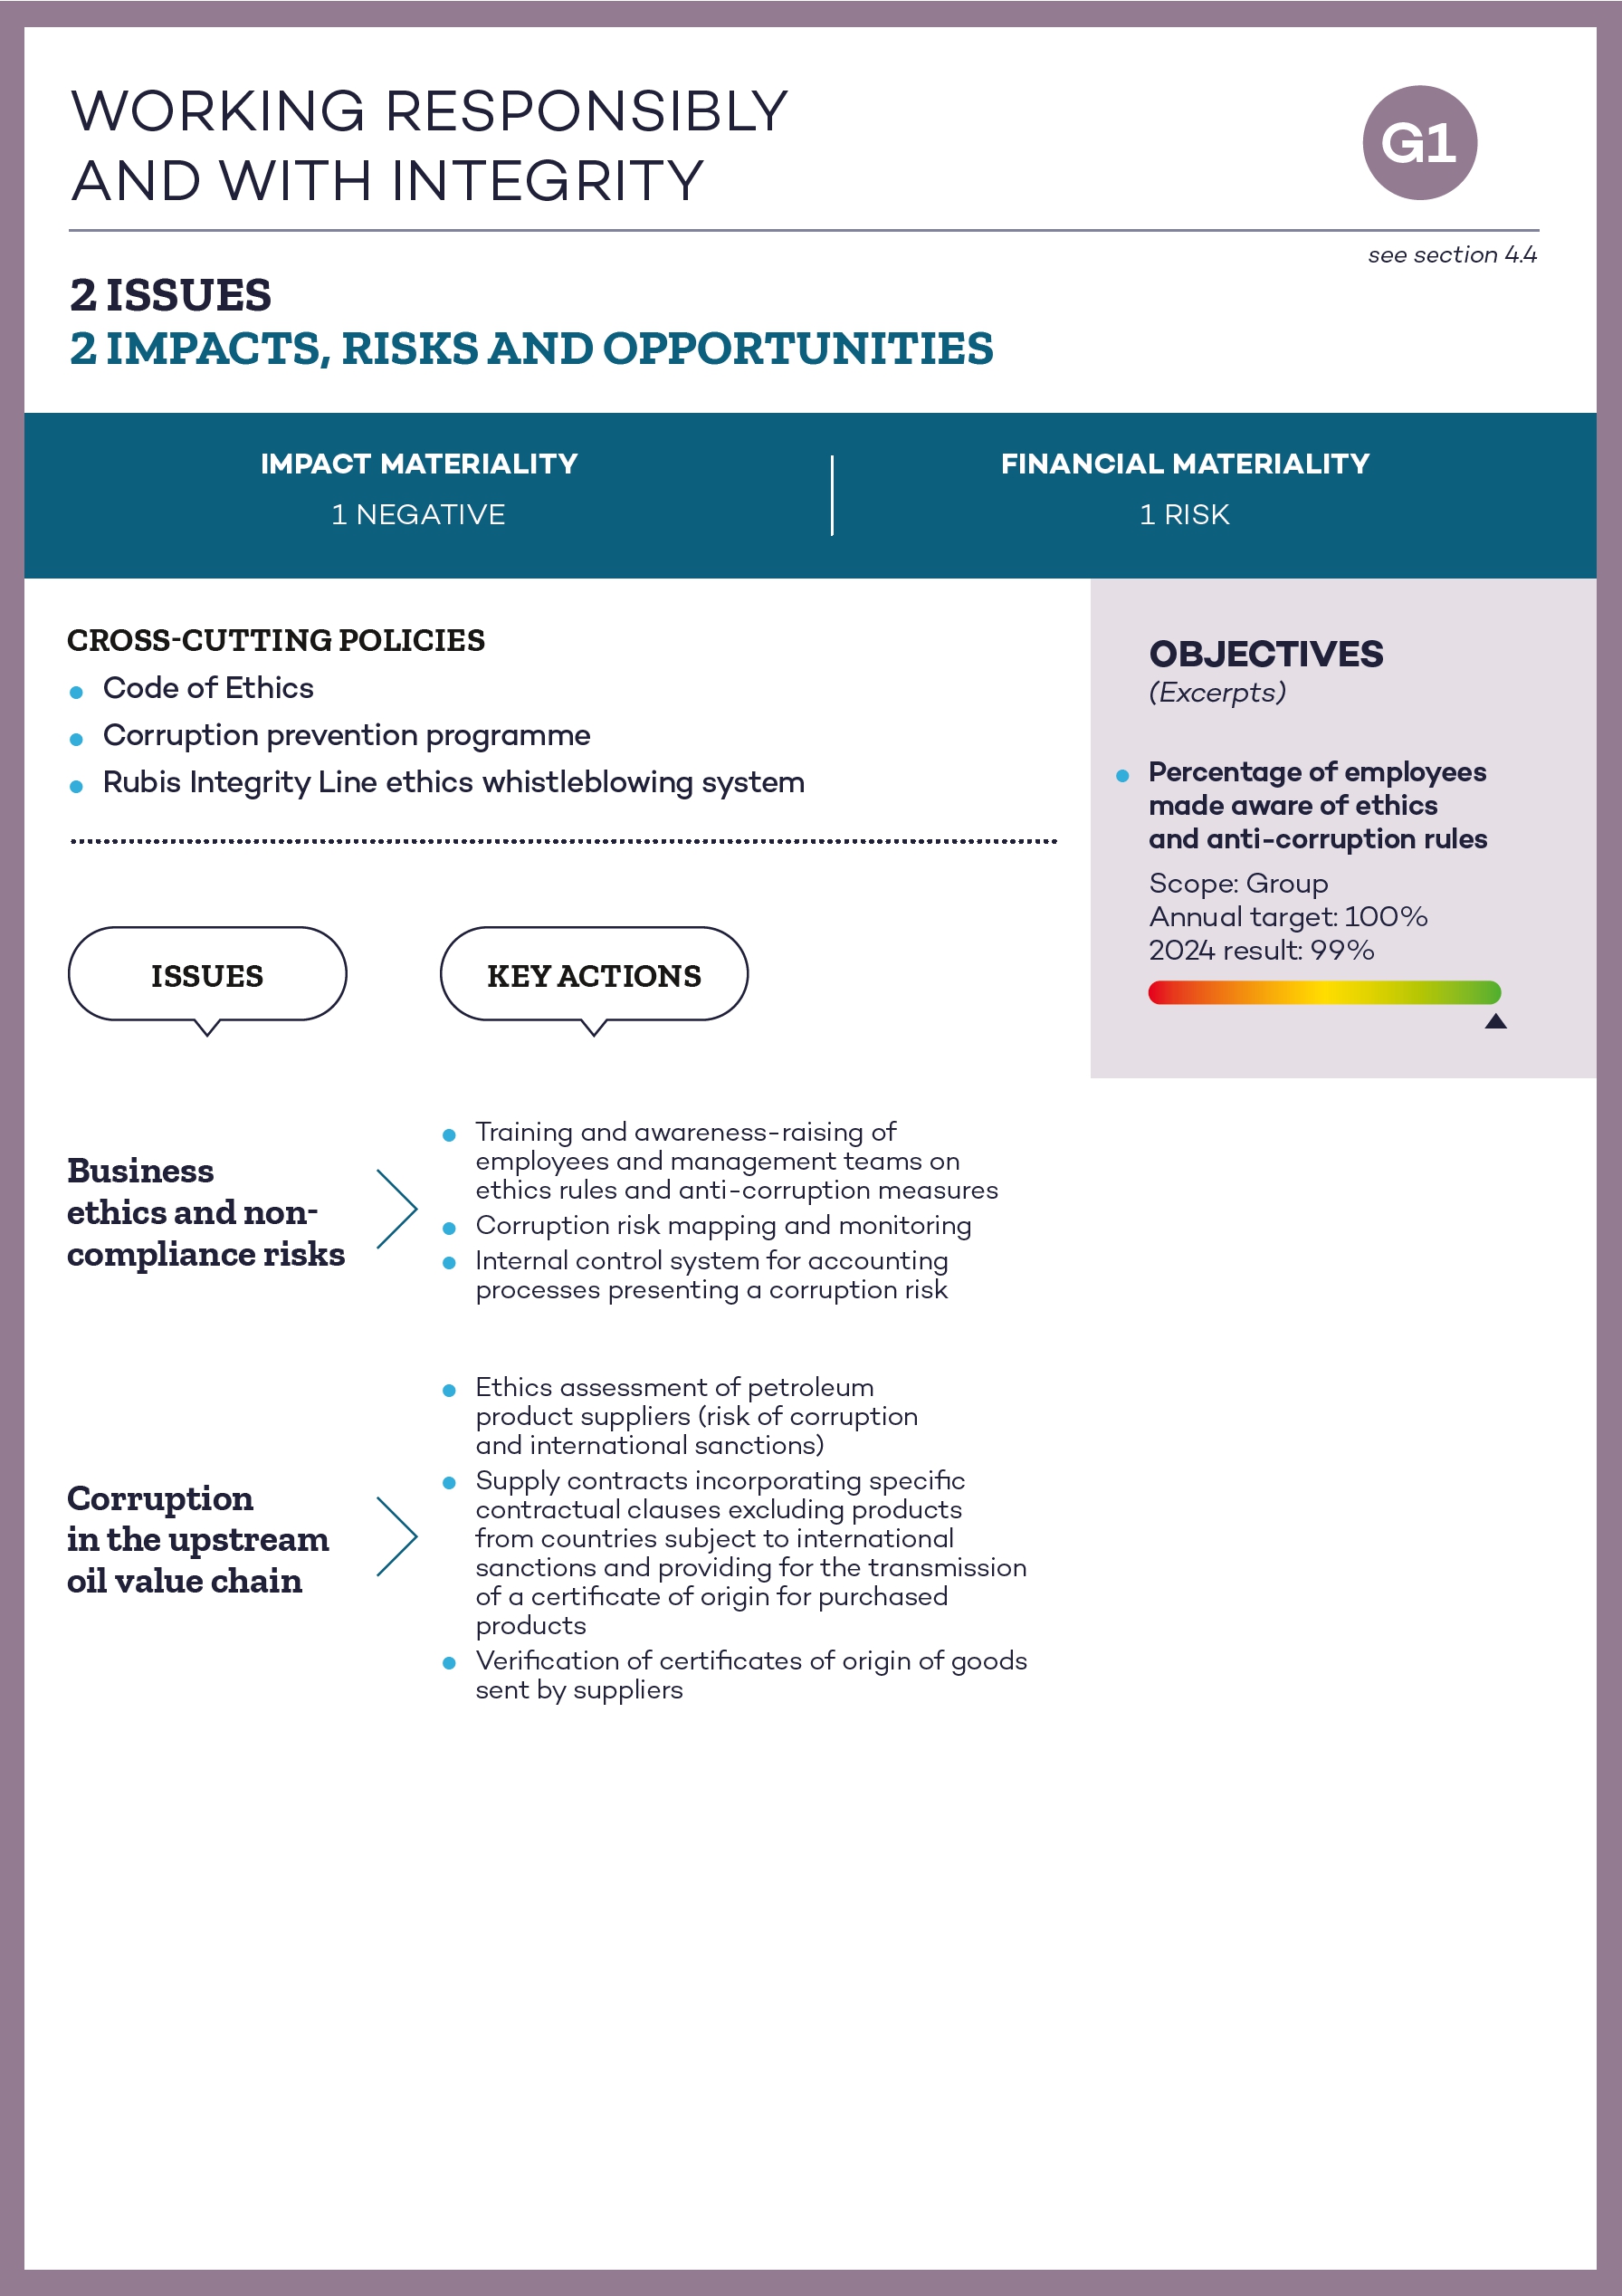
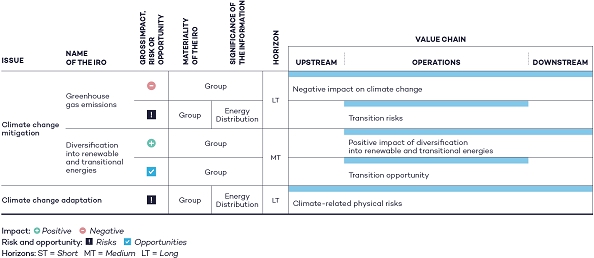
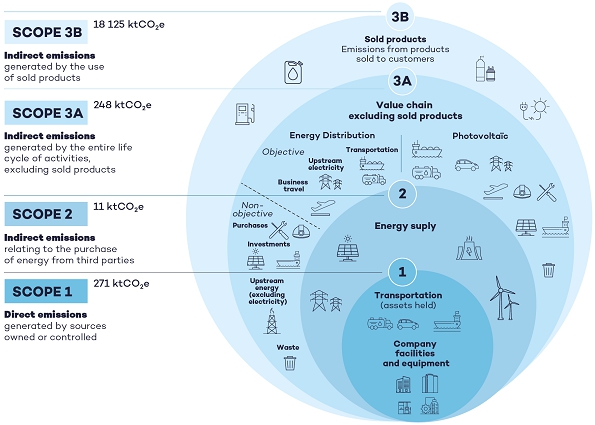
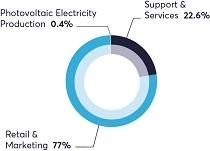
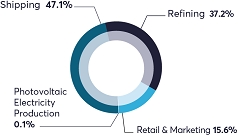
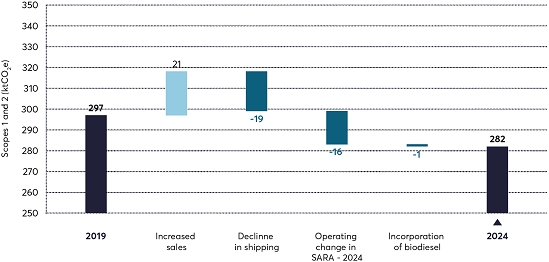
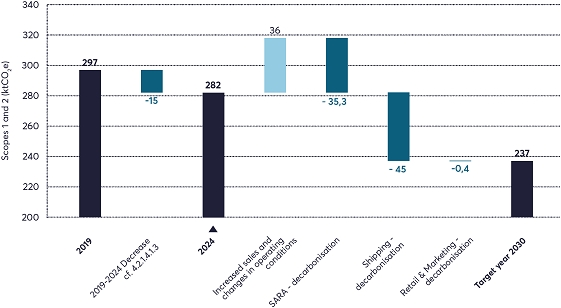


 Positive
  Negative
  Risks
Risks  Opportunities
 Opportunities